Graphene Nanoplatelets Market: Global Industry Analysis and Forecast (2024-2030)

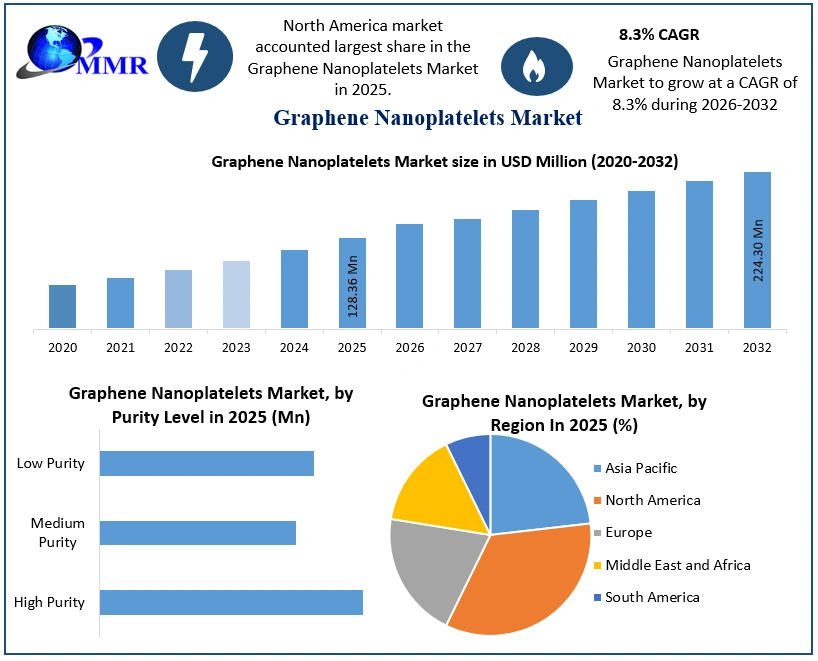
The Graphene Nanoplatelets Market size was valued at USD 109.44 Million in 2023 and the total Graphene Nanoplatelets revenue is expected to grow at a CAGR of 8.3 % from 2024 to 2030, reaching nearly USD 1011.77 Million by 2030. Graphene nanoplatelets are a made-up of graphite and graphene, having two-dimensional carbon structures that are form of single or multilayers of graphite. The increasing adoption of graphene nanoplatelets in various industries, including automotive, aerospace, energy, and healthcare, for enhancing material performance and enabling advanced technologies driving the growth of Graphene Nanoplatelets Market. Graphene nanoplatelets, consisting of several layers of graphene stacked in a platelet structure, possess remarkable properties such as high electrical conductivity, mechanical strength, and thermal conductivity, making them ideal for a wide range of applications including electronics, composites, energy storage, and coatings. The market is currently experiencing a surge in demand due to Research and development activities aimed at enhancing production techniques, expanding application areas, and reducing manufacturing costs are some major factors which are driving the Graphene Nanoplatelets Market growth. The rising investments in graphene-related projects, coupled with favorable government initiatives and supportive policies, are driving market growth. Recent developments by key market players such as Haydale Graphene Industries, XG Sciences, Angstron Materials, NanoXplore, and Grupo Antolin involve strategic collaborations, partnerships, product launches, and technological advancements aimed at strengthening their market presence, expanding product portfolios. Graphene Nanoplatelets MarketTo know about the Research Methodology:- Request Free Sample Report These developments include the introduction of innovative graphene nanoplatelet-based products, advancements in production processes to enhance scalability and cost-effectiveness, and strategic alliances with research institutions and industry partners to accelerate product development and commercialization. The increasing focus on sustainability and environmental regulations is driving the adoption of graphene nanoplatelets as eco-friendly alternatives in various applications, further propelling market growth. With continuous advancements in graphene nanoplatelet technology and expanding application scope, the market is poised for robust growth in the forecast period, offering lucrative opportunities for both existing players and new entrants in the global graphene nanoplatelets industry.

Graphene Nanoplatelets Market Dynamics:

Rising Demand for Lightweight, Flexible Electronic Devices Boosts Growth of Graphene Nanoplatelets Market The growing demand for lightweight, flexible, and high-performance electronic devices driving the growth of Graphene Nanoplatelets Market. For instance, Samsung's integration of graphene nanoplatelets into lithium-ion batteries for smartphones demonstrates their efficacy in enhancing energy density and charging speed, driving adoption. Additionally, the focus on energy storage solutions boosts research into graphene nanoplatelets for supercapacitors and batteries. Tesla's acquisition of Maxwell Technologies underscores graphene's potential in improving energy storage technologies, boosting Graphene Nanoplatelets Market growth. Industries such as aerospace and automotive increasingly leverage graphene nanoplatelets to enhance composite materials' mechanical properties and reduce weight. Collaborations such as Airbus and Haydale Graphene Industries' development of graphene-enhanced aircraft components showcase the material's potential for improving structural performance. Similarly, graphene's biocompatibility and large surface area make it promising in biomedical applications like drug delivery and tissue engineering. Rice University's development of a graphene nanoplatelet-based platform for targeted drug delivery highlights its transformative potential in healthcare technologies. Investments in research and development, supported by governments all across the world, drive market growth by fostering innovation and commercialization. Initiatives like the European Union's Graphene Flagship initiative provide substantial funding and collaboration opportunities, accelerating graphene-based technology development. Advancements in manufacturing techniques by companies such as XG Sciences enable widespread adoption across industries, while the increasing uptake of graphene nanoplatelets in emerging markets like Asia-Pacific and Latin America further contributes to market growth. High-cost treatment Hindering the market growth The complexity of production processes leads to high manufacturing costs, hindering cost-effective production methods impacting the growth of Graphene Nanoplatelets Market. Companies such as Angstrom Materials struggle to overcome this challenge, impeding widespread adoption across industries. Scalability remains a significant hurdle, limiting mass production capabilities. Despite efforts by companies like XG Sciences to scale up production while maintaining quality standards, challenges persist, hindering market growth potential. Stringent regulations regarding the use and disposal of graphene nanoplatelets pose hurdles for Graphene Nanoplatelets Market players. Companies such as NanoXplore encounter regulatory obstacles related to graphene's classification as a nanomaterial, affecting market penetration and limiting growth opportunities. The absence of standardized testing methods and quality control measures complicates manufacturing and application processes, affecting market dynamics. End-users, especially electronics manufacturers, demand consistency and reliability in graphene-based products, necessitating standardization efforts to drive market growth. Uncertainties regarding the long-term health and safety implications of graphene nanoplatelets raise concerns among consumers and regulatory authorities, further inhibiting market acceptance. Instances of toxicity in certain graphene formulations, as reported by research conducted at Brown University, prompt heightened scrutiny and regulatory caution, impacting market expansion efforts. Competition from alternative materials, such as carbon nanotubes, poses challenges to graphene's market dominance, particularly in applications where cost-effectiveness is a primary concern. These challenges collectively contribute to the fragmentation of the graphene nanoplatelets market, making it difficult for consumers to navigate product offerings and inhibiting Graphene Nanoplatelets Market growth.

Graphene Nanoplatelets Market Segment Analysis:

Based on Application, composites segment dominated the Graphene Nanoplatelets Market in 2023, due to their widespread adoption across industries such as aerospace, automotive, and construction, leveraging graphene's enhanced mechanical properties to produce lightweight and high-strength materials. Energy storage represents another significant application area, with graphene nanoplatelets being extensively researched for use in batteries and supercapacitors to enhance energy density and charging capabilities. Conductive inks are gaining traction in printed electronics and flexible electronics industries, driven by graphene's high conductivity and compatibility with printing processes. Coatings also show promising growth, particularly in corrosion protection and barrier applications, owing to graphene's impermeability and durability. Other applications, including biomedical devices, sensors, and filtration, are emerging but may face challenges related to scalability and regulatory approval. Graphene Nanoplatelets Market

Graphene Nanoplatelets Market Regional Insights:

North America Dominated the Graphene Nanoplatelets Market North America dominated the Graphene Nanoplatelets Market in 2023, as it expected a significant portion of revenue throughout the forecast period. Spearheaded by the United States and Canada, this region stands as the primary revenue generator within the market. Recent strides in material science have birthed a slew of innovative substances with vast potential across various sectors. The intensifying focus on graphene nanoplatelets within the construction realm fuels the projected revenue surge in North America, propelled by increasing research and development endeavors. The Asia-Pacific landscape solidifies its standing as the second-largest revenue hub globally, buoyed by escalating demand for graphene nanoplatelets across diverse sectors like automotive, aerospace, energy, and consumer electronics. The region's robust consumer electronics industry serves as a catalyst, fostering a fertile environment for heightened product demand. With a burgeoning consumer base and escalating desire for cutting-edge technologies such as LCDs, OLEDs, and smart televisions, the Asia-Pacific market is primed for substantial revenue growth in the foreseeable future.

Graphene Nanoplatelets Market Scope: Inquire before buying

Global Graphene Nanoplatelets Market
Report Coverage Details
Base Year: 2023 Forecast Period: 2024-2030
Historical Data: 2018 to 2023 Market Size in 2023: US $ 109.44 Mn.
Forecast Period 2024 to 2030 CAGR: 8.3% Market Size in 2030: US $ 1011.77 Mn.
Segments Covered: by Purity Level High Purity Medium Purity Low Purity
by Application Composites Energy Storage Conductive Inks Coatings Others
by End Use Industry Automotive Electronics Aerospace Energy Construction Healthcare

Graphene Nanoplatelets Market, by Region

North America (United States, Canada and Mexico) Europe (UK, France, Germany, Italy, Spain, Sweden, Austria and Rest of Europe) Asia Pacific (China, South Korea, Japan, India, Australia, Indonesia, Malaysia, Vietnam, Taiwan, Bangladesh, Pakistan and Rest of APAC) Middle East and Africa (South Africa, GCC, Egypt, Nigeria and Rest of ME&A) South America (Brazil, Argentina Rest of South America)

Graphene Nanoplatelets Market Key Players:

Major Contributors in the Graphene Nanoplatelets Industry: 1. Haydale Graphene Industries plc - United Kingdom 2. Graphenea - Spain 3. XG Sciences - United States 4. Angstron Materials - United States 5. NanoXplore - Canada 6. Applied Graphene Materials - United Kingdom 7. Grafoid Inc. - Canada 8. ACS Material - United States 9. Thomas Swan & Co. Ltd. - United Kingdom 10. Talga Resources - Australia 11. Nanocyl - Belgium 12. Saint Jean Carbon - Canada 13. Versarien - United Kingdom 14. G6 Materials - United States 15. Graphmatech - Sweden FAQs: 1] Which region is expected to hold the highest share in the Global Market? Ans. North America region is expected to hold the highest share in the Graphene Nanoplatelets Market. 2] What is the market size of the Global Graphene Nanoplatelets Market by 2030? Ans. The market size of the Graphene Nanoplatelets Market by 2030 is expected to reach US$ 1011.77 Million. 3] What is the forecast period for the Global Graphene Nanoplatelets Market? Ans. The forecast period for the Graphene Nanoplatelets Market is 2024-2030. 4] What was the market size of the Global Graphene Nanoplatelets Market in 2023? Ans. The market size of the Graphene Nanoplatelets Market in 2023 was valued at US$ 109.44 Million.
1. Graphene Nanoplatelets Market Introduction 1.1. Study Assumption and Market Definition 1.2. Scope of the Study 1.3. Executive Summary 2. Graphene Nanoplatelets Market: Dynamics 2.1. Graphene Nanoplatelets Market Trends by Region 2.1.1. North America Graphene Nanoplatelets Market Trends 2.1.2. Europe Graphene Nanoplatelets Market Trends 2.1.3. Asia Pacific Graphene Nanoplatelets Market Trends 2.1.4. Middle East and Africa Graphene Nanoplatelets Market Trends 2.1.5. South America Graphene Nanoplatelets Market Trends 2.2. Graphene Nanoplatelets Market Dynamics by Region 2.2.1. North America 2.2.1.1. North America Graphene Nanoplatelets Market Drivers 2.2.1.2. North America Graphene Nanoplatelets Market Restraints 2.2.1.3. North America Graphene Nanoplatelets Market Opportunities 2.2.1.4. North America Graphene Nanoplatelets Market Challenges 2.2.2. Europe 2.2.2.1. Europe Graphene Nanoplatelets Market Drivers 2.2.2.2. Europe Graphene Nanoplatelets Market Restraints 2.2.2.3. Europe Graphene Nanoplatelets Market Opportunities 2.2.2.4. Europe Graphene Nanoplatelets Market Challenges 2.2.3. Asia Pacific 2.2.3.1. Asia Pacific Graphene Nanoplatelets Market Drivers 2.2.3.2. Asia Pacific Graphene Nanoplatelets Market Restraints 2.2.3.3. Asia Pacific Graphene Nanoplatelets Market Opportunities 2.2.3.4. Asia Pacific Graphene Nanoplatelets Market Challenges 2.2.4. Middle East and Africa 2.2.4.1. Middle East and Africa Graphene Nanoplatelets Market Drivers 2.2.4.2. Middle East and Africa Graphene Nanoplatelets Market Restraints 2.2.4.3. Middle East and Africa Graphene Nanoplatelets Market Opportunities 2.2.4.4. Middle East and Africa Graphene Nanoplatelets Market Challenges 2.2.5. South America 2.2.5.1. South America Graphene Nanoplatelets Market Drivers 2.2.5.2. South America Graphene Nanoplatelets Market Restraints 2.2.5.3. South America Graphene Nanoplatelets Market Opportunities 2.2.5.4. South America Graphene Nanoplatelets Market Challenges 2.3. PORTER’s Five Forces Analysis 2.4. PESTLE Analysis 2.5. Technology Roadmap 2.6. Regulatory Landscape by Region 2.6.1. North America 2.6.2. Europe 2.6.3. Asia Pacific 2.6.4. Middle East and Africa 2.6.5. South America 2.7. Key Opinion Leader Analysis For Graphene Nanoplatelets Industry 2.8. Analysis of Government Schemes and Initiatives For Graphene Nanoplatelets Industry 2.9. Graphene Nanoplatelets Market Trade Analysis 2.10. The Global Pandemic Impact on Graphene Nanoplatelets Market 3. Graphene Nanoplatelets Market: Global Market Size and Forecast by Segmentation by Demand and Supply Side (by Value in USD Million) 2023-2030 3.1. Graphene Nanoplatelets Market Size and Forecast, by Purity Level (2023-2030) 3.1.1. High Purity 3.1.2. Medium Purity 3.1.3. Low Purity 3.2. Graphene Nanoplatelets Market Size and Forecast, by Application (2023-2030) 3.2.1. Composites 3.2.2. Energy Storage 3.2.3. Conductive Inks 3.2.4. Coatings 3.2.5. Others 3.3. Graphene Nanoplatelets Market Size and Forecast, by End Use Industry (2023-2030) 3.3.1. Automotive 3.3.2. Electronics 3.3.3. Aerospace 3.3.4. Energy 3.3.5. Construction 3.3.6. Healthcare 3.4. Graphene Nanoplatelets Market Size and Forecast, by Region (2023-2030) 3.4.1. North America 3.4.2. Europe 3.4.3. Asia Pacific 3.4.4. Middle East and Africa 3.4.5. South America 4. North America Graphene Nanoplatelets Market Size and Forecast by Segmentation (by Value in USD Million) 2023-2030 4.1. North America Graphene Nanoplatelets Market Size and Forecast, by Purity Level (2023-2030) 4.1.1. High Purity 4.1.2. Medium Purity 4.1.3. Low Purity 4.2. North America Graphene Nanoplatelets Market Size and Forecast, by Application (2023-2030) 4.2.1. Composites 4.2.2. Energy Storage 4.2.3. Conductive Inks 4.2.4. Coatings 4.2.5. Others 4.3. North America Graphene Nanoplatelets Market Size and Forecast, by End Use Industry (2023-2030) 4.3.1. Automotive 4.3.2. Electronics 4.3.3. Aerospace 4.3.4. Energy 4.3.5. Construction 4.3.6. Healthcare 4.4. North America Graphene Nanoplatelets Market Size and Forecast, by Country (2023-2030) 4.4.1. United States 4.4.1.1. United States Graphene Nanoplatelets Market Size and Forecast, by Purity Level (2023-2030) 4.4.1.1.1. High Purity 4.4.1.1.2. Medium Purity 4.4.1.1.3. Low Purity 4.4.1.2. United States Graphene Nanoplatelets Market Size and Forecast, by Application (2023-2030) 4.4.1.2.1. Composites 4.4.1.2.2. Energy Storage 4.4.1.2.3. Conductive Inks 4.4.1.2.4. Coatings 4.4.1.2.5. Others 4.4.1.3. United States Graphene Nanoplatelets Market Size and Forecast, by End Use Industry (2023-2030) 4.4.1.3.1. Automotive 4.4.1.3.2. Electronics 4.4.1.3.3. Aerospace 4.4.1.3.4. Energy 4.4.1.3.5. Construction 4.4.1.3.6. Healthcare 4.4.2. Canada 4.4.2.1. Canada Graphene Nanoplatelets Market Size and Forecast, by Purity Level (2023-2030) 4.4.2.1.1. High Purity 4.4.2.1.2. Medium Purity 4.4.2.1.3. Low Purity 4.4.2.2. Canada Graphene Nanoplatelets Market Size and Forecast, by Application (2023-2030) 4.4.2.2.1. Composites 4.4.2.2.2. Energy Storage 4.4.2.2.3. Conductive Inks 4.4.2.2.4. Coatings 4.4.2.2.5. Others 4.4.2.3. Canada Graphene Nanoplatelets Market Size and Forecast, by End Use Industry (2023-2030) 4.4.2.3.1. Automotive 4.4.2.3.2. Electronics 4.4.2.3.3. Aerospace 4.4.2.3.4. Energy 4.4.2.3.5. Construction 4.4.2.3.6. Healthcare 4.4.3. Mexico 4.4.3.1. Mexico Graphene Nanoplatelets Market Size and Forecast, by Purity Level (2023-2030) 4.4.3.1.1. High Purity 4.4.3.1.2. Medium Purity 4.4.3.1.3. Low Purity 4.4.3.2. Mexico Graphene Nanoplatelets Market Size and Forecast, by Application (2023-2030) 4.4.3.2.1. Composites 4.4.3.2.2. Energy Storage 4.4.3.2.3. Conductive Inks 4.4.3.2.4. Coatings 4.4.3.2.5. Others 4.4.3.3. Mexico Graphene Nanoplatelets Market Size and Forecast, by End Use Industry (2023-2030) 4.4.3.3.1. Automotive 4.4.3.3.2. Electronics 4.4.3.3.3. Aerospace 4.4.3.3.4. Energy 4.4.3.3.5. Construction 4.4.3.3.6. Healthcare 5. Europe Graphene Nanoplatelets Market Size and Forecast by Segmentation (by Value in USD Million) 2023-2030 5.1. Europe Graphene Nanoplatelets Market Size and Forecast, by Purity Level (2023-2030) 5.2. Europe Graphene Nanoplatelets Market Size and Forecast, by Application (2023-2030) 5.3. Europe Graphene Nanoplatelets Market Size and Forecast, by End Use Industry (2023-2030) 5.4. Europe Graphene Nanoplatelets Market Size and Forecast, by Country (2023-2030) 5.4.1. United Kingdom 5.4.1.1. United Kingdom Graphene Nanoplatelets Market Size and Forecast, by Purity Level (2023-2030) 5.4.1.2. United Kingdom Graphene Nanoplatelets Market Size and Forecast, by Application (2023-2030) 5.4.1.3. United Kingdom Graphene Nanoplatelets Market Size and Forecast, by End Use Industry (2023-2030) 5.4.2. France 5.4.2.1. France Graphene Nanoplatelets Market Size and Forecast, by Purity Level (2023-2030) 5.4.2.2. France Graphene Nanoplatelets Market Size and Forecast, by Application (2023-2030) 5.4.2.3. France Graphene Nanoplatelets Market Size and Forecast, by End Use Industry (2023-2030) 5.4.3. Germany 5.4.3.1. Germany Graphene Nanoplatelets Market Size and Forecast, by Purity Level (2023-2030) 5.4.3.2. Germany Graphene Nanoplatelets Market Size and Forecast, by Application (2023-2030) 5.4.3.3. Germany Graphene Nanoplatelets Market Size and Forecast, by End Use Industry (2023-2030) 5.4.4. Italy 5.4.4.1. Italy Graphene Nanoplatelets Market Size and Forecast, by Purity Level (2023-2030) 5.4.4.2. Italy Graphene Nanoplatelets Market Size and Forecast, by Application (2023-2030) 5.4.4.3. Italy Graphene Nanoplatelets Market Size and Forecast, by End Use Industry (2023-2030) 5.4.5. Spain 5.4.5.1. Spain Graphene Nanoplatelets Market Size and Forecast, by Purity Level (2023-2030) 5.4.5.2. Spain Graphene Nanoplatelets Market Size and Forecast, by Application (2023-2030) 5.4.5.3. Spain Graphene Nanoplatelets Market Size and Forecast, by End Use Industry (2023-2030) 5.4.6. Sweden 5.4.6.1. Sweden Graphene Nanoplatelets Market Size and Forecast, by Purity Level (2023-2030) 5.4.6.2. Sweden Graphene Nanoplatelets Market Size and Forecast, by Application (2023-2030) 5.4.6.3. Sweden Graphene Nanoplatelets Market Size and Forecast, by End Use Industry (2023-2030) 5.4.7. Austria 5.4.7.1. Austria Graphene Nanoplatelets Market Size and Forecast, by Purity Level (2023-2030) 5.4.7.2. Austria Graphene Nanoplatelets Market Size and Forecast, by Application (2023-2030) 5.4.7.3. Austria Graphene Nanoplatelets Market Size and Forecast, by End Use Industry (2023-2030) 5.4.8. Rest of Europe 5.4.8.1. Rest of Europe Graphene Nanoplatelets Market Size and Forecast, by Purity Level (2023-2030) 5.4.8.2. Rest of Europe Graphene Nanoplatelets Market Size and Forecast, by Application (2023-2030) 5.4.8.3. Rest of Europe Graphene Nanoplatelets Market Size and Forecast, by End Use Industry (2023-2030) 6. Asia Pacific Graphene Nanoplatelets Market Size and Forecast by Segmentation (by Value in USD Million) 2023-2030 6.1. Asia Pacific Graphene Nanoplatelets Market Size and Forecast, by Purity Level (2023-2030) 6.2. Asia Pacific Graphene Nanoplatelets Market Size and Forecast, by Application (2023-2030) 6.3. Asia Pacific Graphene Nanoplatelets Market Size and Forecast, by End Use Industry (2023-2030) 6.4. Asia Pacific Graphene Nanoplatelets Market Size and Forecast, by Country (2023-2030) 6.4.1. China 6.4.1.1. China Graphene Nanoplatelets Market Size and Forecast, by Purity Level (2023-2030) 6.4.1.2. China Graphene Nanoplatelets Market Size and Forecast, by Application (2023-2030) 6.4.1.3. China Graphene Nanoplatelets Market Size and Forecast, by End Use Industry (2023-2030) 6.4.2. S Korea 6.4.2.1. S Korea Graphene Nanoplatelets Market Size and Forecast, by Purity Level (2023-2030) 6.4.2.2. S Korea Graphene Nanoplatelets Market Size and Forecast, by Application (2023-2030) 6.4.2.3. S Korea Graphene Nanoplatelets Market Size and Forecast, by End Use Industry (2023-2030) 6.4.3. Japan 6.4.3.1. Japan Graphene Nanoplatelets Market Size and Forecast, by Purity Level (2023-2030) 6.4.3.2. Japan Graphene Nanoplatelets Market Size and Forecast, by Application (2023-2030) 6.4.3.3. Japan Graphene Nanoplatelets Market Size and Forecast, by End Use Industry (2023-2030) 6.4.4. India 6.4.4.1. India Graphene Nanoplatelets Market Size and Forecast, by Purity Level (2023-2030) 6.4.4.2. India Graphene Nanoplatelets Market Size and Forecast, by Application (2023-2030) 6.4.4.3. India Graphene Nanoplatelets Market Size and Forecast, by End Use Industry (2023-2030) 6.4.5. Australia 6.4.5.1. Australia Graphene Nanoplatelets Market Size and Forecast, by Purity Level (2023-2030) 6.4.5.2. Australia Graphene Nanoplatelets Market Size and Forecast, by Application (2023-2030) 6.4.5.3. Australia Graphene Nanoplatelets Market Size and Forecast, by End Use Industry (2023-2030) 6.4.6. Indonesia 6.4.6.1. Indonesia Graphene Nanoplatelets Market Size and Forecast, by Purity Level (2023-2030) 6.4.6.2. Indonesia Graphene Nanoplatelets Market Size and Forecast, by Application (2023-2030) 6.4.6.3. Indonesia Graphene Nanoplatelets Market Size and Forecast, by End Use Industry (2023-2030) 6.4.7. Malaysia 6.4.7.1. Malaysia Graphene Nanoplatelets Market Size and Forecast, by Purity Level (2023-2030) 6.4.7.2. Malaysia Graphene Nanoplatelets Market Size and Forecast, by Application (2023-2030) 6.4.7.3. Malaysia Graphene Nanoplatelets Market Size and Forecast, by End Use Industry (2023-2030) 6.4.8. Vietnam 6.4.8.1. Vietnam Graphene Nanoplatelets Market Size and Forecast, by Purity Level (2023-2030) 6.4.8.2. Vietnam Graphene Nanoplatelets Market Size and Forecast, by Application (2023-2030) 6.4.8.3. Vietnam Graphene Nanoplatelets Market Size and Forecast, by End Use Industry (2023-2030) 6.4.9. Taiwan 6.4.9.1. Taiwan Graphene Nanoplatelets Market Size and Forecast, by Purity Level (2023-2030) 6.4.9.2. Taiwan Graphene Nanoplatelets Market Size and Forecast, by Application (2023-2030) 6.4.9.3. Taiwan Graphene Nanoplatelets Market Size and Forecast, by End Use Industry (2023-2030) 6.4.10. Rest of Asia Pacific 6.4.10.1. Rest of Asia Pacific Graphene Nanoplatelets Market Size and Forecast, by Purity Level (2023-2030) 6.4.10.2. Rest of Asia Pacific Graphene Nanoplatelets Market Size and Forecast, by Application (2023-2030) 6.4.10.3. Rest of Asia Pacific Graphene Nanoplatelets Market Size and Forecast, by End Use Industry (2023-2030) 7. Middle East and Africa Graphene Nanoplatelets Market Size and Forecast by Segmentation (by Value in USD Million) 2023-2030 7.1. Middle East and Africa Graphene Nanoplatelets Market Size and Forecast, by Purity Level (2023-2030) 7.2. Middle East and Africa Graphene Nanoplatelets Market Size and Forecast, by Application (2023-2030) 7.3. Middle East and Africa Graphene Nanoplatelets Market Size and Forecast, by End Use Industry (2023-2030) 7.4. Middle East and Africa Graphene Nanoplatelets Market Size and Forecast, by Country (2023-2030) 7.4.1. South Africa 7.4.1.1. South Africa Graphene Nanoplatelets Market Size and Forecast, by Purity Level (2023-2030) 7.4.1.2. South Africa Graphene Nanoplatelets Market Size and Forecast, by Application (2023-2030) 7.4.1.3. South Africa Graphene Nanoplatelets Market Size and Forecast, by End Use Industry (2023-2030) 7.4.2. GCC 7.4.2.1. GCC Graphene Nanoplatelets Market Size and Forecast, by Purity Level (2023-2030) 7.4.2.2. GCC Graphene Nanoplatelets Market Size and Forecast, by Application (2023-2030) 7.4.2.3. GCC Graphene Nanoplatelets Market Size and Forecast, by End Use Industry (2023-2030) 7.4.3. Nigeria 7.4.3.1. Nigeria Graphene Nanoplatelets Market Size and Forecast, by Purity Level (2023-2030) 7.4.3.2. Nigeria Graphene Nanoplatelets Market Size and Forecast, by Application (2023-2030) 7.4.3.3. Nigeria Graphene Nanoplatelets Market Size and Forecast, by End Use Industry (2023-2030) 7.4.4. Rest of ME&A 7.4.4.1. Rest of ME&A Graphene Nanoplatelets Market Size and Forecast, by Purity Level (2023-2030) 7.4.4.2. Rest of ME&A Graphene Nanoplatelets Market Size and Forecast, by Application (2023-2030) 7.4.4.3. Rest of ME&A Graphene Nanoplatelets Market Size and Forecast, by End Use Industry (2023-2030) 8. South America Graphene Nanoplatelets Market Size and Forecast by Segmentation (by Value in USD Million) 2023-2030 8.1. South America Graphene Nanoplatelets Market Size and Forecast, by Purity Level (2023-2030) 8.2. South America Graphene Nanoplatelets Market Size and Forecast, by Application (2023-2030) 8.3. South America Graphene Nanoplatelets Market Size and Forecast, by End Use Industry(2023-2030) 8.4. South America Graphene Nanoplatelets Market Size and Forecast, by Country (2023-2030) 8.4.1. Brazil 8.4.1.1. Brazil Graphene Nanoplatelets Market Size and Forecast, by Purity Level (2023-2030) 8.4.1.2. Brazil Graphene Nanoplatelets Market Size and Forecast, by Application (2023-2030) 8.4.1.3. Brazil Graphene Nanoplatelets Market Size and Forecast, by End Use Industry (2023-2030) 8.4.2. Argentina 8.4.2.1. Argentina Graphene Nanoplatelets Market Size and Forecast, by Purity Level (2023-2030) 8.4.2.2. Argentina Graphene Nanoplatelets Market Size and Forecast, by Application (2023-2030) 8.4.2.3. Argentina Graphene Nanoplatelets Market Size and Forecast, by End Use Industry (2023-2030) 8.4.3. Rest Of South America 8.4.3.1. Rest Of South America Graphene Nanoplatelets Market Size and Forecast, by Purity Level (2023-2030) 8.4.3.2. Rest Of South America Graphene Nanoplatelets Market Size and Forecast, by Application (2023-2030) 8.4.3.3. Rest Of South America Graphene Nanoplatelets Market Size and Forecast, by End Use Industry (2023-2030) 9. Global Graphene Nanoplatelets Market: Competitive Landscape 9.1. MMR Competition Matrix 9.2. Competitive Landscape 9.3. Key Players Benchmarking 9.3.1. Company Name 9.3.2. Business Segment 9.3.3. End-user Segment 9.3.4. Revenue (2022) 9.3.5. Company Locations 9.4. Leading Graphene Nanoplatelets Market Companies, by market capitalization 9.5. Market Structure 9.5.1. Market Leaders 9.5.2. Market Followers 9.5.3. Emerging Players 9.6. Mergers and Acquisitions Details 10. Company Profile: Key Players 10.1. Haydale Graphene Industries plc - United Kingdom 10.1.1. Company Overview 10.1.2. Business Portfolio 10.1.3. Financial Overview 10.1.4. SWOT Analysis 10.1.5. Strategic Analysis 10.1.6. Scale of Operation (small, medium, and large) 10.1.7. Details on Partnership 10.1.8. Regulatory Accreditations and Certifications Received by Them 10.1.9. Awards Received by the Firm 10.1.10. Recent Developments 10.2. Graphenea - Spain 10.3. XG Sciences - United States 10.4. Angstron Materials - United States 10.5. NanoXplore - Canada 10.6. Applied Graphene Materials - United Kingdom 10.7. Grafoid Inc. - Canada 10.8. ACS Material - United States 10.9. Thomas Swan & Co. Ltd. - United Kingdom 10.10. Talga Resources - Australia 10.11. Nanocyl - Belgium 10.12. Saint Jean Carbon - Canada 10.13. Versarien - United Kingdom 10.14. G6 Materials - United States 10.15. Graphmatech - Sweden 11. Key Findings 12. Industry Recommendations 13. Graphene Nanoplatelets Market: Research Methodology 14. Terms and Glossary
  • INQUIRE BEFORE BUYING