
Energy Efficient Lighting Market – Global Market Size, Strategic Growth Drivers, Risk Assessment Framework, Regulatory Landscape Review, Competitive Intensity Mapping & Long-Term Industry Outlook to 2034
Overview
Energy Efficient Lighting Market was valued at US$ 63.07 Bn. in 2025 and the total Energy Efficient Lighting revenue is expected to grow at 8.1% from 2026 to 2034, reaching nearly US$ 127.14 Bn.
Energy Efficient Lighting Market Overview:
Fluorescent lights are widely used in the limited-space applications as of their small size. The market for energy-efficient lighting as a whole is being reshaped by the rising use of plasma lights in horticulture. Energy-efficient lighting offers long life and great efficiency, which further guarantees market growth during the forecast period. The market for energy-efficient warehouse lighting, however, is probably going to experience a modest slowdown in growth. High costs & limited efficiency for applications that require heat sensitivity may impede the market's future growth. Future market growth is expected to be hampered by the lack of standards & the rising expense of testing.
Energy Efficient Lighting Market Growth and Share Analysis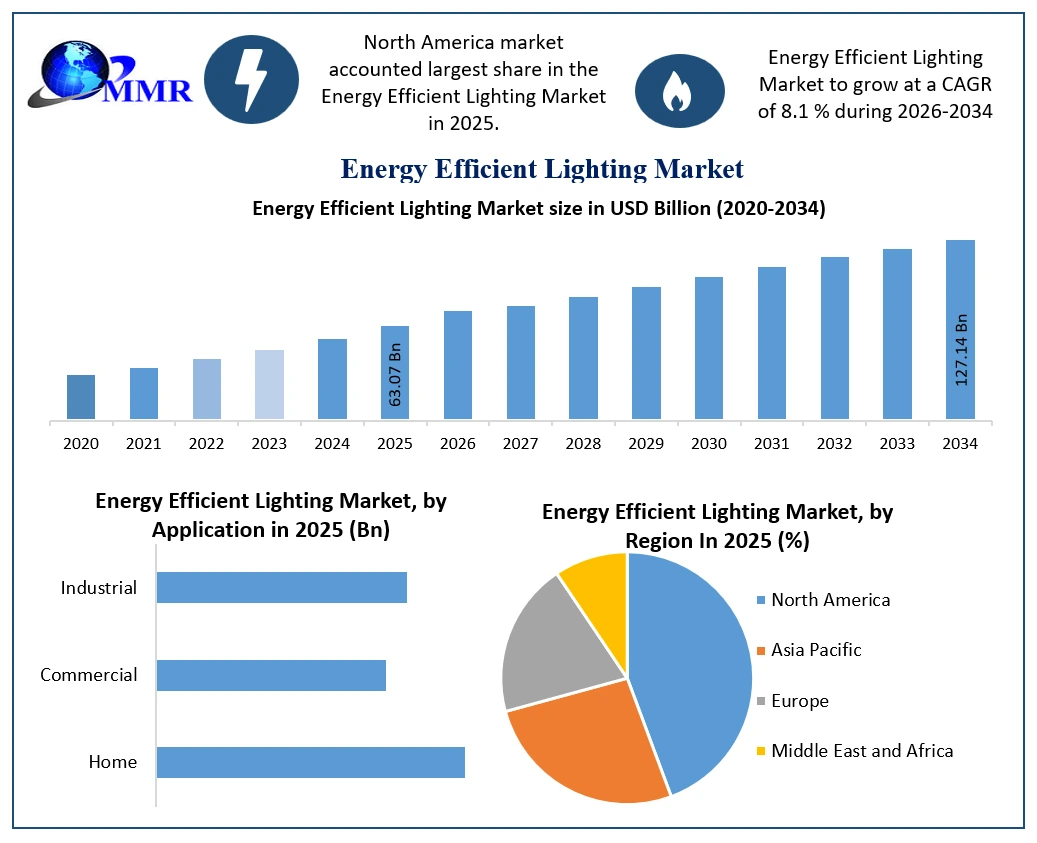
To know about the Research Methodology:-Request Free Sample Report
Energy Efficient Lighting Market Report Scope:
The Energy Efficient Lighting market is segmented based on Lighting Source and Region. The growth of various segments helps report users in acquiring knowledge of the many growth factors expected to be prevalent throughout the market and develop different strategies to help identify core application areas and the gap in the target market. The report provides an in-depth analysis of the market and contains meaningful insights, facts, historical data, and statistically supported and industry-validated market statistics. It also includes estimates based on an appropriate set of assumptions and methodologies.
A bottom-up approach has been used to estimate the market size. Key Players in the Energy Efficient Lighting market are identified through secondary research and their market revenues are determined through primary and secondary research. Secondary research included a review of annual and financial reports of leading manufacturers, while primary research included interviews with important opinion leaders and industry experts such as skilled front-line personnel, entrepreneurs, and marketing professionals. Some of the leading key players in the global Energy Efficient Lighting market include Dialight, LIGMAN Lighting Co., Ltd, Philips Lighting Holding B.V., ABB, Eaton.The report is not only a representation of global players but also covers the market holding of local players in each country.
Market structure by country with market holding by market leaders, market followers, and local players make this report a comprehensive and insightful industry outlook. The report has covered the mergers and acquisitions, strategic alliances, joint ventures, and partnerships happening in the market by region, by investment, and their strategic intent.Energy Efficient Lighting Market Dynamics:
After a decline in business activity in the year 2020, the energy used for lighting & the resulting emissions both increased in the year 2021. Despite the fact that the amount of lighting utilised in buildings is increasing, with increased efficiency, lighting consumption is still expected to decline. Both the use of light-emitting diodes (LEDs) & improvements in lighting efficiency were made in 2021. While many countries started phasing out incandescent bulbs more than 10 years ago, several are currently starting to do the same with fluorescent lighting so that LEDs will become the dominant lighting technology. LED technology is used in more than 50% of the worldwide lighting market.
Although some developed markets have passed new laws requiring the sole sale of high-efficacy (LED) lamps, progress in this area must be maintained to guarantee that all countries sell primarily LED technology by 2026 & with increasing efficiency to 2034, in order to align with the Net Zero Emissions by 2050 Scenario.
In 2021, CO2 emissions increased again due to higher electricity use, Lighting-related emissions marginally increased in the year 2021, although they are still lower than in 2019 & continuing to decline overall, thanks in part to improvements in the carbon intensity of energy. Continued use of LED technology and reductions in the carbon intensity of electricity are necessary to go toward the Net Zero Scenario. Achieving this goal will depend on prioritizing the adoption and use of LED lighting technology with higher energy efficiency and continuing the decarbonisation of electricity production.
Growing building space & population is boosting additional demand for lighting
With growing wealth, & the falling cost of lighting products, householders are able to afford more lighting facilities particularly in developing economies. This rise in demand for lighting facilities is also being driven by the growing population & number of households. Lighting facilities in the commercial segment are being driven by bigger spaces that need to be lit. These increasing activity pressures are boosting the service demand for lighting, highlighting the significance of deploying LED lamps in all marketplaces to limit total energy consumptions lighting.
LEDs are now the top lighting technology
Globally, sales of LED have improved significantly in recent years, increasing from a market share of about 5 percent in the year 2013 to more than half of global lighting sales in the year 2021. The rapidly growing luminaire market sector is largely due to developed markets like the US & Europe, while China has built up a sizable domestic and global manufacturing base.
The effectiveness of new LEDs continues to rise, although it needs reach 140 lm/W by the end of 2030 to align with the Net Zero Scenario.
LED efficiency has enhanced considerably in recent years, despite some emblems of slowdown in the past few years. Depending on the model LEDs commonly sold in the home market have an efficacy of over 100 lumens per watt (lm/W). Since 2010, the average LED effectiveness has increased by 6 to 8 lm/W annually. The greatest technologies currently available can produce more than 200 lm/W, but they are currently far more expensive.
LEDs have surpassed all other commercially viable alternatives in efficiency. Advanced LED modules (such as those made out of multiple-chip packages on a printed circuit board), for example, or ongoing advancements in optics, could be used to make further advancements. Grids that use direct current (DC) have the potential to lessen conversion losses from alternating current (AC) to DC (as LEDs are DC systems).
Based on source, the light emitting diodes (LED) segment hold for the maximum market share in the year 2024, contributing to more than two-fifths of the total energy efficient lighting market & is expected to keep its lead position during the forecast period. Moreover, this segment is expected to see the largest CAGR of x% from 2026 to 2034. This is attributed to cost reductions in LED lights, rise in use in display back lighting & outstanding efficacy of LED lamps.
Energy Efficient Lighting Market Recent Development:
| Date | Company | Development | Impact |
|---|---|---|---|
| 01 January 2025 | Acuity Brands, Inc. | Completed the acquisition of QSC, LLC for a net purchase price of $1.1 billion to integrate cloud-manageable audio, video, and control solutions into its Intelligent Spaces Group. | The strategic acquisition accelerates data interoperability and enhances smart building capabilities, delivering energy-efficient, interconnected space management solutions for commercial customers. |
| 30 March 2025 | AMS OSRAM | Launched the OSRAM Night Breaker H1-LED retrofit lamp, enabling direct upgrades from traditional halogen lights to advanced LED technology. | The product line rollout accelerates the phase-out of legacy lighting in automotive applications by delivering higher luminous efficacy and lower power consumption. |
| 27 March 2025 | Signify N.V. | Entered a 50:50 joint venture agreement with Dixon Technologies to establish advanced LED lighting manufacturing facilities in India. | The partnership scales domestic production of energy-efficient LED bulbs, downlights, and smart lighting accessories to meet surging regional demand while driving cost competitiveness. |
| 04 August 2025 | Dialight plc | Inaugurated a new consolidated manufacturing facility in Penang, Malaysia, unifying Solid State Lighting and Optoelectronics production lines. | The plant expansion streamlines operational efficiency, reducing the manufacturing carbon footprint while scaling supply of high-efficiency industrial LED luminaires across the Asia-Pacific region. |
Energy Efficient Lighting Market Regional Insights:
In the year 2025, North America accounted for more than one-third of the global market for energy-efficient lighting, contributing the largest revenue share. This is a result of the development of intelligent, energy-efficient lighting solutions like halogen lights & the presence of significant electrical enterprises in the area. However, due to the presence of major manufacturers, strict energy efficiency regulations, & considerable power consumption in industrial and residential applications, Europe is predicted to exhibit the biggest CAGR of xx% during the forecast period.
Asia Pacific region emerged as the second leading region of Energy Efficient Lighting Market in the year 2025, with a share of xx% in terms of revenue. Japan, China, & South Korea are key contributors for the growth of regional market because of major investments in the modern lighting technologies. Rapid industrial growth has also added to the increasing demand for energy efficient warehouse lighting. The increasing demand for green technologies is expected to boost the energy efficient lighting market in APAC region during the forecast period.
A key strategy Implemented by market players and countries
Global demand for energy continues to rise despite the high level of energy productivity that many countries have already achieved. Globally, industry, transportation, and homes utilize around 12 billion toes per year. Consumption is to reach a billion toes every year. In 2024, equating to a 2% yearly growth rate. The majority of this growth is attributable to the world's growing population and the rapid industrialization of the main emerging economies.
China, India, and Russia account for 55 percent of 2020. However, per capita, energy consumption in such countries will remain significantly lower than in industrialized countries. the In 2020, per capita consumption in the United States by 7.2 toe per year, compared to 3.5 toe in Europe, 2.3 toe in China, and 0.6 toe in India. In the coming decades, fossil fuels will remain critical to supplying global energy needs. In 2020, oil, coal, and gas reached almost 80% of global energy demand. Even by 2034, this percentage is unlikely to fall below 70%.2 However, pressure is rising on industry, government, and society - especially in the USA.
Thanks to these companies are started implementing a new strategy to make it competitive, advanced lighting controls and building management systems (BMS) can help a building's overall energy efficiency. The levels of maturity and integration with other building elements of these two systems can vary. For example, there are often three levels of lighting controls, which implement and drive the energy efficiency market growth.
Specific devices that manage individual lighting loads in a small space, such as an occupancy sensor on an overhead lamp in a small office.
Digital room control.
Building controls that are networked: a network of devices that connect to a larger control system, are programmable, and can be handled remotely.
Buildings can use one or more of these control techniques, depending on their needs.
Utility solutions such as demand response, which uses a signal from the energy supplier to automatically cut lighting and HVAC power use at peak times, can complement the overall efficiency required by the code and lower total consumption in a building.
However, if these systems cannot be measured, facility managers will be unable to identify and regulate utilization. Lighting loads can add to a building's cooling requirements. The key here is to have a BMS in place to monitor energy use in lights and other systems, which will assist in identifying areas of high energy demand and waste. And charges, which can account for 30-50% of a building's energy expenditure.
Energy Efficient Lighting Market Scope: Inquire before buying
| Global Energy Efficient Lighting Market | |||
|---|---|---|---|
| Report Coverage | Details | ||
| Base Year: | 2025 | Forecast Period: | 2026-2034 |
| Historical Data: | 2020 to 2025 | Market Size in 2025: | US $ 63.07 Bn. |
| Forecast Period 2026 to 2034 CAGR: | 8.1% | Market Size in 2034: | US $ 127.14 Bn. |
| Segments Covered: | by Lighting Source | High-intensity Discharge Lamps (HID) Linear Fluorescent Lamps (LFL) Light Emitting Diodes (LED) Others |
|
| by Application | Home Commercial Industrial |
||
Energy Efficient Lighting Market, by Region
North America (United States, Canada and Mexico)
Europe (UK, France, Germany, Italy, Spain, Sweden, Austria and Rest of Europe)
Asia Pacific (China, South Korea, Japan, India, Australia, Indonesia, Malaysia, Vietnam, Taiwan, Bangladesh, Pakistan and Rest of APAC)
Middle East and Africa (South Africa, GCC, Egypt, Nigeria and Rest of ME&A)
South America (Brazil, Argentina Rest of South America)
Key Players
1. Dialight
2. LIGMAN Lighting Co., Ltd.
3. Philips Lighting Holding B.V.
4. Digital Lumens, Inc.
5. OSRAM GmbH
6. Eaton
7. General Electric Company
8. Toshiba Lighting & Technology Corporation
9. Bajaj Electricals Ltd.
10.Acuity Brands
11.Cooper Lighting
12.The Lighting Quotient
13.ABB
14.Eaton
15.Advanced Lighting Technologies Australia Inc.
16.Schneider Electric
17.Bridgelux.
FAQs:
1. Which region has the largest share in Global Energy Efficient Lighting Market?
Ans: North American region holds the highest share in 2025.
2. What is the growth rate of Global Energy Efficient Lighting Market?
Ans. The Global Energy Efficient Lighting Market is growing at a CAGR of 8.1% during forecasting period 2026-2034.
3. What is scope of the Global Energy Efficient Lighting market report?
Ans. Global Energy Efficient Lighting Market report helps with the PESTEL, PORTER, COVID-19 Impact analysis, Recommendations for Investors & Leaders, and market estimation of the forecast period
4. What is the projected market size & growth rate of the Energy Efficient Lighting Market?
Ans. Energy Efficient Lighting Market size was valued at US$ 63.07 Billion in 2025 and the total Energy Efficient Lighting revenue is expected to grow at 8.1% through 2026 to 2034, reaching nearly US$ 127.14 Billion.
5. What segments are covered in the Energy Efficient Lighting Market report?
Ans. The segments covered are Lighting Source and Region.