Electronic Design Automation (EDA) Market: Global Industry Analysis and Forecast (2025-2032)

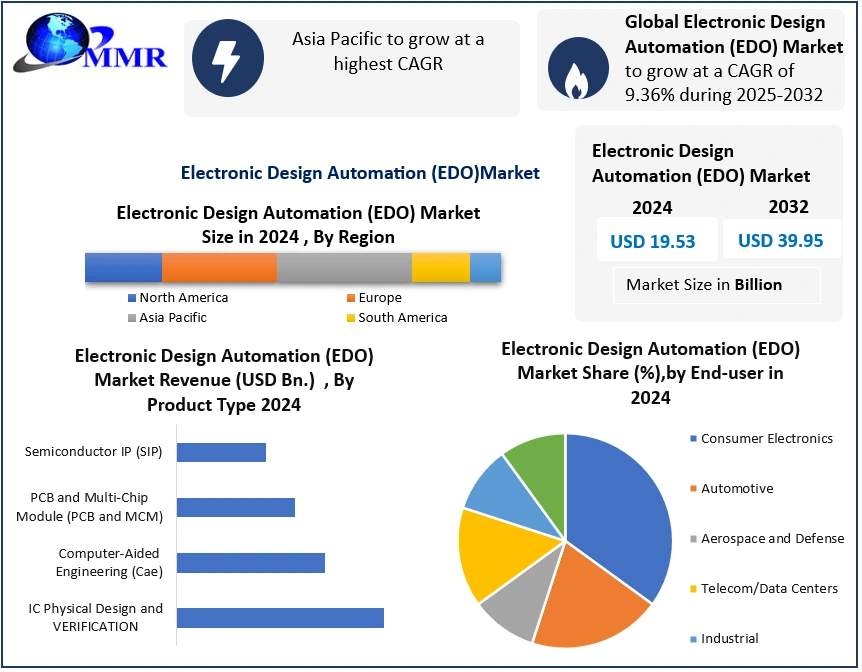
The global Electronic Design Automation (EDA) Market size was valued at 19.53 billion in 2024, and the total Electronic Design Automation (EDA) Market revenue is expected to grow by 9.36% from 2025 to 2032, reaching nearly USD 39.95 billion.

Electronic Design Automation (EDA) Market Overview

Electronic Design Automation, or EDA refers to the application of software tools for the design, verification, simulation and testing of electronic components and systems., This covers Integrated Circuits (ICs), System-on-Chips (SoCs) and printed circuit boards., The EDA market is booming as chip designs get more complex due to customer demand for custom SoC designs and STEM resulting in new technologies of AI, 5G, IoT, and autonomous vehicles being added to the traditional electronics market., New demands for miniaturization, performance and reduced time to develop, means authors must rely on EDA tools., Most of the EDA innovation is in three forms: design automation, power optimization and success of first pass silicon., In addition, EDA products that leverage machine learning models and cloud based processes improve productivity and the efficiency of the design. Electronic Design Automation (EDO)Market 2025-2032To know about the Research Methodology:-Request Free Sample Report The focus of innovation is to maximize design automation, minimize power, maximize performance, and achieve silicon success on the first pass. Certain applications, such as RTL simulation, static timing analysis, analog/mixed-signal verification, hardware description languages (HDLs), and design-for-test automation, have matured to the point where they are ubiquitous in modern chip design. In the past decade, the convergence of machine learning (ML) and the proliferation of cloud-based design environments have improved productivity and enhanced accuracy to design efforts. Advanced packaging, 3D ICs, and heterogeneous integration are adding more stimuli for sophistication in electronic design automation. North America has the largest part of the marketplace because it houses most of the top semiconductor companies and EDA companies, makes large investments in research and development, and has a solid, growing fabless ecosystem. The Asia-Pacific region is the fastest-growing segment of the marketplace, driven by the rapid expansion of electronics manufacturing in Taiwan, South Korea, China, and India. With government-backed incentives, rising consumer electronics, and all of the initiatives to establish local chip design ecosystems in place for both Taiwan and South Korea will help drive regional growth. The leading EDA players are Synopsys, Cadence Design Systems, Siemens EDA (previously known as Mentor Graphics), Ansys, and Keysight Technologies. These companies compete through technology leadership and acquisitions, and deep integration with technology-industrial research and development held at semiconductor companies.

Electronic Design Automation (EDA) Market Dynamics

AI, 5G, IoT, and Autonomous Tech to Accelerate Electronic Design Automation Market Growth The growth of the semiconductor industry has a very strong positive influence on the Electronic Design Automation (EDA) market for a variety of related reasons. The semiconductor industry proposes increasingly more complex and efficient integrated circuits (ICs) for automotive, consumer electronics, telecommunications, industrial automation, and other markets. The advancement of ICs increases complexity, thus requiring the utilization of more advanced design tools and methodologies to manage that increased complexity. EDA tools allow for the advancement and innovation of electronic devices, including software platforms for designing, simulating, verifying, and laying out electronic circuits. The semiconductor industry is advancing at a rapid rate by developing new technologies. AI, 5G, IoT, and self-driving cars are driving demand for new types of specific ICs designed specifically for the new technologies. EDA tools allow the semiconductor companies to design and optimize chips for the new technologies. In addition, the semiconductor industry is extremely competitive, and time to market is critical. EDA tools simplify the design process and accelerate development cycles rendering time from design to time to market very short for new semiconductor products. The growth of the semiconductor market provides support for the EDA Market, forming a positive ecosystem of innovation. High Cost of Tools to Limit Electronic Design Automation (EDA) Market Growth The large investment needed for Electronic Design Automation (EDA) tools is a substantial barrier both to joining and growing, and thus influencing uptake and growth of the Electronic Design Automation (EDA) market. For small and medium-sized enterprises (SMEs) and start-ups, it may cost them a lot of money for their initial investment in EDA software licenses and while those decisions ultimately fall in their court, they have limited budgets and would rather look for cost-cutting measures than expensive EDA tooling. Moreover, the costs just continue to cover some ongoing costs: who is responsible for maintaining and updating EDA tools (e.g., renew licenses, support contracts, fees for upgrades and special features, etc.) EDA tools may put a severe financial strain on firms with not much money to start with. Finally, these annual costs pile up into an expense that firms struggle to justifiable if they are not using the tools frequently. The prohibitive costs of EDA tools create inequities in access to technology, such that larger companies can afford them whereas smaller companies cannot. This inequitable access to technology will limit innovation and competition in the market because smaller players cannot efficiently compete. In addition, reluctance to invest in EDA tools leads other companies to utilize outdated or inferior design methodologies which limits their ability to compete, especially in an increasingly competitive economy. Owing to high cost, the EDA market is unable to grow and evolve because of the extent to which expensive EDA tools slow adoption, restrict innovation, and amplify disparities in access to the next generation of design tools and technologies. In this regard, EDA vendors should consider alternative pricing approaches, offer more flexible licensing options, or develop reduced or modified-feature software that fulfill the needs of the smaller organizations that are working with much lower cost approaches. Rising Demand for IoT and AI Chips to create opportunities for the Electronic Design Automation (EDA) Market The ever-increasing demand for Internet of Things (IoT) and Artificial Intelligence (AI) chips, and a thriving Electronic Design Automation (EDA) market will continue to create incredible growth opportunities. It is important to clarify that IoT is not confined to a single industry; we are seeing the proliferation of IoT in all aspects of our everyday lives, from healthcare to automotive vehicles. To support the variety of functions that IoT provides (sensor data processing and connectivity), we have witnessed the demand for chips operate intensively. Similarly, AI holds an essential position, and it is thriving in consumer electronics, autonomous vehicles, and data centres. With the demand for AI chips, whether we are engineers or designers, we have the need for advanced hardware with the right functions for neural network implementations. Furthermore, the increase in complexity and performance of IoT and AI applications, semiconductor companies have embraced the increase with their investment in EDA tools—these tools speed up time to design as well as time to verify chips. Advanced EDA tools help a team of engineers deal with complex designs, reduce power consumption, and ensure reliability for advanced semiconductor designs. In great part, semiconductor companies have shifted focus on energy efficiency and mobility during the design phase; hence, EDA tools are ideal for these companies as they offer a streamlining process for low-power, small IoT and AI chips. The increase in demand for IoT and AI chips represents another important reason for the EDA market growth. It highlights the role of EDA in speeding up innovation and time to market for semiconductor manufacturers, all of which positions EDA companies for desirable growth opportunities in the Electronic Design Automation (EDA) Market. The technology growth in IoT chips and AI demand continue to signify important future growth for the semiconductor industry.

Electronic Design Automation (EDA) Market Segment Analysis:

Based on Deployment Mode, In 2024, the on-premises segment overtook the Electronic Design Automation (EDA) Market. The on-premises segment is the most prominent segment of the Electronic Design Automation (EDA) industry due to its data security, control, and performance capabilities. Semiconductor companies (many of which are also IP companies) tend to want control of their design environments, especially with sensitive IP. The investments companies have made to their on-premises infrastructure have also boosted the segment's success because many companies do not want to deal with migrating anything to a cloud, as that takes a lot of time and effort. Moreover, the on-premises EDA solutions usually offer better performance and responsiveness, which are important for computing-intensive chip design tasks. Industries with stringent regulatory compliance requirements prefer using on-premises solutions to better meet compliance. Many on-premises solutions also allow customization and flexibility that can be tailored by each company to fit their environment and workflow. Even though cloud-based solutions are becoming more accepted, especially for certain use cases, the on-premises segment is the preferred option for semiconductor companies to control their environment, performance, and compliance. Therefore, the on-premises segment dominated the Electronic Design Automation (EDA) Market. Electronic Design Automation (EDO)Market by Deployment Mode 
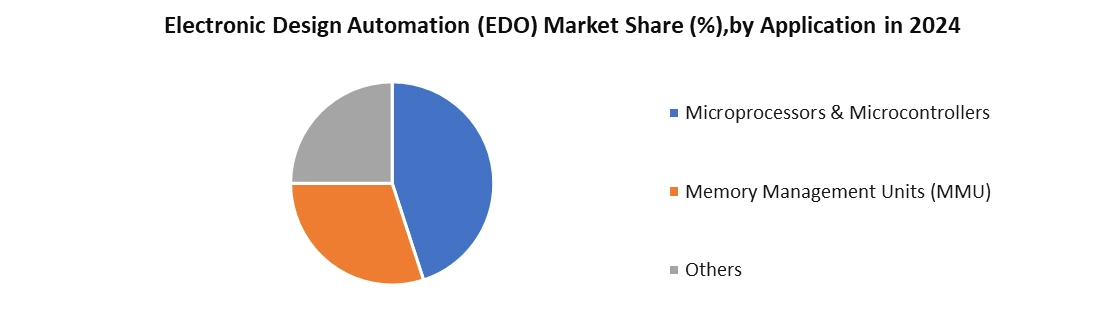
Based on Application, Memory Management Units segment was the largest in the Electronic Design Automation (EDA) Market in 2024. MMUs are critical in the overall design of complex semiconductor chips and play a significant role in memory-connected devices. In an environment where demand for high-performance computing and data-rich applications is accelerating, semiconductor companies are looking for significant memory management, usage optimization, and more overall chip performance for all devices that connect to networks. New technology has created thousands of data-driven devices, AI-related applications, everyday IoT devices, and other technologies that require evolving features, including larger memory capacity and more sophisticated memory management capabilities and solutions. Accordingly, innovation and investment in MMU solutions that support robust demand for semiconductor chips have been skyrocketing. The strong growth in MMU solutions is also being driven by the picture of those controller features becoming standard components of System-on-Chips (SoC) designs -- which are widely used in consumer electronics; smartphones, tablets, and automotive, for instance, as well as in everyday IoT devices, wearables, and a plethora of applications. As SoC devices become more complex, integrating more and more features, implementation of memory management will grow with it. All things affect and depend on one another and that will require full-featured and robust memory management unit (MMU) solutions. Electronic Design Automation (EDO)Market by Application

Electronic Design Automation (EDA) Market Regional Insights

Asia Pacific dominated the Electronic Design Automation (EDA) Market and is expected to dominate during forecast period (2025-2032) With substantial investment into the semiconductor market, along with significant capacity in countries including India and China, where there is significant engineering talent, enables innovation and associated capacity. The Asia Pacific was the primary region in the EDA Market, however, the very significant semiconductor manufacturing locations in Taiwan, South Korea, China, and Japan. Furthermore, the Asia Pacific has active governments at federal, state and local levels, promoting semiconductor manufacturing and design through policies (i.e. tax credits, grants for research) that support the local economy, enabling growth within the EDA market. North America has a well-developed ecosystem for semiconductor design; significant US-based semiconductor design companies and research organizations fundamentally support innovation and the provisioning of EDA tools and technology development.

Electronic Design Automation (EDA) Market Competitive Landscape:

The Electronic Design Automation (EDA) market is a strategic battleground between a triad of incumbents that dominate the complete design flow and a multitude of nimble and innovative firms that are concentrating on disruptive point tools, niche markets, and emerging modalities such as cloud-based and AI-based design. This dichotomy is evident in the competition between Synopsys Inc. and Silvaco, Inc. Synopsys is a mainstay of the EDA industry. From system architecture and functional verification to silicon sign-off, Synopsys provides a comprehensive, integrated suite of tools for the semiconductor design life cycle. An important point of differentiation for Synopsys is its extensive consumer semiconductor IP (SIP) and its heavy investment into AI-based suite tools such as DSO.ai to enable autonomous chip design, tying customers into its full-stack ecosystem. Synopsys closely partners with the leading foundries and semiconductor corporations to deliver tools that are indispensable for designing at the state-of-the-art process nodes, firmly anchoring their superior market share in high-performance computing and automotive, and consumer electronics. In contrast with Silvaco, Inc. is a niche player focused on providing best-in-class point tools for very specific design problems in the analog/mixed-signal, power integrity, and memory design spaces. Silvaco's strength is found in its TCAD (Technology Computer-Aided Design) and SPICE simulation tools, which are flexible, high-performance converters with higher accessibility and visibility option for flow and integration that are generally not as easy to replicate in monolithic suites. The company is also not technology specific (device dependent), and is targeting some pieces of the established tool flow, superior accuracy, functionality, and faster simulation turn people, along with responsive technical support and a total cost of ownership that is lower than the competition, that is attractive for fabless companies, and foundries looking at mature and specialty BN accessible. Electronic Design Automation (EDA) Market Key Developments: • Dec-2024 – Cadence Design Systems – North America Cadence has launched a new set of electronic design automation (EDA) tools that optimize integrated circuit designs for 5G and AI applications. The tools are designed to improve the performance and efficiency of designs to help engineers deal with the growing complexity of designs and help achieve a shorter time to market for next-generation technologies. • Nov-2024 – Synopsys, Inc. – North America Synopsys has launched a new cloud-based EDA platform that enables multiple project participants to simultaneously collaborate in real-time on chip design projects. This platform offers scalable and cost-effective solutions that increase accuracy and lower manual design processes, making it easier for design teams to innovate and for the semiconductor industry to speed up its innovation cycle. • Sep-2024 – Ansys, Inc. – North America Ansys has embarked on a strategic collaboration with one of the world's largest semiconductor companies to co-design a next-generation EDA tool for high-performance computing systems. The collaboration brings together thermal, electrical, and mechanical simulation, integrated into the chip design cycle to maximize device performance and reliability.

Electronic Design Automation (EDA) Market Key Trends:

• Collaboration in the Cloud: Organizations like Synopsys have already started utilizing cloud native EDA platforms to enable immediate collaboration, scaling, or simply improve design productivity to differently located teams of engineers. • Multiphysics integration: Their partners strategies, such as Ansys, demonstrate the growing need for EDA tools that incorporate electrical, thermal, and mechanical simulations in order to improve the reliability and performance of a new semiconductor design.

Scope of the Global Electronic Design Automation (EDA) Market: Inquire before buying

Global Electronic Design Automation (EDA) Market
Report Coverage Details
Base Year: 2024 Forecast Period: 2025-2032
Historical Data: 2019 to 202 Market Size in 2024: USD 19.53 Bn.
Forecast Period 2025 to 2032 CAGR: 9.6% Market Size in 2032: USD 39.95 Bn.
Segments Covered: by Product Category Computer Aided Engineering (CAE) Semiconductor IP (SIP) IC Physical Design & Verification Printed Circuit Board (PCB) & Multi-Chip Module (MCM)
by Deployment Mode On-premises Cloud-Based
by Application Microprocessors & Microcontrollers Memory Management Units Others
by End-User Aerospace & Defense Consumer Electronics Telecom Automotive Industrial Others

Electronic Design Automation (EDA) Market, by Region

North America (United States, Canada and Mexico) Europe (UK, France, Germany, Italy, Spain, Sweden, Austria and Rest of Europe) Asia Pacific (China, South Korea, Japan, India, Australia, Indonesia, Malaysia, Vietnam, Taiwan, Bangladesh, Pakistan and Rest of APAC) Middle East and Africa (South Africa, GCC, Egypt, Nigeria and Rest of ME&A) South America (Brazil, Argentina Rest of South America)

Electronic Design Automation (EDA) Market, Key Players

North America 1. Cadence Design Systems, Inc. 2. Synopsys, Inc. 3. Siemens EDA 4. ANSYS, Inc. 5. Keysight Technologies 6. Altium Limited 7. Silvaco, Inc. 8. Agnisys, Inc. 9. Rambus Inc. 10. Aldec, Inc. 11. Analog Devices, Inc. (ADI) 12. Xilinx, Inc. (AMD) 13. Pulsic Limited Europe 1. Altair Engineering, Inc. 2. Dialog Semiconductor (Renesas) 3. Sofics 4. Dolphin Design 5. EDAptive Computing Elmatica 6. Sigrity (Cadence) Asia-Pacific 1. Siemens EDA (India) 2. Zuken Inc. (Japan) 3. PDF Solutions, Inc. 4. Primarius Technologies Co., Ltd. 5. ProPlus Design Systems, Inc. (Ansys) 6. Empyrean Technology

Frequently Asked Questions

1] What segments are covered in the Global Electronic Design Automation (EDA) Market report? Ans. The segments covered in the Electronic Design Automation (EDA) Market report are based on, Product Category, Deployment Mode, Application, End Use Industry and Regions. 2] Which region is expected to hold the highest share of the Global Electronic Design Automation (EDA) Market? Ans. The Asia Pacific region is expected to hold the highest share of the Electronic Design Automation (EDA) Market. 3] What is the market size of the Global Electronic Design Automation (EDA) Market by 2032? Ans. The market size of the Electronic Design Automation (EDA) Market by 2032 is expected to reach US$39.95 Bn. 4] What was the market size of the Global Market in 2024? Ans. The market size of the Market in 2024 was valued at US$19.53 Bn.
1. Electronic Design Automation (EDA) Introduction 1.1. Study Assumptions and Market Definition 1.2. Scope of the Study 1.3. Executive Summary 2. Electronic Design Automation (EDA): Competitive Landscape 2.1. Ecosystem Analysis 2.2. MMR Competition Matrix 2.3. Competitive Landscape 2.4. Key Players Benchmarking 2.4.1. Company Name 2.4.2. Business Segment 2.4.3. End-User Segment 2.4.4. Revenue (2024) 2.4.5. Company Location 2.5. Market Structure 2.5.1. Market Leaders 2.5.2. Market Followers 2.5.3. Emerging Players 2.6. Mergers and Acquisitions Details 2.7. KANO Model Analysis 3. Electronic Design Automation (EDA): Dynamics 3.1. Region-wise Trends of Electronic Design Automation (EDA) 3.1.1. North America Electronic Design Automation (EDA) Trends 3.1.2. Europe Electronic Design Automation (EDA) Trends 3.1.3. Asia Pacific Electronic Design Automation (EDA) Trends 3.1.4. Middle East and Africa Electronic Design Automation (EDA) Trends 3.1.5. South America Electronic Design Automation (EDA) Trends 3.2. Electronic Design Automation (EDA) Dynamics 3.2.1. Electronic Design Automation (EDA) Drivers 3.2.2. Electronic Design Automation (EDA) Opportunity 3.2.3. Electronic Design Automation (EDA) Challenges 3.3. PORTER’s Five Forces Analysis 3.4. PESTLE Using Tree-Map Analysis 3.4.1. Capital Investment Trends in Smart Manufacturing 3.4.2. Rising Labour Costs in Emerging Markets 3.5. Regulatory Landscape by Region 3.5.1. North America 3.5.2. Europe 3.5.3. Asia Pacific 3.5.4. Middle East and Africa 3.5.5. South America 4. Electronic Design Automation (EDA): Global Market Size and Forecast by Segmentation (by Value in USD Bn) (2024-2032) 4.1. Electronic Design Automation (EDA) Size and Forecast, By Product Category (2024-2032) 4.1.1. Computer-Aided Engineering (CAE) 4.1.2. Semiconductor IP (SIP) 4.1.3. IC PHYSICAL DESIGN AND VERIFICATION 4.1.4. Printed Circuit Board (PCB) and Multi-Chip Module (MCM) 4.2. Electronic Design Automation (EDA) Size and Forecast, By Application (2024-2032) 4.2.1. Microprocessors and Microcontrollers 4.2.2. Memory Management Units 4.2.3. Others 4.3. Electronic Design Automation (EDA) Size and Forecast, By Deployment Mode (2024-2032) 4.3.1. On-premises 4.3.2. Cloud-Based 4.4. Electronic Design Automation (EDA) Size and Forecast, By End-Use (2024-2032) 4.4.1. Aerospace and Defense 4.4.2. Consumer Electronics 4.4.3. Telecom 4.4.4. Automotive 4.4.5. Industrial 4.4.6. Others 4.5. Electronic Design Automation (EDA) Size and Forecast, By region (2024-2032) 4.5.1. North America 4.5.2. Europe 4.5.3. Asia Pacific 4.5.4. Middle East and Africa 4.5.5. South America 5. North America Electronic Design Automation (EDA) Size and Forecast by Segmentation (by Value in USD Bn) (2024-2032) 5.1. North America Electronic Design Automation (EDA) Size and Forecast, By Product Category (2024-2032) 5.1.1. Computer Aided Engineering (CAE) 5.1.2. Semiconductor IP (SIP) 5.1.3. IC PHYSICAL DESIGN AND VERIFICATION 5.1.4. Printed Circuit Board (PCB) and Multi-Chip Module (MCM) 5.2. North America Electronic Design Automation (EDA) Size and Forecast, By Application (2024-2032) 5.2.1. Microprocessors and Microcontrollers 5.2.2. Memory Management Units 5.2.3. Others 5.3. North America Electronic Design Automation (EDA) Size and Forecast, By Deployment Mode (2024-2032) 5.3.1. On-premises 5.3.2. Cloud-Based 5.4. North America Electronic Design Automation (EDA) Size and Forecast, By End-Use (2024-2032) 5.4.1. Aerospace and Defense 5.4.2. Consumer Electronics 5.4.3. Telecom 5.4.4. Automotive 5.4.5. Industrial 5.4.6. Others 5.5. North America Electronic Design Automation (EDA) Size and Forecast, By Country (2024-2032) 5.5.1. United States 5.5.1.1. United States Electronic Design Automation (EDA) Size and Forecast, By Product Category (2024-2032) 5.5.1.1.1. Computer-Aided Engineering (CAE) 5.5.1.1.2. Semiconductor IP (SIP) 5.5.1.1.3. IC PHYSICAL DESIGN AND VERIFICATION 5.5.1.1.4. Printed Circuit Board (PCB) and Multi-Chip Module (MCM) 5.5.1.2. United States Electronic Design Automation (EDA) Size and Forecast, By Application (2024-2032) 5.5.1.2.1. Microprocessors and Microcontrollers 5.5.1.2.2. Memory Management Units 5.5.1.2.3. Others 5.5.1.3. United States Electronic Design Automation (EDA) Size and Forecast, By Deployment Mode (2024-2032) 5.5.1.3.1. On-premises 5.5.1.3.2. Cloud-Based 5.5.1.4. United States Electronic Design Automation (EDA) Size and Forecast, By End-Use (2024-2032) 5.5.1.4.1. Aerospace and Defense 5.5.1.4.2. Consumer Electronics 5.5.1.4.3. Telecom 5.5.1.4.4. Automotive 5.5.1.4.5. Industrial 5.5.1.4.6. Others 5.5.2. Canada 5.5.2.1. Canada Electronic Design Automation (EDA) Size and Forecast, By Product Category (2024-2032) 5.5.2.1.1. Computer-Aided Engineering (CAE) 5.5.2.1.2. Semiconductor IP (SIP) 5.5.2.1.3. IC PHYSICAL DESIGN AND VERIFICATION 5.5.2.1.4. Printed Circuit Board (PCB) and Multi-Chip Module (MCM) 5.5.2.2. Canada Electronic Design Automation (EDA) Size and Forecast, By Application (2024-2032) 5.5.2.2.1. Microprocessors and Microcontrollers 5.5.2.2.2. Memory Management Units 5.5.2.2.3. Others 5.5.2.3. Canada Electronic Design Automation (EDA) Size and Forecast, By Deployment Mode (2024-2032) 5.5.2.3.1. On-premises 5.5.2.3.2. Cloud-Based 5.5.2.4. Canada Electronic Design Automation (EDA) Size and Forecast, By End-Use (2024-2032) 5.5.2.4.1. Aerospace and Defense 5.5.2.4.2. Consumer Electronics 5.5.2.4.3. Telecom 5.5.2.4.4. Industrial 5.5.2.4.5. Others 5.5.3. Mexico 5.5.3.1. Mexico Electronic Design Automation (EDA) Size and Forecast, By Product Category (2024-2032) 5.5.3.1.1. Computer-Aided Engineering (CAE) 5.5.3.1.2. Semiconductor IP (SIP) 5.5.3.1.3. IC PHYSICAL DESIGN AND VERIFICATION 5.5.3.1.4. Printed Circuit Board (PCB) and Multi-Chip Module (MCM) 5.5.3.2. Mexico Electronic Design Automation (EDA) Size and Forecast, By Application (2024-2032) 5.5.3.2.1. Microprocessors and Microcontrollers 5.5.3.2.2. Memory Management Units 5.5.3.2.3. Others 5.5.3.3. Mexico Electronic Design Automation (EDA) Size and Forecast, By Deployment Mode (2024-2032) 5.5.3.3.1. On-premises 5.5.3.3.2. Cloud-Based 5.5.3.4. Mexico Electronic Design Automation (EDA) Size and Forecast, By End-Use (2024-2032) 5.5.3.4.1. Aerospace and Defense 5.5.3.4.2. Consumer Electronics 5.5.3.4.3. Telecom 5.5.3.4.4. Industrial 5.5.3.4.5. Others 6. Europe Electronic Design Automation (EDA) Size and Forecast by Segmentation (by Value in USD Bn) (2024-2032) 6.1. Europe Electronic Design Automation (EDA) Size and Forecast, By Product Category (2024-2032) 6.2. Europe Electronic Design Automation (EDA) Size and Forecast, By Application (2024-2032) 6.3. Europe Electronic Design Automation (EDA) Size and Forecast, By Deployment Mode (2024-2032) 6.4. Europe Electronic Design Automation (EDA) Size and Forecast, By End-Use (2024-2032) 6.5. Europe Electronic Design Automation (EDA) Size and Forecast, By Country (2024-2032) 6.5.1. United Kingdom 6.5.1.1. United Kingdom Electronic Design Automation (EDA) Size and Forecast, By Product Category (2024-2032) 6.5.1.2. United Kingdom Electronic Design Automation (EDA) Size and Forecast, By Application (2024-2032) 6.5.1.3. United Kingdom Electronic Design Automation (EDA) Size and Forecast, By Deployment Mode (2024-2032) 6.5.1.4. United Kingdom Electronic Design Automation (EDA) Size and Forecast, By End-Use (2024-2032) 6.5.2. France 6.5.2.1. France Electronic Design Automation (EDA) Size and Forecast, By Product Category (2024-2032) 6.5.2.2. France Electronic Design Automation (EDA) Size and Forecast, By Application (2024-2032) 6.5.2.3. France Electronic Design Automation (EDA) Size and Forecast, By Deployment Mode (2024-2032) 6.5.2.4. France Electronic Design Automation (EDA) Size and Forecast, By End-Use (2024-2032) 6.5.3. Germany 6.5.3.1. Germany Electronic Design Automation (EDA) Size and Forecast, By Product Category (2024-2032) 6.5.3.2. Germany Electronic Design Automation (EDA) Size and Forecast, By Application (2024-2032) 6.5.3.3. Germany Electronic Design Automation (EDA) Size and Forecast, By Deployment Mode (2024-2032) 6.5.3.4. Germany Electronic Design Automation (EDA) Size and Forecast, By End-Use (2024-2032) 6.5.4. Italy 6.5.4.1. Italy Electronic Design Automation (EDA) Size and Forecast, By Product Category (2024-2032) 6.5.4.2. Italy Electronic Design Automation (EDA) Size and Forecast, By Application (2024-2032) 6.5.4.3. Italy Electronic Design Automation (EDA) Size and Forecast, By Deployment Mode (2024-2032) 6.5.4.4. Italy Electronic Design Automation (EDA) Size and Forecast, By End-Use (2024-2032) 6.5.5. Spain 6.5.5.1. Spain Electronic Design Automation (EDA) Size and Forecast, By Product Category (2024-2032) 6.5.5.2. Spain Electronic Design Automation (EDA) Size and Forecast, By Application (2024-2032) 6.5.5.3. Spain Electronic Design Automation (EDA) Size and Forecast, By Deployment Mode (2024-2032) 6.5.5.4. Spain Electronic Design Automation (EDA) Size and Forecast, By End-Use (2024-2032) 6.5.6. Sweden 6.5.6.1. Sweden Electronic Design Automation (EDA) Size and Forecast, By Product Category (2024-2032) 6.5.6.2. Sweden Electronic Design Automation (EDA) Size and Forecast, By Application (2024-2032) 6.5.6.3. Sweden Electronic Design Automation (EDA) Size and Forecast, By Deployment Mode (2024-2032) 6.5.6.4. Sweden Electronic Design Automation (EDA) Size and Forecast, By End-Use (2024-2032) 6.5.7. Austria 6.5.7.1. Austria Electronic Design Automation (EDA) Size and Forecast, By Product Category (2024-2032) 6.5.7.2. Austria Electronic Design Automation (EDA) Size and Forecast, By Application (2024-2032) 6.5.7.3. Austria Electronic Design Automation (EDA) Size and Forecast, By Deployment Mode (2024-2032) 6.5.7.4. Austria Electronic Design Automation (EDA) Size and Forecast, By End-Use (2024-2032) 6.5.8. Rest of Europe 6.5.8.1. Rest of Europe Electronic Design Automation (EDA) Size and Forecast, By Product Category (2024-2032) 6.5.8.2. Rest of Europe Electronic Design Automation (EDA) Size and Forecast, By Application (2024-2032) 6.5.8.3. Rest of Europe Electronic Design Automation (EDA) Size and Forecast, By Deployment Mode (2024-2032) 6.5.8.4. Rest of Europe Electronic Design Automation (EDA) Size and Forecast, By End-Use (2024-2032) 7. Asia Pacific Electronic Design Automation (EDA) Size and Forecast by Segmentation (by Value in USD Bn) (2024-2032) 7.1. Asia Pacific Electronic Design Automation (EDA) Size and Forecast, By Product Category (2024-2032) 7.2. Asia Pacific Electronic Design Automation (EDA) Size and Forecast, By Application (2024-2032) 7.3. Asia Pacific Electronic Design Automation (EDA) Size and Forecast, By Deployment Mode (2024-2032) 7.4. Asia Pacific Electronic Design Automation (EDA) Size and Forecast, By End-Use (2024-2032) 7.5. Asia Pacific Electronic Design Automation (EDA) Size and Forecast, By Country (2024-2032) 7.5.1. China 7.5.1.1. China Electronic Design Automation (EDA) Size and Forecast, By Product Category (2024-2032) 7.5.1.2. China Electronic Design Automation (EDA) Size and Forecast, By Application (2024-2032) 7.5.1.3. China Electronic Design Automation (EDA) Size and Forecast, By Deployment Mode (2024-2032) 7.5.1.4. China Electronic Design Automation (EDA) Size and Forecast, By End-Use (2024-2032) 7.5.2. S Korea 7.5.2.1. S Korea Electronic Design Automation (EDA) Size and Forecast, By Product Category (2024-2032) 7.5.2.2. S Korea Electronic Design Automation (EDA) Size and Forecast, By Application (2024-2032) 7.5.2.3. S Korea Electronic Design Automation (EDA) Size and Forecast, By Deployment Mode (2024-2032) 7.5.2.4. S Korea Electronic Design Automation (EDA) Size and Forecast, By End-Use (2024-2032) 7.5.3. Japan 7.5.3.1. Japan Electronic Design Automation (EDA) Size and Forecast, By Product Category (2024-2032) 7.5.3.2. Japan Electronic Design Automation (EDA) Size and Forecast, By Application (2024-2032) 7.5.3.3. Japan Electronic Design Automation (EDA) Size and Forecast, By Deployment Mode (2024-2032) 7.5.3.4. Japan Electronic Design Automation (EDA) Size and Forecast, By End-Use (2024-2032) 7.5.4. India 7.5.4.1. India Electronic Design Automation (EDA) Size and Forecast, By Product Category (2024-2032) 7.5.4.2. India Electronic Design Automation (EDA) Size and Forecast, By Application (2024-2032) 7.5.4.3. India Electronic Design Automation (EDA) Size and Forecast, By Deployment Mode (2024-2032) 7.5.4.4. India Electronic Design Automation (EDA) Size and Forecast, By End-Use (2024-2032) 7.5.5. Australia 7.5.5.1. Australia Electronic Design Automation (EDA) Size and Forecast, By Product Category (2024-2032) 7.5.5.2. Australia Electronic Design Automation (EDA) Size and Forecast, By Application (2024-2032) 7.5.5.3. Australia Electronic Design Automation (EDA) Size and Forecast, By Deployment Mode (2024-2032) 7.5.5.4. Australia Electronic Design Automation (EDA) Size and Forecast, By End-Use (2024-2032) 7.5.6. Indonesia 7.5.6.1. Indonesia Electronic Design Automation (EDA) Size and Forecast, By Product Category (2024-2032) 7.5.6.2. Indonesia Electronic Design Automation (EDA) Size and Forecast, By Application (2024-2032) 7.5.6.3. Indonesia Electronic Design Automation (EDA) Size and Forecast, By Deployment Mode (2024-2032) 7.5.6.4. Indonesia Electronic Design Automation (EDA) Size and Forecast, By End-Use (2024-2032) 7.5.7. Philippines 7.5.7.1. Philippines Electronic Design Automation (EDA) Size and Forecast, By Product Category (2024-2032) 7.5.7.2. Philippines Electronic Design Automation (EDA) Size and Forecast, By Application (2024-2032) 7.5.7.3. Philippines Electronic Design Automation (EDA) Size and Forecast, By Deployment Mode (2024-2032) 7.5.7.4. Philippines Electronic Design Automation (EDA) Size and Forecast, By End-Use (2024-2032) 7.5.8. Malaysia 7.5.8.1. Malaysia Electronic Design Automation (EDA) Size and Forecast, By Product Category (2024-2032) 7.5.8.2. Malaysia Electronic Design Automation (EDA) Size and Forecast, By Application (2024-2032) 7.5.8.3. Malaysia Electronic Design Automation (EDA) Size and Forecast, By Deployment Mode (2024-2032) 7.5.8.4. Malaysia Electronic Design Automation (EDA) Size and Forecast, By End-Use (2024-2032) 7.5.9. Vietnam 7.5.9.1. Vietnam Electronic Design Automation (EDA) Size and Forecast, By Product Category (2024-2032) 7.5.9.2. Vietnam Electronic Design Automation (EDA) Size and Forecast, By Application (2024-2032) 7.5.9.3. Vietnam Electronic Design Automation (EDA) Size and Forecast, By Deployment Mode (2024-2032) 7.5.9.4. Vietnam Electronic Design Automation (EDA) Size and Forecast, By End-Use (2024-2032) 7.5.10. Thailand 7.5.10.1. Thailand Electronic Design Automation (EDA) Size and Forecast, By Product Category (2024-2032) 7.5.10.2. Thailand Electronic Design Automation (EDA) Size and Forecast, By Application (2024-2032) 7.5.10.3. Thailand Electronic Design Automation (EDA) Size and Forecast, By Deployment Mode (2024-2032) 7.5.10.4. Thailand Electronic Design Automation (EDA) Size and Forecast, By End-Use (2024-2032) 7.5.11. Rest of Asia Pacific 7.5.11.1. Rest of Asia Pacific Electronic Design Automation (EDA) Size and Forecast, By Product Category (2024-2032) 7.5.11.2. Rest of Asia Pacific Electronic Design Automation (EDA) Size and Forecast, By Application (2024-2032) 7.5.11.3. Rest of Asia Pacific Electronic Design Automation (EDA) Size and Forecast, By Deployment Mode (2024-2032) 7.5.11.4. Rest of Asia Pacific Electronic Design Automation (EDA) Size and Forecast, By End-Use (2024-2032) 8. Middle East and Africa Electronic Design Automation (EDA) Size and Forecast by Segmentation (by Value in USD Bn) (2024-2032) 8.1. Middle East and Africa Electronic Design Automation (EDA) Size and Forecast, By Product Category (2024-2032) 8.2. Middle East and Africa Electronic Design Automation (EDA) Size and Forecast, By Application (2024-2032) 8.3. Middle East and Africa Electronic Design Automation (EDA) Size and Forecast, By Deployment Mode (2024-2032) 8.4. Middle East and Africa Electronic Design Automation (EDA) Size and Forecast, By End-Use (2024-2032) 8.5. Middle East and Africa Electronic Design Automation (EDA) Size and Forecast, By Country (2024-2032) 8.5.1. South Africa 8.5.1.1. South Africa Electronic Design Automation (EDA) Size and Forecast, By Product Category (2024-2032) 8.5.1.2. South Africa Electronic Design Automation (EDA) Size and Forecast, By Application (2024-2032) 8.5.1.3. South Africa Electronic Design Automation (EDA) Size and Forecast, By Deployment Mode (2024-2032) 8.5.1.4. South Africa Electronic Design Automation (EDA) Size and Forecast, By End-Use (2024-2032) 8.5.2. GCC 8.5.2.1. GCC Electronic Design Automation (EDA) Size and Forecast, By Product Category (2024-2032) 8.5.2.2. GCC Electronic Design Automation (EDA) Size and Forecast, By Application (2024-2032) 8.5.2.3. GCC Electronic Design Automation (EDA) Size and Forecast, By Deployment Mode (2024-2032) 8.5.2.4. GCC Electronic Design Automation (EDA) Size and Forecast, By End-Use (2024-2032) 8.5.3. Nigeria 8.5.3.1. Nigeria Electronic Design Automation (EDA) Size and Forecast, By Product Category (2024-2032) 8.5.3.2. Nigeria Electronic Design Automation (EDA) Size and Forecast, By Application (2024-2032) 8.5.3.3. Nigeria Electronic Design Automation (EDA) Size and Forecast, By Deployment Mode (2024-2032) 8.5.3.4. Nigeria Electronic Design Automation (EDA) Size and Forecast, By End-Use (2024-2032) 8.5.4. Rest of ME&A 8.5.4.1. Rest of ME&A Electronic Design Automation (EDA) Size and Forecast, By Product Category (2024-2032) 8.5.4.2. Rest of ME&A Electronic Design Automation (EDA) Size and Forecast, By Application (2024-2032) 8.5.4.3. Rest of ME&A Electronic Design Automation (EDA) Size and Forecast, By Deployment Mode (2024-2032) 8.5.4.4. Rest of ME&A Electronic Design Automation (EDA) Size and Forecast, By End-Use (2024-2032) 9. South America Electronic Design Automation (EDA) Size and Forecast by Segmentation (by Value in USD Bn) (2024-2032) 9.1. South America Electronic Design Automation (EDA) Size and Forecast, By Product Category (2024-2032) 9.2. South America Electronic Design Automation (EDA) Size and Forecast, By Application (2024-2032) 9.3. South America Electronic Design Automation (EDA) Size and Forecast, By Deployment Mode (2024-2032) 9.4. South America Electronic Design Automation (EDA) Size and Forecast, By End-Use (2024-2032) 9.5. South America Electronic Design Automation (EDA) Size and Forecast, By Country (2024-2032) 9.5.1. Brazil 9.5.1.1. Brazil Electronic Design Automation (EDA) Size and Forecast, By Product Category (2024-2032) 9.5.1.2. Brazil Electronic Design Automation (EDA) Size and Forecast, By Application (2024-2032) 9.5.1.3. Brazil Electronic Design Automation (EDA) Size and Forecast, By Deployment Mode (2024-2032) 9.5.1.4. Brazil Electronic Design Automation (EDA) Size and Forecast, By End-Use (2024-2032) 9.5.2. Argentina 9.5.2.1. Argentina Electronic Design Automation (EDA) Size and Forecast, By Product Category (2024-2032) 9.5.2.2. Argentina Electronic Design Automation (EDA) Size and Forecast, By Application (2024-2032) 9.5.2.3. Argentina Electronic Design Automation (EDA) Size and Forecast, By Deployment Mode (2024-2032) 9.5.2.4. Argentina Electronic Design Automation (EDA) Size and Forecast, By End-Use (2024-2032) 9.5.3. Rest of South America 9.5.3.1. Rest of South America Electronic Design Automation (EDA) Size and Forecast, By Product Category (2024-2032) 9.5.3.2. Rest of South America Electronic Design Automation (EDA) Size and Forecast, By Application (2024-2032) 9.5.3.3. Rest of South America Electronic Design Automation (EDA) Size and Forecast, By Deployment Mode (2024-2032) 9.5.3.4. Rest of South America Electronic Design Automation (EDA) Size and Forecast, By End-Use (2024-2032) 10. Company Profile (Detailed Profile for all Major Industry Players) 10.1. Synopsys, Inc. 10.1.1. Business Portfolio 10.1.2. Financial Overview 10.1.3. SWOT Analysis 10.1.4. Strategic Analysis 10.1.5. Recent Developments 10.2. Cadence Design Systems, Inc. 10.3. Siemens EDA 10.4. ANSYS, Inc. 10.5. Keysight Technologies 10.6. Altium Limited 10.7. Silvaco, Inc. 10.8. Agnisys, Inc. 10.9. Rambus Inc. 10.10. Aldec, Inc. 10.11. Analog Devices, Inc. (ADI) 10.12. Xilinx, Inc. (AMD) 10.13. Pulsic Limited 10.14. Altair Engineering, Inc. 10.15. Dialog Semiconductor (Renesas) 10.16. Sofics 10.17. Dolphin Design 10.18. EDAptive ComputingElmatica 10.19. Sigrity (Cadence) 10.20. Siemens EDA (India) 10.21. Zuken Inc. (Japan) 10.22. PDF Solutions, Inc. 10.23. Primarius Technologies Co., Ltd. 10.24. ProPlus Design Systems, Inc. (Ansys) 10.25. Empyrean Technology 11. Analyst Recommendations 12. Electronic Design Automation (EDA): Research Methodology
  • INQUIRE BEFORE BUYING
MMRLogo
America's Fastest Growing Market Research Firm