1. Clear Aligners Market Introduction
1.1. Study Assumption and Market Definition
1.2. Scope of the Study
1.3. Executive Summary
2. Clear Aligners Market: Qualitative Analysis
2.1. Technological Advancements in Clear Aligners system
2.2. Consumer Preferences and Buying Behavior
3. Clear Aligners Market: Dynamics
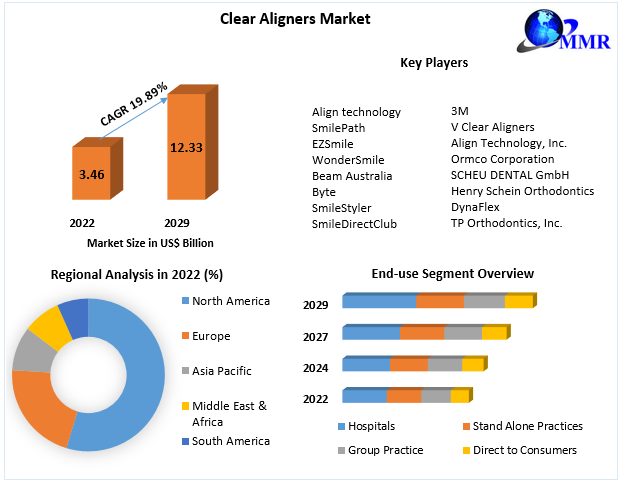
3.1. Clear Aligners Market Trends by Region
3.1.1. North America Clear Aligners Market Trends
3.1.2. Europe Clear Aligners Market Trends
3.1.3. Asia Pacific Clear Aligners Market Trends
3.1.4. Middle East and Africa Clear Aligners Market Trends
3.1.5. South America Clear Aligners Market Trends
3.2. Clear Aligners Market Dynamics by Region
3.2.1. North America
3.2.1.1. North America Clear Aligners Market Drivers
3.2.1.2. North America Clear Aligners Market Restraints
3.2.1.3. North America Clear Aligners Market Opportunities
3.2.1.4. North America Clear Aligners Market Challenges
3.2.2. Europe
3.2.2.1. Europe Clear Aligners Market Drivers
3.2.2.2. Europe Clear Aligners Market Restraints
3.2.2.3. Europe Clear Aligners Market Opportunities
3.2.2.4. Europe Clear Aligners Market Challenges
3.2.3. Asia Pacific
3.2.3.1. Asia Pacific Clear Aligners Market Drivers
3.2.3.2. Asia Pacific Clear Aligners Market Restraints
3.2.3.3. Asia Pacific Clear Aligners Market Opportunities
3.2.3.4. Asia Pacific Clear Aligners Market Challenges
3.2.4. Middle East and Africa
3.2.4.1. Middle East and Africa Clear Aligners Market Drivers
3.2.4.2. Middle East and Africa Clear Aligners Market Restraints
3.2.4.3. Middle East and Africa Clear Aligners Market Opportunities
3.2.4.4. Middle East and Africa Clear Aligners Market Challenges
3.2.5. South America
3.2.5.1. South America Clear Aligners Market Drivers
3.2.5.2. South America Clear Aligners Market Restraints
3.2.5.3. South America Clear Aligners Market Opportunities
3.2.5.4. South America Clear Aligners Market Challenges
3.3. PORTER’s Five Forces Analysis
3.4. PESTLE Analysis
3.5. Regulatory Landscape by Region
3.5.1. North America
3.5.2. Europe
3.5.3. Asia Pacific
3.5.4. Middle East and Africa
3.5.5. South America
3.6. Key Opinion Leader Analysis for Clear Aligners Industry
3.7. The Global Pandemic Impact on Clear Aligners Market
4. Clear Aligners Market: Global Market Size and Forecast by Segmentation (by Value in USD Million) (2023-2030)
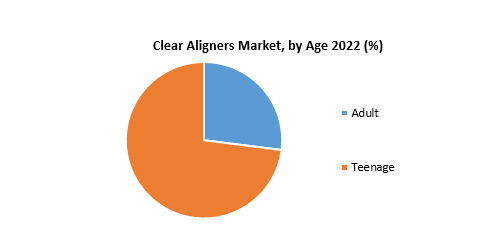
4.1. Clear Aligners Market Size and Forecast, by Age (2023-2030)
4.1.1. Adult
4.1.2. Teenage
4.2. Clear Aligners Market Size and Forecast, by End-use (2023-2030)
4.2.1. Hospitals
4.2.2. Stand Alone Practices
4.2.3. Group Practice
4.3. Clear Aligners Market Size and Forecast, by Distribution Channel (2023-2030)
4.3.1. Offline
4.3.2. Online
4.4. Clear Aligners Market Size and Forecast, by region (2023-2030)
4.4.1. North America
4.4.2. Europe
4.4.3. Asia Pacific
4.4.4. Middle East and Africa
4.4.5. South America
5. North America Clear Aligners Market Size and Forecast by Segmentation (by Value in USD Million) (2023-2030)
5.1. North America Clear Aligners Market Size and Forecast, by Age (2023-2030)
5.1.1. Adult
5.1.2. Teenage
5.2. North America Clear Aligners Market Size and Forecast, by End-use (2023-2030)
5.2.1. Hospitals
5.2.2. Stand Alone Practices
5.2.3. Group Practice
5.3. North America Clear Aligners Market Size and Forecast, by Distribution Channel (2023-2030)
5.3.1. Offline
5.3.2. Online
5.4. North America Clear Aligners Market Size and Forecast, by Country (2023-2030)
5.4.1. United States
5.4.1.1. United States Clear Aligners Market Size and Forecast, by Age (2023-2030)
5.4.1.1.1. Adult
5.4.1.1.2. Teenage
5.4.1.2. United States Clear Aligners Market Size and Forecast, by End-use (2023-2030)
5.4.1.2.1. Hospitals
5.4.1.2.2. Stand Alone Practices
5.4.1.2.3. Group Practice
5.4.1.3. United States Clear Aligners Market Size and Forecast, by Distribution Channel (2023-2030)
5.4.1.3.1. Offline
5.4.1.3.2. Online
5.4.2. Canada
5.4.2.1. Canada Clear Aligners Market Size and Forecast, by Age (2023-2030)
5.4.2.1.1. Adult
5.4.2.1.2. Teenage
5.4.2.2. Canada Clear Aligners Market Size and Forecast, by End-use (2023-2030)
5.4.2.2.1. Hospitals
5.4.2.2.2. Stand Alone Practices
5.4.2.2.3. Group Practice
5.4.2.3. Canada Clear Aligners Market Size and Forecast, by Distribution Channel (2023-2030)
5.4.2.3.1. Offline
5.4.2.3.2. Online
5.4.3. Mexico
5.4.3.1. Mexico Clear Aligners Market Size and Forecast, by Age (2023-2030)
5.4.3.1.1. Adult
5.4.3.1.2. Teenage
5.4.3.2. Mexico Clear Aligners Market Size and Forecast, by End-use (2023-2030)
5.4.3.2.1. Hospitals
5.4.3.2.2. Stand Alone Practices
5.4.3.2.3. Group Practice
5.4.3.3. Mexico Clear Aligners Market Size and Forecast, by Distribution Channel (2023-2030)
5.4.3.3.1. Offline
5.4.3.3.2. Online
6. Europe Clear Aligners Market Size and Forecast by Segmentation (by Value in USD Million) (2023-2030)
6.1. Europe Clear Aligners Market Size and Forecast, by Age (2023-2030)
6.2. Europe Clear Aligners Market Size and Forecast, by End-use (2023-2030)
6.3. Europe Clear Aligners Market Size and Forecast, by Distribution Channel (2023-2030)
6.4. Europe Clear Aligners Market Size and Forecast, by Country (2023-2030)
6.4.1. United Kingdom
6.4.1.1. United Kingdom Clear Aligners Market Size and Forecast, by Age (2023-2030)
6.4.1.2. United Kingdom Clear Aligners Market Size and Forecast, by End-use (2023-2030)
6.4.1.3. United Kingdom Clear Aligners Market Size and Forecast, by Distribution Channel (2023-2030)
6.4.2. France
6.4.2.1. France Clear Aligners Market Size and Forecast, by Age (2023-2030)
6.4.2.2. France Clear Aligners Market Size and Forecast, by End-use (2023-2030)
6.4.2.3. France Clear Aligners Market Size and Forecast, by Distribution Channel (2023-2030)
6.4.3. Germany
6.4.3.1. Germany Clear Aligners Market Size and Forecast, by Age (2023-2030)
6.4.3.2. Germany Clear Aligners Market Size and Forecast, by End-use (2023-2030)
6.4.3.3. Germany Clear Aligners Market Size and Forecast, by Distribution Channel (2023-2030)
6.4.4. Italy
6.4.4.1. Italy Clear Aligners Market Size and Forecast, by Age (2023-2030)
6.4.4.2. Italy Clear Aligners Market Size and Forecast, by End-use (2023-2030)
6.4.4.3. Italy Clear Aligners Market Size and Forecast, by Distribution Channel (2023-2030)
6.4.5. Spain
6.4.5.1. Spain Clear Aligners Market Size and Forecast, by Age (2023-2030)
6.4.5.2. Spain Clear Aligners Market Size and Forecast, by End-use (2023-2030)
6.4.5.3. Spain Clear Aligners Market Size and Forecast, by Distribution Channel (2023-2030)
6.4.6. Sweden
6.4.6.1. Sweden Clear Aligners Market Size and Forecast, by Age (2023-2030)
6.4.6.2. Sweden Clear Aligners Market Size and Forecast, by End-use (2023-2030)
6.4.6.3. Sweden Clear Aligners Market Size and Forecast, by Distribution Channel (2023-2030)
6.4.7. Austria
6.4.7.1. Austria Clear Aligners Market Size and Forecast, by Age (2023-2030)
6.4.7.2. Austria Clear Aligners Market Size and Forecast, by End-use (2023-2030)
6.4.7.3. Austria Clear Aligners Market Size and Forecast, by Distribution Channel (2023-2030)
6.4.8. Rest of Europe
6.4.8.1. Rest of Europe Clear Aligners Market Size and Forecast, by Age (2023-2030)
6.4.8.2. Rest of Europe Clear Aligners Market Size and Forecast, by End-use (2023-2030)
6.4.8.3. Rest of Europe Clear Aligners Market Size and Forecast, by Distribution Channel (2023-2030)
7. Asia Pacific Clear Aligners Market Size and Forecast by Segmentation (by Value in USD Million) (2023-2030)
7.1. Asia Pacific Clear Aligners Market Size and Forecast, by Age (2023-2030)
7.2. Asia Pacific Clear Aligners Market Size and Forecast, by End-use (2023-2030)
7.3. Asia Pacific Clear Aligners Market Size and Forecast, by Distribution Channel (2023-2030)
7.4. Asia Pacific Clear Aligners Market Size and Forecast, by Country (2023-2030)
7.4.1. China
7.4.1.1. China Clear Aligners Market Size and Forecast, by Age (2023-2030)
7.4.1.2. China Clear Aligners Market Size and Forecast, by End-use (2023-2030)
7.4.1.3. China Clear Aligners Market Size and Forecast, by Distribution Channel (2023-2030)
7.4.2. S Korea
7.4.2.1. S Korea Clear Aligners Market Size and Forecast, by Age (2023-2030)
7.4.2.2. S Korea Clear Aligners Market Size and Forecast, by End-use (2023-2030)
7.4.2.3. S Korea Clear Aligners Market Size and Forecast, by Distribution Channel (2023-2030)
7.4.3. Japan
7.4.3.1. Japan Clear Aligners Market Size and Forecast, by Age (2023-2030)
7.4.3.2. Japan Clear Aligners Market Size and Forecast, by End-use (2023-2030)
7.4.3.3. Japan Clear Aligners Market Size and Forecast, by Distribution Channel (2023-2030)
7.4.4. India
7.4.4.1. India Clear Aligners Market Size and Forecast, by Age (2023-2030)
7.4.4.2. India Clear Aligners Market Size and Forecast, by End-use (2023-2030)
7.4.4.3. India Clear Aligners Market Size and Forecast, by Distribution Channel (2023-2030)
7.4.5. Australia
7.4.5.1. Australia Clear Aligners Market Size and Forecast, by Age (2023-2030)
7.4.5.2. Australia Clear Aligners Market Size and Forecast, by End-use (2023-2030)
7.4.5.3. Australia Clear Aligners Market Size and Forecast, by Distribution Channel (2023-2030)
7.4.6. Indonesia
7.4.6.1. Indonesia Clear Aligners Market Size and Forecast, by Age (2023-2030)
7.4.6.2. Indonesia Clear Aligners Market Size and Forecast, by End-use (2023-2030)
7.4.6.3. Indonesia Clear Aligners Market Size and Forecast, by Distribution Channel (2023-2030)
7.4.7. Malaysia
7.4.7.1. Malaysia Clear Aligners Market Size and Forecast, by Age (2023-2030)
7.4.7.2. Malaysia Clear Aligners Market Size and Forecast, by End-use (2023-2030)
7.4.7.3. Malaysia Clear Aligners Market Size and Forecast, by Distribution Channel (2023-2030)
7.4.8. Vietnam
7.4.8.1. Vietnam Clear Aligners Market Size and Forecast, by Age (2023-2030)
7.4.8.2. Vietnam Clear Aligners Market Size and Forecast, by End-use (2023-2030)
7.4.8.3. Vietnam Clear Aligners Market Size and Forecast, by Distribution Channel(2023-2030)
7.4.9. Taiwan
7.4.9.1. Taiwan Clear Aligners Market Size and Forecast, by Age (2023-2030)
7.4.9.2. Taiwan Clear Aligners Market Size and Forecast, by End-use (2023-2030)
7.4.9.3. Taiwan Clear Aligners Market Size and Forecast, by Distribution Channel (2023-2030)
7.4.10. Rest of Asia Pacific
7.4.10.1. Rest of Asia Pacific Clear Aligners Market Size and Forecast, by Age (2023-2030)
7.4.10.2. Rest of Asia Pacific Clear Aligners Market Size and Forecast, by End-use (2023-2030)
7.4.10.3. Rest of Asia Pacific Clear Aligners Market Size and Forecast, by Distribution Channel (2023-2030)
8. Middle East and Africa Clear Aligners Market Size and Forecast by Segmentation (by Value in USD Million) (2023-2030)
8.1. Middle East and Africa Clear Aligners Market Size and Forecast, by Age (2023-2030)
8.2. Middle East and Africa Clear Aligners Market Size and Forecast, by End-use (2023-2030)
8.3. Middle East and Africa Clear Aligners Market Size and Forecast, by Distribution Channel (2023-2030)
8.4. Middle East and Africa Clear Aligners Market Size and Forecast, by Country (2023-2030)
8.4.1. South Africa
8.4.1.1. South Africa Clear Aligners Market Size and Forecast, by Age (2023-2030)
8.4.1.2. South Africa Clear Aligners Market Size and Forecast, by End-use (2023-2030)
8.4.1.3. South Africa Clear Aligners Market Size and Forecast, by Distribution Channel (2023-2030)
8.4.2. GCC
8.4.2.1. GCC Clear Aligners Market Size and Forecast, by Age (2023-2030)
8.4.2.2. GCC Clear Aligners Market Size and Forecast, by End-use (2023-2030)
8.4.2.3. GCC Clear Aligners Market Size and Forecast, by Distribution Channel (2023-2030)
8.4.3. Nigeria
8.4.3.1. Nigeria Clear Aligners Market Size and Forecast, by Age (2023-2030)
8.4.3.2. Nigeria Clear Aligners Market Size and Forecast, by End-use (2023-2030)
8.4.3.3. Nigeria Clear Aligners Market Size and Forecast, by Distribution Channel (2023-2030)
8.4.4. Rest of ME&A
8.4.4.1. Rest of ME&A Clear Aligners Market Size and Forecast, by Age (2023-2030)
8.4.4.2. Rest of ME&A Clear Aligners Market Size and Forecast, by End-use (2023-2030)
8.4.4.3. Rest of ME&A Clear Aligners Market Size and Forecast, by Distribution Channel (2023-2030)
9. South America Clear Aligners Market Size and Forecast by Segmentation (by Value in USD Million) (2023-2030)
9.1. South America Clear Aligners Market Size and Forecast, by Age (2023-2030)
9.2. South America Clear Aligners Market Size and Forecast, by End-use (2023-2030)
9.3. South America Clear Aligners Market Size and Forecast, by Distribution Channel (2023-2030)
9.4. South America Clear Aligners Market Size and Forecast, by Country (2023-2030)
9.4.1. Brazil
9.4.1.1. Brazil Clear Aligners Market Size and Forecast, by Age (2023-2030)
9.4.1.2. Brazil Clear Aligners Market Size and Forecast, by End-use (2023-2030)
9.4.1.3. Brazil Clear Aligners Market Size and Forecast, by Distribution Channel (2023-2030)
9.4.2. Argentina
9.4.2.1. Argentina Clear Aligners Market Size and Forecast, by Age (2023-2030)
9.4.2.2. Argentina Clear Aligners Market Size and Forecast, by End-use (2023-2030)
9.4.2.3. Argentina Clear Aligners Market Size and Forecast, by Distribution Channel (2023-2030)
9.4.3. Rest Of South America
9.4.3.1. Rest Of South America Clear Aligners Market Size and Forecast, by Age (2023-2030)
9.4.3.2. Rest Of South America Clear Aligners Market Size and Forecast, by End-use (2023-2030)
9.4.3.3. Rest Of South America Clear Aligners Market Size and Forecast, by Distribution Channel (2023-2030)
10. Global Clear Aligners Market: Competitive Landscape
10.1. MMR Competition Matrix
10.2. Competitive Landscape
10.3. Key Players Benchmarking
10.3.1. Company Name
10.3.2. Business Segment
10.3.3. End-user Segment
10.3.4. Revenue (2023)
10.3.5. Company Locations
10.4. Leading Clear Aligners Market Companies, by market capitalization
10.5. Market Structure
10.5.1. Market Leaders
10.5.2. Market Followers
10.5.3. Emerging Players
10.6. Mergers and Acquisitions Details
11. Company Profile: Key Players
11.1. Align technology
11.1.1. Company Overview
11.1.2. Business Portfolio
11.1.3. Financial Overview
11.1.4. SWOT Analysis
11.1.5. Strategic Analysis
11.1.6. Recent Developments
11.2. SmilePath
11.3. EZSmile
11.4. WonderSmile
11.5. Beam Australia
11.6. Byte
11.7. SmileStyler
11.8. SmileDirectClub
11.9. 3M
11.10. V Clear Aligners
11.11. Align Technology, Inc.
11.12. Ormco Corporation
11.13. SCHEU DENTAL GmbH
11.14. Henry Schein Orthodontics
11.15. DynaFlex
11.16. TP Orthodontics, Inc.
12. Key Findings
13. Industry Recommendations
14. Clear Aligners Market: Research Methodology

 To know about the Research Methodology :- Request Free Sample Report