
Augmented Reality Connected Service Market Size by Augmented Type, Component, End User Verticals, Region – Segment-Level Market Assessment, Growth Opportunity Analysis, Competitive Mapping & Forecast to 2032
Overview
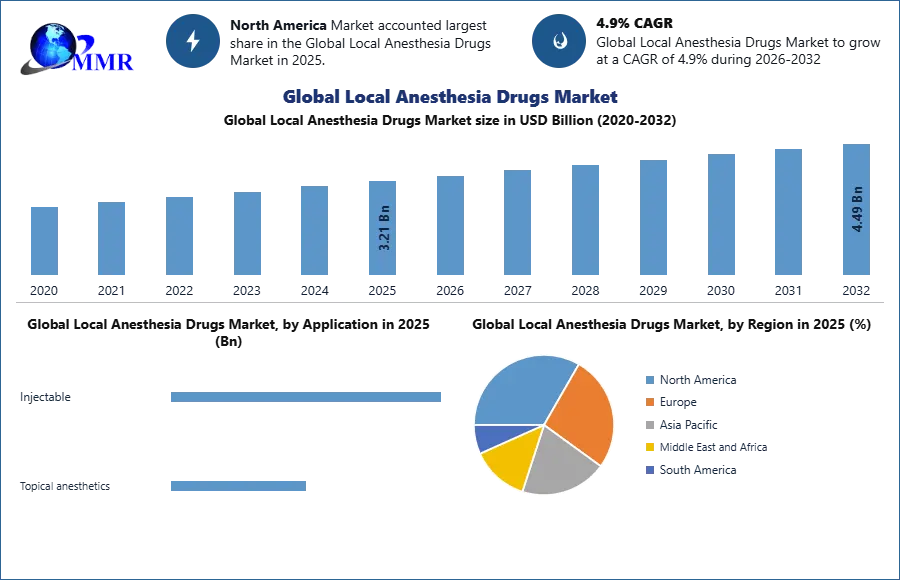
Global Local Anesthesia Drugs Market size was valued at US$ 3.21 Bn in 2025 and the total revenue is expected to grow at 4.9 % through 2026 to 2032, reaching nearly US$ 4.49 Bn.
The global Local Anesthesia Drugs Market report is a comprehensive analysis of the industry, market, and key players. The report has covered the market by demand and supply-side by segments. The global Local Anaesthesia Drugs Market report also provides trends by market segments, technology, and investment with a competitive landscape.
To know about the Research Methodology :- Request Free Sample Report
Global Local Anesthesia Drugs Market Overview
Local anesthesia is a slight loss of feeling in a particular part of the body or localized areas. These medications are administered to cure painful situations, exclusion of pain even when executing any major or minor surgeries, or also to minimize pain post-surgery. Several medications are being used as local aesthetic at higher amounts. A local anesthetic can be injected into the spot or absorbed through the skin. When a large area needs to be anesthetized or drugs that may not penetrate enough for this doctor me choose different anesthesia and last for usually 4 to 6 hours.
Local anesthesia allows a person to be awake or sedated, depending on the situation. Local anesthesia has a short duration and is frequently used for minor outpatient procedures (when a patient comes in for surgery and goes home on the same day). The Application of anesthesia used for the surgery is determined by many factors, such as the duration and Application of surgery, the health of the patient, and the preferences of the surgeon and the patient. In the next few years, the local anesthetics market is expected to grow by an average of 04 %.
Global Local Anesthesia Drugs Market Dynamics
Increased demand for post-surgery pain relief is fueling the market growth of the local anesthesia drugs. Due to the increased number of surgery across various parts of the world, this trend is expected to continue throughout the projected timeframe, impacting the ever-growing demand for local anesthesia drugs. Most of the surgeries performed require treatments post-surgery. The older generation is more vulnerable to conditions such as heart attacks and blockage of arteries, respiratory disease, brain conditions, and several other health issues. A rise in the technology advancements and logistics for delivery of drugs such as Air ambulance and green corridors are also estimated to drive the demand for local anesthetics
The growth of the market is also boosted by the arrival and usage of effective drugs such as articaine, levobupivacaine, and ropivacaine. Increase in the spending in the healthcare sector by the developing countries around the world such as India, China, and Brazil, where with time number of surgical procedures performed are increasing steadily. Moreover, Spike in the proportion of surgical procedures worldwide like oral surgery, plastic surgery, breast implants, lip surgery are also some major factors driving the local anesthetics market.
However, Pain at injection, needle fracture, prolongation of anesthesia and multiple temporal disorders, lack of influence, trismus, inflammation, edoema, hematoma, gingival lesions, skin injury, and ophthalmic complications are commonly observed complications that may restraint market from growing.
Global Local Anesthesia Drugs Market Segment Analysis
By Drug Type, the segment of Bupivacaine which is a local anesthetic used during a variety of surgical procedures is dominating the market. This assists in the blockage of sensory receptors that send pain signals to the brain. Hernia repairs, hip replacement, knee replacement, gall bladder removal, and tonsillectomies are the most common surgical procedures. Because of its effectiveness in inducing target organs, bupivacaine is commonly included in local anesthesia. As a result of the rising number of surgeries, there is a high demand for local anesthesia drugs, which is anticipated to accelerate the market's growth. As per the Royal College of Surgeons, there was 5 Mn admission for surgeries in the UK in 2003-04. By the year 2013-14, there has been 27% increase has been noted in the admission of surgical patients in the country.
By Application, the segment of injectable anesthetics segment dominated the market in terms of revenue & sales, and this growth is projected to continue during the forecast timeframe. This is primarily due to the widespread use of injectable anesthetics in various surgical procedures. Injectable anesthetics are usually used for numbing instead of pain control throughout processes. Dental work such as a root canal, skin biopsy, removal of growth under your skin, removal of a mole or deep wart, and mole or deep wart removal insertion are all practices that may require a local anesthesia injection.
The segment of topical anesthetic is also witnessing an upsurge in the market due to its increased use and benefits. Topical anesthetics are applied directly to the skin or mucosal tissue of the body, like the inside of the mouth, nose, or throat. They can also be used on the surface of the eye. Topical anesthetics are available in liquids, creams, gels, sprays, and patches. Applying or removing stitches, anything involving a needle poke, IV insertion, catheter insertion, laser treatments, cataract surgery, and endoscopy are all procedures that may require topical anesthesia.
Global Local Anesthesia Drugs Market Regional Insights:
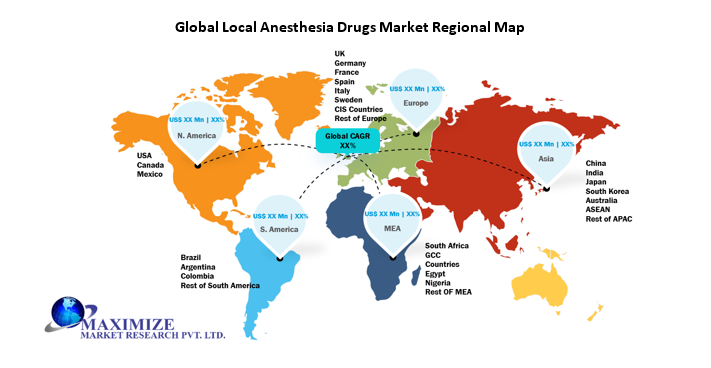
North America is dominating the global-local anesthesia market in the world as of 2019 due to an increase in the number of surgeries in old-aged people. The development of new anesthesia technologies for the administration and the rise of chronic diseases among older people fueled the market growth. The US anesthesia is the largest market share in the world. Major Key Players in the region with adequate investment in research and development for the production of innovative novel drugs are the key factor in the growth of the market in the region. The region contributes to 25% of global surgeries performed According to the United States Census Bureau, the total number of people aged 65 and older in the United States surpassed 45 million in 2017, and the population of older people is estimated to rise by approximately 17 million by 2030
The Asia Pacific is the second largest growing region in the world. This is due to rise in the dental and cosmetic surgeries, advancement in surgical procedures, and increased use of local anesthesia are fueling the market growth. Rise in healthcare and Investment in R&D by key players such. Ongoing pandemics bolstered the local anesthesia drug market due to an increase in the number of old-aged patients in the region. Especially in India. The overall increased number of surgeries performed has a significant effect on the Asia-Pacific anesthesia drugs market, as anesthetic medications are being used in surgical procedures to reduce pain. The elderly population is primed for chronic illnesses, which is leading to an increase in dependency on surgeries and therapies
European and South American regions are also witnessing substantial growth in the market mainly due to the increase of surgeries in old-aged people and the availability of anesthesia in the region. An increase in the number of patients in the region due to an increase in the population is propelling the market. England, Italy, and France are dominating the market in the region. In Europe, the number of surgeries performed is increasing. The rise in the number of surgeries performed has a significant effect on the anesthesia market.
The objective of the report is to present a comprehensive analysis of the Global Local Anesthesia Drugs Market to the stakeholders in the industry. The past and current status of the industry with the forecasted market size and trends are presented in the report with the analysis of complicated data in simple language. The report covers all the aspects of the industry with a dedicated study of key players that include market leaders, followers, and new entrants.
PORTER, SVOR, PESTEL analysis with the potential impact of micro-economic factors of the market have been presented in the report. External as well as internal factors that are supposed to affect the business positively or negatively have been analyzed, which will give a clear futuristic view of the industry to the decision-makers.
The report also helps in understanding the Global Local Anesthesia Drugs Market dynamics, structure by analyzing the market segments and project the Global Hemoglobinopathies Market size. Clear representation of competitive analysis of key players by product, price, financial position, product portfolio, growth strategies, and regional presence in the Global Local Anesthesia Drugs Market make the report investor’s guide.
Global Local Anesthesia Drugs Market Scope: Inquire before buying
| Global Local Anesthesia Drugs Market | |||
|---|---|---|---|
| Report Coverage | Details | ||
| Base Year: | 2025 | Forecast Period: | 2026-2032 |
| Historical Data: | 2020 to 2025 | Market Size in 2025: | 3.21 USD Billion |
| Forecast Period 2026-2032 CAGR: | 4.9% | Market Size in 2032: | 4.49 USD Billion |
| Segments Covered: | by Drug Type | Bupivacaine Ropivacaine Lidocaine Chloroprocaine Prilocaine Benzocaine Others |
|
| By Formulation | Liquid Gel Spray Patch Others |
||
| by Application | Injectable Topical anesthetics |
||
| by End-Users | Hospitals Ambulatory Surgical Centers Dental Clinics Diagnostic Centers Specialty Clinics (ENT, Ophthalmology, Orthopedic) Home Care Settings Others |
||
Global Local Anesthesia Drugs Market, by Region
• North America
• Europe
• Asia Pacific
• Middle East and Africa
• South America
Global Local Anesthesia Drugs Market Key Players
- Johnson & Johnson Services, Inc.
- Pfizer Inc.
- Fresenius Kabi
- Aspen Pharmacare Holdings Limited
- Novartis AG
- Teva Pharmaceutical Industries Ltd.
- GlaxoSmithKline plc
- Sanofi S.A.
- Merck & Co., Inc.
- Pacira BioSciences, Inc.
- Braun Melsungen AG
- Septodont Holding
- Viatris Inc.
- AbbVie Inc.
- Baxter International Inc.
- Hikma Pharmaceuticals PLC
- Glenmark Pharmaceuticals Ltd.
- Akorn Operating Company LLC
- Endo International plc
- Laboratoires Théa SAS
- Luye Pharma Group
- Nichii-Iko Pharmaceutical Co., Ltd.
- Heron Therapeutics, Inc.
- Sintetica SA
- Zydus Lifesciences Ltd.
- Piramal Pharma Ltd.
- Sagent Pharmaceuticals
- Aguettant
- Amphastar Pharmaceuticals, Inc.
- Sun Pharmaceutical Industries Ltd.
Frequently Asked Questions:
1. Which region has the largest share in Global Local Anesthesia Drugs Market?
Ans: North America region held the highest share in 2025.
2. What is the growth rate of Global Local Anesthesia Drugs Market?
Ans: The Global Local Anesthesia Drugs Market is growing at a CAGR of 4.9% during forecasting period 2026-2032.
3. What is scope of the Global Local Anesthesia Drugs market report?
Ans: Global Local Anesthesia Drugs Market report helps with the PESTEL, PORTER, COVID-19 Impact analysis, Recommendations for Investors & Leaders, and market estimation of the forecast period.
4. Who are the key players in Global Local Anesthesia Drugs market?
Ans: The important key players in the Global Local Anesthesia Drugs Market are – Fresenius Kabi USA, LLC, Pfizer Inc., Advanced Pharma, Inc., Akorn, Inc., Teva Pharmaceutical Industries Ltd., Glenmark Pharmaceuticals, Inc., Baxter International Inc., Novartis AG., Aspen Pharmacare, Fresenius Kabi, Sagent Pharmaceutical, Pacira Pharmaceutical, Mylan, Teva Pharmaceuticals, and Other
5. What is the study period of this market?
Ans: The Global Local Anesthesia Drugs Market is studied from 2025 to 2032.
Table of Contents
To know about the Research Methodology :- Request Free Sample Report
Global Local Anesthesia Drugs Market Overview
Local anesthesia is a slight loss of feeling in a particular part of the body or localized areas. These medications are administered to cure painful situations, exclusion of pain even when executing any major or minor surgeries, or also to minimize pain post-surgery. Several medications are being used as local aesthetic at higher amounts. A local anesthetic can be injected into the spot or absorbed through the skin. When a large area needs to be anesthetized or drugs that may not penetrate enough for this doctor me choose different anesthesia and last for usually 4 to 6 hours. Local anesthesia allows a person to be awake or sedated, depending on the situation. Local anesthesia has a short duration and is frequently used for minor outpatient procedures (when a patient comes in for surgery and goes home on the same day). The Application of anesthesia used for the surgery is determined by many factors, such as the duration and Application of surgery, the health of the patient, and the preferences of the surgeon and the patient. In the next few years, the local anesthetics market is expected to grow by an average of 04 %.Global Local Anesthesia Drugs Market Dynamics
Increased demand for post-surgery pain relief is fueling the market growth of the local anesthesia drugs. Due to the increased number of surgery across various parts of the world, this trend is expected to continue throughout the projected timeframe, impacting the ever-growing demand for local anesthesia drugs. Most of the surgeries performed require treatments post-surgery. The older generation is more vulnerable to conditions such as heart attacks and blockage of arteries, respiratory disease, brain conditions, and several other health issues. A rise in the technology advancements and logistics for delivery of drugs such as Air ambulance and green corridors are also estimated to drive the demand for local anesthetics The growth of the market is also boosted by the arrival and usage of effective drugs such as articaine, levobupivacaine, and ropivacaine. Increase in the spending in the healthcare sector by the developing countries around the world such as India, China, and Brazil, where with time number of surgical procedures performed are increasing steadily. Moreover, Spike in the proportion of surgical procedures worldwide like oral surgery, plastic surgery, breast implants, lip surgery are also some major factors driving the local anesthetics market. However, Pain at injection, needle fracture, prolongation of anesthesia and multiple temporal disorders, lack of influence, trismus, inflammation, edoema, hematoma, gingival lesions, skin injury, and ophthalmic complications are commonly observed complications that may restraint market from growing.Global Local Anesthesia Drugs Market Segment Analysis
By Drug Type, the segment of Bupivacaine which is a local anesthetic used during a variety of surgical procedures is dominating the market. This assists in the blockage of sensory receptors that send pain signals to the brain. Hernia repairs, hip replacement, knee replacement, gall bladder removal, and tonsillectomies are the most common surgical procedures. Because of its effectiveness in inducing target organs, bupivacaine is commonly included in local anesthesia. As a result of the rising number of surgeries, there is a high demand for local anesthesia drugs, which is anticipated to accelerate the market's growth. As per the Royal College of Surgeons, there was 5 Mn admission for surgeries in the UK in 2003-04. By the year 2013-14, there has been 27% increase has been noted in the admission of surgical patients in the country. By Application, the segment of injectable anesthetics segment dominated the market in terms of revenue & sales, and this growth is projected to continue during the forecast timeframe. This is primarily due to the widespread use of injectable anesthetics in various surgical procedures. Injectable anesthetics are usually used for numbing instead of pain control throughout processes. Dental work such as a root canal, skin biopsy, removal of growth under your skin, removal of a mole or deep wart, and mole or deep wart removal insertion are all practices that may require a local anesthesia injection. The segment of topical anesthetic is also witnessing an upsurge in the market due to its increased use and benefits. Topical anesthetics are applied directly to the skin or mucosal tissue of the body, like the inside of the mouth, nose, or throat. They can also be used on the surface of the eye. Topical anesthetics are available in liquids, creams, gels, sprays, and patches. Applying or removing stitches, anything involving a needle poke, IV insertion, catheter insertion, laser treatments, cataract surgery, and endoscopy are all procedures that may require topical anesthesia.Global Local Anesthesia Drugs Market Regional Insights:
North America is dominating the global-local anesthesia market in the world as of 2019 due to an increase in the number of surgeries in old-aged people. The development of new anesthesia technologies for the administration and the rise of chronic diseases among older people fueled the market growth. The US anesthesia is the largest market share in the world. Major Key Players in the region with adequate investment in research and development for the production of innovative novel drugs are the key factor in the growth of the market in the region. The region contributes to 25% of global surgeries performed According to the United States Census Bureau, the total number of people aged 65 and older in the United States surpassed 45 million in 2017, and the population of older people is estimated to rise by approximately 17 million by 2030
The Asia Pacific is the second largest growing region in the world. This is due to rise in the dental and cosmetic surgeries, advancement in surgical procedures, and increased use of local anesthesia are fueling the market growth. Rise in healthcare and Investment in R&D by key players such. Ongoing pandemics bolstered the local anesthesia drug market due to an increase in the number of old-aged patients in the region. Especially in India. The overall increased number of surgeries performed has a significant effect on the Asia-Pacific anesthesia drugs market, as anesthetic medications are being used in surgical procedures to reduce pain. The elderly population is primed for chronic illnesses, which is leading to an increase in dependency on surgeries and therapies
European and South American regions are also witnessing substantial growth in the market mainly due to the increase of surgeries in old-aged people and the availability of anesthesia in the region. An increase in the number of patients in the region due to an increase in the population is propelling the market. England, Italy, and France are dominating the market in the region. In Europe, the number of surgeries performed is increasing. The rise in the number of surgeries performed has a significant effect on the anesthesia market.
The objective of the report is to present a comprehensive analysis of the Global Local Anesthesia Drugs Market to the stakeholders in the industry. The past and current status of the industry with the forecasted market size and trends are presented in the report with the analysis of complicated data in simple language. The report covers all the aspects of the industry with a dedicated study of key players that include market leaders, followers, and new entrants.
PORTER, SVOR, PESTEL analysis with the potential impact of micro-economic factors of the market have been presented in the report. External as well as internal factors that are supposed to affect the business positively or negatively have been analyzed, which will give a clear futuristic view of the industry to the decision-makers.
The report also helps in understanding the Global Local Anesthesia Drugs Market dynamics, structure by analyzing the market segments and project the Global Hemoglobinopathies Market size. Clear representation of competitive analysis of key players by product, price, financial position, product portfolio, growth strategies, and regional presence in the Global Local Anesthesia Drugs Market make the report investor’s guide.
Global Local Anesthesia Drugs Market Scope: Inquire before buying
| Global Local Anesthesia Drugs Market | |||
|---|---|---|---|
| Report Coverage | Details | ||
| Base Year: | 2025 | Forecast Period: | 2026-2032 |
| Historical Data: | 2020 to 2025 | Market Size in 2025: | 3.21 USD Billion |
| Forecast Period 2026-2032 CAGR: | 4.9% | Market Size in 2032: | 4.49 USD Billion |
| Segments Covered: | by Drug Type | Bupivacaine Ropivacaine Lidocaine Chloroprocaine Prilocaine Benzocaine Others | |
| By Formulation | Liquid Gel Spray Patch Others | ||
| by Application | Injectable Topical anesthetics | ||
| by End-Users | Hospitals Ambulatory Surgical Centers Dental Clinics Diagnostic Centers Specialty Clinics (ENT, Ophthalmology, Orthopedic) Home Care Settings Others | ||
Global Local Anesthesia Drugs Market, by Region
• North America • Europe • Asia Pacific • Middle East and Africa • South AmericaGlobal Local Anesthesia Drugs Market Key Players
- Johnson & Johnson Services, Inc.
- Pfizer Inc.
- Fresenius Kabi
- Aspen Pharmacare Holdings Limited
- Novartis AG
- Teva Pharmaceutical Industries Ltd.
- GlaxoSmithKline plc
- Sanofi S.A.
- Merck & Co., Inc.
- Pacira BioSciences, Inc.
- Braun Melsungen AG
- Septodont Holding
- Viatris Inc.
- AbbVie Inc.
- Baxter International Inc.
- Hikma Pharmaceuticals PLC
- Glenmark Pharmaceuticals Ltd.
- Akorn Operating Company LLC
- Endo International plc
- Laboratoires Théa SAS
- Luye Pharma Group
- Nichii-Iko Pharmaceutical Co., Ltd.
- Heron Therapeutics, Inc.
- Sintetica SA
- Zydus Lifesciences Ltd.
- Piramal Pharma Ltd.
- Sagent Pharmaceuticals
- Aguettant
- Amphastar Pharmaceuticals, Inc.
- Sun Pharmaceutical Industries Ltd.