
Europe Positive Material Identification Market by Offering, Technique, Form Factor, Industry, - Market Size Estimation, Industry-Wide Analysis, Competitive Landscape Assessment & Long-Term Forecast to 2026
Overview
Europe Positive Material Identification Market is expected to grow at a CAGR of 8.05% during the forecast period. Europe Positive Material Identification Market is expected to reach US$ 1.83 Bn. by2026.
Thanks to the increase in oil and gas refineries and automotive industry development in developed & developing economies in Europe. Also, the focus on optimizing the cost of production is further expected to drive the market during 2019-2027.
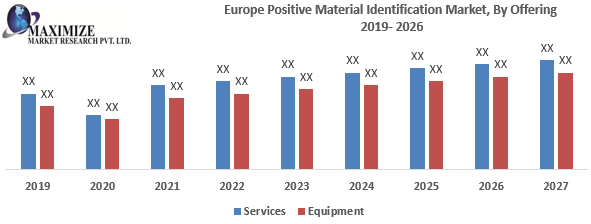
In Europe, equipment segment was valued € xxx.17 Mn in 2019 and is expected to reach € xxx.42 Mn by 2027 at a CAGR of 6.06% over the forecast period. However, the services segment is expected to grow at the largest CAGR of 6.92% during the forecast period owing to the preference to outsource PMI testing and inspection services to third-party service.
To know about the Research Methodology :- Request Free Sample Report
The report study has analyzed revenue impact of COVID -19 pandemic on the sales revenue of market leaders, market followers and market disrupters in the report and same is reflected in our analysis.
Based on the industry the market is segmented into aerospace & defense, oil & gas, metals & heavy machinery, infrastructure, automotive, scrap recycling, chemicals power generation pharmaceutical. Among these, the oil & gas industry segment is projected to reach € xxx.93 Mn by 2027. In the oil & gas industry, PMI helps in controlling, monitoring, and further tracking many incidents in the oil & gas handling industries like property damage, pipe leakage incurable accidents, and replacements etc. The growth of the Europe Oil and Gas Industry is anticipated to observe a moderate phase, with various efforts initiated by governments across the region by framing energy policies that are encouraging the movement towards alternative & clean energy solutions. The targets of achieving the Sustainable Development Goals adopted by the United Nations in September 2015 is pushing the nations in the region to reduce the consumption of fossil fuels & work on producing alternative sources of energy by achieving the targets set by UN by 2030. In Europe, the automotive industry is expected to grow at the largest CAGR of 7.20% during the forecast period. The demand for the automotive industry in this region is estimated to grow by 2023, which would result in the need to upsurge the manufacturing of vehicles.
By technique, X-Ray Fluorescence (XRF) accounted for the largest market share in 2019, with a market value of € xxx.70 Mn; the regional market is expected to register a CAGR of 6.46 % during 2019-2027. XRF is a widely preferred analytical technique for PMI thanks to the portability of XRF analyzers. This analyzer is highly suitable for liquids, solids, and powders. XRF analyzers are extensively used and mainly referred to as a rapid characterization tool in various analytical labs across the forensics, metallurgy, polymers, environmental analysis, archaeology, electronics, and mining applications, among others.
Germany Positive Material Identification Market is expected to grow at 7.39% CAGR to be valued at € xxx.70 million by 2027. Germany is a prominent exporter to several countries around the world this has led to the rise in the TIC services in the country to ensure compliance of the exported materials with the international standards. The U.K. was valued € xx.54 million in 2019 and is expected to reach € xxx.46 million by 2027 at a CAGR of 7.05% over the forecast period. The market is witnessing growth due to high paced infrastructural developments in emerging economies such as Russia, Italy, and France and high growth rate witnessed by the automotive and oil & gas industry.
Companies such as Hitachi, Niton, Ametek and others are involved in adopting sustainable strategies to gain competitive edges such as new product launch, product up-gradation and collaborative agreements. The objective of the MMR report is to present the overall picture of the Europe Positive Material Identification Market. The past, present and the estimated future market is presented with the help of complicated data and its precise analysis in a lucid language. All the aspects of the market have been covered in this report such as drivers, restraints, trends, and competitive landscape..
Some of the key players of the Europe Positive Material Identification market include:
• Shawkor
• Niton
• Sandberg LLP
• PTS Group
• Ametek
• Intertek
• Acuren
• TSI Incorporated
• Hitachi
• ARMI
• Scotia NDT Services ltd
• Waste Management Services
• SISA Inspection (Pty) Ltd
• APPLIED INSPECTION LIMITED
• Scotia NDT Services ltd
Europe Positive Material Identification Market Key Target Audience:
• PMI testing equipment rental providers
• Raw material and component providers
• Original equipment manufacturers (OEMs)
• End-users/enterprise-users
• Research institutes and organizations
• Government bodies, venture capitalists, and private equity firms
• Market research and consulting firms
• Enterprise data centre professionals
The scope of the Europe Positive Material Identification Market: Inquire before buying
The research report segments Europe Positive Material Identification market based on technique, form factor, offering, industry, and geography.
Europe Positive Material Identification Market, By Offering:
• Services
• Equipment
Europe Positive Material Identification Market, By Technique:
• Optical Emission Spectrometry (OES)
• X-Ray Fluorescence (XRF)
Europe Positive Material Identification Market, By Form Factor:
• Benchtop Analyzers
• Portable Analyzers
Europe Positive Material Identification Market, By Industry:
• Aerospace & Defense
• Oil & Gas
• Metals & Heavy Machinery
• Infrastructure
• Automotive
• Scrap Recycling
• Chemicals
• Power Generation
• Pharmaceutical
Europe Positive Material Identification Market, By Geography
• Europe
• UK
• Germany
• Italy
• France
• Russia
• Spain
• Others
Europe Positive Material Identification Market Geographic Analysis
• Breakdown of UK Positive Material Identification market
• Breakdown of Germany Positive Material Identification market
• Breakdown of Italy Positive Material Identification market
• Breakdown of France Positive Material Identification market
• Breakdown of Russia Positive Material Identification market
• Breakdown of Spain Positive Material Identification market
• Breakdown of Others Positive Material Identification market
Available Customizations
Maximize Market Research offers customizations of reports according to the specific requirement of our clients