Electric Ship Market: Global System Categories Analysis and Forecast (2023 -2029)

Global Electric Ship Market size was valued at USD 6.80 Bn. in 2022 and the total Electric Ship revenue is expected to grow by 13.3 % from 2023 to 2029, reaching nearly USD 16.30 Bn.

Electric Ship Market Overview:

An electric ship is an electric vehicle designed to carry out maritime activities by batteries rather than gasoline. The batteries of the electric boat are like the batteries of the electric automobile. Electric boats are generally ferry boats and small boats that sail with electricity mostly on interior rivers. Since 2015, Norway has operated the first electric boat on the globe on a regularly scheduled basis. The need for the reduction of carbon footprints as well as lower fuel wastage is increasing which led to the need for an electrically operated marine vessel. The focus of shipbuilders on reducing the noise generated by the marine vessel propulsion system is increasing the growth of the electric vessel market. Electric Ship Market
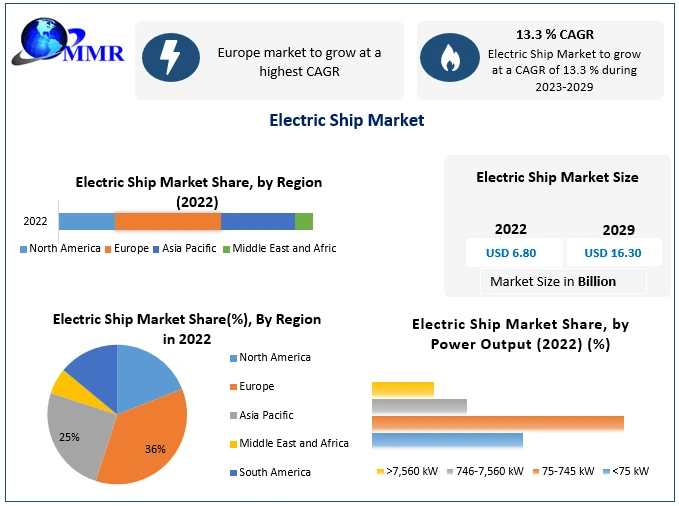
To know about the Research Methodology :- Request Free Sample Report

Electric Ship Market Dynamics

Electric ship demand fell after the introduction of fuel-powered ships, but governments are focusing on innovation, resulting in an increase in the usage of electric ships. These ships are designed to save money on fuel and reduce greenhouse gas emissions. This is driving the market's growth during the forecast period. The carbon footprint left by the international shipping industry has been well-known in recent years. According to research by the International Marine Organization, the maritime industry emits 940 million tons of CO2 each year, accounting for 2.5 percent to 3% of global greenhouse gas emissions which increases the demand of the bulk shipping market. Shipping emits 18 to 30 percent of total nitrogen oxide emissions in the atmosphere. As a result, ships are one of the most significant causes of pollution in seaports. Thus, the manufacturers have been developing several alternatives to replace fossil fuels, including electric ships powered by lithium-ion batteries and hence which boosts the connected ship market. As a result of the growing demand for such boats, electric vehicle manufacturers, and the cargo shipping market are expected to increase as the production of electric boats, therefore boosting the market growth. In addition, increased global seaborne trade, the development of lithium-ion batteries, and hybrid and electric propulsion technologies cater to the upgrade market. The widespread deployment of completely electric passenger ships and inland freight ships, among others, is expected to propel the electric boat and ship market forward across the globe.

Electric Ship Market Segmentation Analysis

Based on the Power Source The power source segment is classified into two sub-segments, fully electric and hybrid. The hybrid segment led the market with an 81.4 percent share, and this trend is expected to continue throughout the forecast period. The utilization of extra propulsion systems and faster speeds, which can minimize the danger of failure and cover longer distances in less time, are driving the demand for hybrid electric ships. Because it is less expensive than acquiring a new ship, ship owners prefer to refit boats with hybrid-electric or fully electric propulsion systems. The advantages of hybrid electric ships offer reliability owing to the use of a supplementary propulsion system and higher speed which reduces the risk of failure and covers greater distances in less time. The fully electric segment is expected to increase the demand during the forecast period.Electric Ship Market1Based on Vessel Type The commercial vessel segment dominated the market in the year 2022 with 67% of revenue share and is expected to dominate the market during the forecast period. Growth in marine logistics necessitates the hiring of more sailors, increasing the logistics service providers' operational expenses. The deployment of automated systems in commercial ships is likely to be fueled by rising competition among logistics service providers and the adoption of a competitive pricing approach. The defense vessel type segment is expected to increase its demand during the forecast period. The advantages of these ships are they reduce the acoustic signature and enable quieter operations making them highly suitable for missions where avoiding detection is paramount.Electric Ship Market2

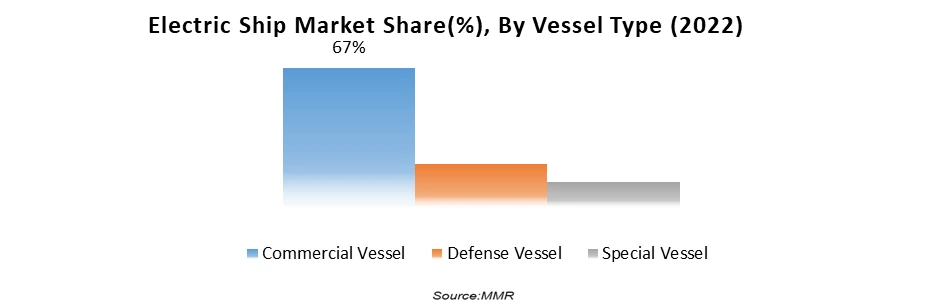
Electric Ship Market Regional Insights:

Europe region dominated the market with the largest share of over 36 percent, and it is expected to dominate the market throughout the forecast period. Because of the huge number of original component manufacturers and original equipment manufacturers in the region, such as Norwegian Electric Systems AS, Vard, and others, the market is highly competitive. Due to growing environmental consciousness among the general public and government measures to encourage electrically-driven transportation modes, Germany has emerged as a key contributor to market growth in Europe. Furthermore, the rising popularity of electric recreational and leisure vessels in the region's marine tourism, aquatic adventures, and fishing activities is expected to drive the shipping container market. However, market growth is expected to be aided by increased awareness campaigns regarding the detrimental impacts of marine pollutants, particularly in Hamburg and Rotterdam. The Asia Pacific is expected to emerge as the second fastest-growing regional market Because of continuous regulatory reforms in China and Japan, such as the worldwide Sulphur cap to boost electrification in large-sized vessels. Strong economic growth combined with strong manufacturing numbers is expected to help the region maintain its status as a global industrial powerhouse. As a result, the growing number of ships in the Asia Pacific region, as well as the region's maritime sector, is expected to have a positive influence on the market for electric ships.Electric Ship Market3
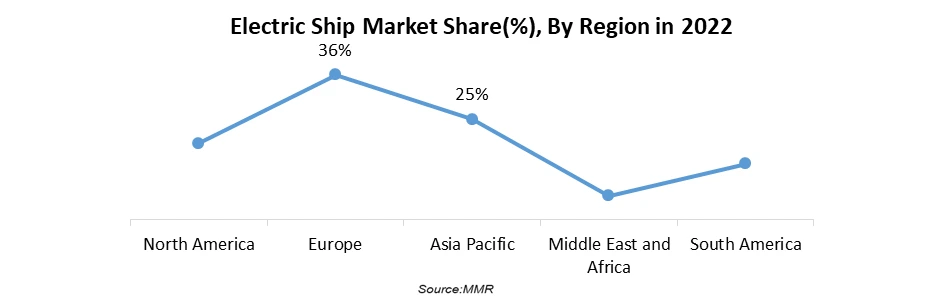
The objective of the report is to present a comprehensive analysis of the Electric Ship Market including all the stakeholders of the Application. The past and current status of the Application with forecasted market size and trends are presented in the report with the analysis of complicated data in simple language. The report covers all the aspects of the Application with a dedicated study of key players that includes market leaders, followers, and new entrants by region. PORTER, SVOR, and PESTEL analysis with the potential impact of micro-economic factors by region on the market have been presented in the report. External as well as internal factors that are supposed to affect the business positively or negatively have been analyzed, which will give a clear futuristic view of the Application to the decision-makers. The report also helps in understanding the Electric Ship Market dynamics, and structure by analyzing the market segments and projecting the Electric Ship Market size. Clear representation of competitive analysis of key players by type, price, financial position, System portfolio, growth strategies, and regional presence in the Electric Ship Market makes the report an investor’s guide.

Electric Ship Market Scope: Inquire before buying

Electric Ship Market
Report Coverage Details
Base Year: 2022 Forecast Period: 2023-2029
Historical Data: 2018 to 2022 Market Size in 2022: US $ 6.80 Bn.
Forecast Period 2023 to 2029 CAGR: 13.3% Market Size in 2029: US $ 16.30 Bn.
Segments Covered: by Power Source Fully Electric Hybrid
by Power Output <75 kW 75-745 kW 746-7,560 kW >7,560 kW
by Autonomy Level Semi-Autonomous Fully Autonomous
by Vessel Type Commercial Vessel Defense Vessel Special Vessel

Electric Ship Market, by Region

North America (United States, Canada and Mexico) Europe (UK, France, Germany, Italy, Spain, Sweden, Austria and Rest of Europe) Asia Pacific (China, South Korea, Japan, India, Australia, Indonesia, Malaysia, Vietnam, Taiwan, Bangladesh, Pakistan and Rest of APAC) Middle East and Africa (South Africa, GCC, Egypt, Nigeria and Rest of ME&A) South America (razil, Argentina Rest of South America)

Key Players:

1. BoeschMotorboote 2. Bureau Veritas 3. Vision Marine Technologies 4. Corvus Energy Ltd. 5. YaraBirkeland 6. Duffy Electric Boat 7. General Dynamics (Electric Boat) 8. Kongsberg Gruppen ASA 9. Electrovaya Inc. 10 Triton Submarines 11 Vard (FINCANTIERI S.p.A. 12 Baltic Workboats AS 13 Norwegian Electric Systems AS 14 General Dynamics Electric Boat 15 MAN Energy Solutions SE 16 Vard Frequently Asked Questions 1] What segments are covered in the Global Electric Ship Market report? Ans. The segments covered in the Electric Ship Market report are based on Power Source, Power Output, Autonomy Level, Vessel Type, and Region 2] Which region is expected to hold the highest share of the Global Electric Ship Market? Ans. The European region is expected to hold the highest share of the Electric Ship Market. Germany has emerged as a key contributor to market growth in Europe 3] What is the market size of the Global Electric Ship Market by 2029? Ans. The market size of the Electric Ship Market by 2029 is expected to reach US$ 16.30 Bn 4] What is the forecast period for the Global Electric Ship Market? Ans. The forecast period for the Electric Ship Market is 2023-2029 5] What was the market size of the Global Electric Ship Market in 2022? Ans. The market size of the Electric Ship Market in 2022 was valued at US$ 6.80 Bn.
1. Electric Ship Market: Research Methodology 2. Electric Ship Market Introduction 2.1. Study Assumption and Market Definition 2.2. Scope of the Study 2.3. Executive Summary 3. Electric Ship Market: Dynamics 3.1. Electric Ship Market Trends by Region 3.1.1. North America Electric Ship Market Trends 3.1.2. Europe Electric Ship Market Trends 3.1.3. Asia Pacific Electric Ship Market Trends 3.1.4. Middle East and Africa Electric Ship Market Trends 3.1.5. South America Electric Ship Market Trends 3.2. Electric Ship Market Dynamics by Region 3.2.1. North America 3.2.1.1. North America Electric Ship Market Drivers 3.2.1.2. North America Electric Ship Market Restraints 3.2.1.3. North America Electric Ship Market Opportunities 3.2.1.4. North America Electric Ship Market Challenges 3.2.2. Europe 3.2.2.1. Europe Electric Ship Market Drivers 3.2.2.2. Europe Electric Ship Market Restraints 3.2.2.3. Europe Electric Ship Market Opportunities 3.2.2.4. Europe Electric Ship Market Challenges 3.2.3. Asia Pacific 3.2.3.1. Asia Pacific Electric Ship Market Drivers 3.2.3.2. Asia Pacific Electric Ship Market Restraints 3.2.3.3. Asia Pacific Electric Ship Market Opportunities 3.2.3.4. Asia Pacific Electric Ship Market Challenges 3.2.4. Middle East and Africa 3.2.4.1. Middle East and Africa Electric Ship Market Drivers 3.2.4.2. Middle East and Africa Electric Ship Market Restraints 3.2.4.3. Middle East and Africa Electric Ship Market Opportunities 3.2.4.4. Middle East and Africa Electric Ship Market Challenges 3.2.5. South America 3.2.5.1. South America Electric Ship Market Drivers 3.2.5.2. South America Electric Ship Market Restraints 3.2.5.3. South America Electric Ship Market Opportunities 3.2.5.4. South America Electric Ship Market Challenges 3.3. PORTER’s Five Forces Analysis 3.4. PESTLE Analysis 3.5. Technology Roadmap 3.6. Regulatory Landscape by Region 3.6.1. North America 3.6.2. Europe 3.6.3. Asia Pacific 3.6.4. Middle East and Africa 3.6.5. South America 3.7. Key Opinion Leader Analysis For Electric Ship Market 3.8. Analysis of Government Schemes and Initiatives For Electric Ship Market 3.9. The Global Pandemic Impact on Electric Ship Market 4. Electric Ship Market: Global Market Size and Forecast by Segmentation by Demand and Supply Side (by Value in USD Million and Volume in Units) (2022-2029) 4.1. Electric Ship Market Size and Forecast, By Power Source (2022-2029) 4.1.1. Fully Electric 4.1.2. Hybrid 4.2. Electric Ship Market Size and Forecast, by Power Output (2022-2029) 4.2.1. <75 kW 4.2.2. 75-745 kW 4.2.3. 746-7,560 kW 4.2.4. >7,560 kW 4.3. Electric Ship Market Size and Forecast, By Autonomy Level (2022-2029) 4.3.1. Semi-Autonomous 4.3.2. Fully Autonomous 4.4. Electric Ship Market Size and Forecast, By Vessel Type (2022-2029) 4.4.1. Commercial Vessel 4.4.2. Defense Vessel 4.4.3. Special Vessel 4.5. Electric Ship Market Size and Forecast, by Region (2022-2029) 4.5.1. North America 4.5.2. Europe 4.5.3. Asia Pacific 4.5.4. Middle East and Africa 4.5.5. South America 5. North America Electric Ship Market Size and Forecast by Segmentation by Demand and Supply Side (by Value in USD Million and Volume in Units) (2022-2029) 5.1. North America Electric Ship Market Size and Forecast, By Power Source (2022-2029) 5.1.1. Fully Electric 5.1.2. Hybrid 5.2. North America Electric Ship Market Size and Forecast, by Power Output (2022-2029) 5.2.1. <75 kW 5.2.2. 75-745 kW 5.2.3. 746-7,560 kW 5.2.4. >7,560 kW 5.3. North America Electric Ship Market Size and Forecast, By Autonomy Level (2022-2029) 5.3.1. Semi-Autonomous 5.3.2. Fully Autonomous 5.4. North America Electric Ship Market Size and Forecast, By Vessel Type (2022-2029) 5.4.1. Commercial Vessel 5.4.2. Defense Vessel 5.4.3. Special Vessel 5.5. North America Electric Ship Market Size and Forecast, by Country (2022-2029) 5.5.1. United States 5.5.1.1. United States Electric Ship Market Size and Forecast, By Power Source (2022-2029) 5.5.1.1.1. Fully Electric 5.5.1.1.2. Hybrid 5.5.1.2. United States Electric Ship Market Size and Forecast, by Power Output (2022-2029) 5.5.1.2.1. <75 kW 5.5.1.2.2. 75-745 kW 5.5.1.2.3. 746-7,560 kW 5.5.1.2.4. >7,560 kW 5.5.1.3. United States Electric Ship Market Size and Forecast, By Autonomy Level (2022-2029) 5.5.1.3.1. Semi-Autonomous 5.5.1.3.2. Fully Autonomous 5.5.1.4. United States Electric Ship Market Size and Forecast, By Vessel Type (2022-2029) 5.5.1.4.1. Commercial Vessel 5.5.1.4.2. Defense Vessel 5.5.1.4.3. Special Vessel 5.5.2. Canada 5.5.2.1. Canada Electric Ship Market Size and Forecast, By Power Source (2022-2029) 5.5.2.1.1. Fully Electric 5.5.2.1.2. Hybrid 5.5.2.2. Canada Electric Ship Market Size and Forecast, by Power Output (2022-2029) 5.5.2.2.1. <75 kW 5.5.2.2.2. 75-745 kW 5.5.2.2.3. 746-7,560 kW 5.5.2.2.4. >7,560 kW 5.5.2.3. Canada Electric Ship Market Size and Forecast, By Autonomy Level (2022-2029) 5.5.2.3.1. Semi-Autonomous 5.5.2.3.2. Fully Autonomous 5.5.2.4. Canada Electric Ship Market Size and Forecast, By Vessel Type (2022-2029) 5.5.2.4.1. Commercial Vessel 5.5.2.4.2. Defense Vessel 5.5.2.4.3. Special Vessel 5.5.3. Mexico 5.5.3.1. Mexico Electric Ship Market Size and Forecast, By Power Source (2022-2029) 5.5.3.1.1. Fully Electric 5.5.3.1.2. Hybrid 5.5.3.2. Mexico Electric Ship Market Size and Forecast, by Power Output (2022-2029) 5.5.3.2.1. <75 kW 5.5.3.2.2. 75-745 kW 5.5.3.2.3. 746-7,560 kW 5.5.3.2.4. >7,560 kW 5.5.3.3. Mexico Electric Ship Market Size and Forecast, By Autonomy Level (2022-2029) 5.5.3.3.1. Semi-Autonomous 5.5.3.3.2. Fully Autonomous 5.5.3.4. Mexico Electric Ship Market Size and Forecast, By Vessel Type (2022-2029) 5.5.3.4.1. Commercial Vessel 5.5.3.4.2. Defense Vessel 5.5.3.4.3. Special Vessel 6. Europe Electric Ship Market Size and Forecast by Segmentation by Demand and Supply Side (by Value in USD Million and Volume in Units) (2022-2029) 6.1. Europe Electric Ship Market Size and Forecast, By Power Source (2022-2029) 6.2. Europe Electric Ship Market Size and Forecast, by Power Output (2022-2029) 6.3. Europe Electric Ship Market Size and Forecast, By Autonomy Level (2022-2029) 6.4. Europe Electric Ship Market Size and Forecast, By Vessel Type (2022-2029) 6.5. Europe Electric Ship Market Size and Forecast, by Country (2022-2029) 6.5.1. United Kingdom 6.5.1.1. United Kingdom Electric Ship Market Size and Forecast, By Power Source (2022-2029) 6.5.1.2. United Kingdom Electric Ship Market Size and Forecast, by Power Output (2022-2029) 6.5.1.3. United Kingdom Electric Ship Market Size and Forecast, By Autonomy Level (2022-2029) 6.5.1.4. United Kingdom Electric Ship Market Size and Forecast, By Vessel Type (2022-2029) 6.5.2. France 6.5.2.1. France Electric Ship Market Size and Forecast, By Power Source (2022-2029) 6.5.2.2. France Electric Ship Market Size and Forecast, by Power Output (2022-2029) 6.5.2.3. France Electric Ship Market Size and Forecast, By Autonomy Level (2022-2029) 6.5.2.4. France Electric Ship Market Size and Forecast, By Vessel Type (2022-2029) 6.5.3. Germany 6.5.3.1. Germany Electric Ship Market Size and Forecast, By Power Source (2022-2029) 6.5.3.2. Germany Electric Ship Market Size and Forecast, by Power Output (2022-2029) 6.5.3.3. Germany Electric Ship Market Size and Forecast, By Autonomy Level (2022-2029) 6.5.3.4. Germany Electric Ship Market Size and Forecast, By Vessel Type (2022-2029) 6.5.4. Italy 6.5.4.1. Italy Electric Ship Market Size and Forecast, By Power Source (2022-2029) 6.5.4.2. Italy Electric Ship Market Size and Forecast, by Power Output (2022-2029) 6.5.4.3. Italy Electric Ship Market Size and Forecast, By Autonomy Level (2022-2029) 6.5.4.4. Italy Electric Ship Market Size and Forecast, By Vessel Type (2022-2029) 6.5.5. Spain 6.5.5.1. Spain Electric Ship Market Size and Forecast, By Power Source (2022-2029) 6.5.5.2. Spain Electric Ship Market Size and Forecast, by Power Output (2022-2029) 6.5.5.3. Spain Electric Ship Market Size and Forecast, By Autonomy Level (2022-2029) 6.5.5.4. Spain Electric Ship Market Size and Forecast, By Vessel Type (2022-2029) 6.5.6. Sweden 6.5.6.1. Sweden Electric Ship Market Size and Forecast, By Power Source (2022-2029) 6.5.6.2. Sweden Electric Ship Market Size and Forecast, by Power Output (2022-2029) 6.5.6.3. Sweden Electric Ship Market Size and Forecast, By Autonomy Level (2022-2029) 6.5.6.4. Sweden Electric Ship Market Size and Forecast, By Vessel Type (2022-2029) 6.5.7. Austria 6.5.7.1. Austria Electric Ship Market Size and Forecast, By Power Source (2022-2029) 6.5.7.2. Austria Electric Ship Market Size and Forecast, by Power Output (2022-2029) 6.5.7.3. Austria Electric Ship Market Size and Forecast, By Autonomy Level (2022-2029) 6.5.7.4. Austria Electric Ship Market Size and Forecast, By Vessel Type (2022-2029) 6.5.8. Rest of Europe 6.5.8.1. Rest of Europe Electric Ship Market Size and Forecast, By Power Source (2022-2029) 6.5.8.2. Rest of Europe Electric Ship Market Size and Forecast, by Power Output (2022-2029) 6.5.8.3. Rest of Europe Electric Ship Market Size and Forecast, By Autonomy Level (2022-2029) 6.5.8.4. Rest of Europe Electric Ship Market Size and Forecast, By Vessel Type (2022-2029) 7. Asia Pacific Electric Ship Market Size and Forecast by Segmentation by Demand and Supply Side (by Value in USD Million and Volume in Units) (2022-2029) 7.1. Asia Pacific Electric Ship Market Size and Forecast, By Power Source (2022-2029) 7.2. Asia Pacific Electric Ship Market Size and Forecast, by Power Output (2022-2029) 7.3. Asia Pacific Electric Ship Market Size and Forecast, By Autonomy Level (2022-2029) 7.4. Asia Pacific Electric Ship Market Size and Forecast, By Vessel Type (2022-2029) 7.5. Asia Pacific Electric Ship Market Size and Forecast, by Country (2022-2029) 7.5.1. China 7.5.1.1. China Electric Ship Market Size and Forecast, By Power Source (2022-2029) 7.5.1.2. China Electric Ship Market Size and Forecast, by Power Output (2022-2029) 7.5.1.3. China Electric Ship Market Size and Forecast, By Autonomy Level (2022-2029) 7.5.1.4. China Electric Ship Market Size and Forecast, By Vessel Type (2022-2029) 7.5.2. S Korea 7.5.2.1. S Korea Electric Ship Market Size and Forecast, By Power Source (2022-2029) 7.5.2.2. S Korea Electric Ship Market Size and Forecast, by Power Output (2022-2029) 7.5.2.3. S Korea Electric Ship Market Size and Forecast, By Autonomy Level (2022-2029) 7.5.2.4. S Korea Electric Ship Market Size and Forecast, By Vessel Type (2022-2029) 7.5.3. Japan 7.5.3.1. Japan Electric Ship Market Size and Forecast, By Power Source (2022-2029) 7.5.3.2. Japan Electric Ship Market Size and Forecast, by Power Output (2022-2029) 7.5.3.3. Japan Electric Ship Market Size and Forecast, By Autonomy Level (2022-2029) 7.5.3.4. Japan Electric Ship Market Size and Forecast, By Vessel Type (2022-2029) 7.5.4. India 7.5.4.1. India Electric Ship Market Size and Forecast, By Power Source (2022-2029) 7.5.4.2. India Electric Ship Market Size and Forecast, by Power Output (2022-2029) 7.5.4.3. India Electric Ship Market Size and Forecast, By Autonomy Level (2022-2029) 7.5.4.4. India Electric Ship Market Size and Forecast, By Vessel Type (2022-2029) 7.5.5. Australia 7.5.5.1. Australia Electric Ship Market Size and Forecast, By Power Source (2022-2029) 7.5.5.2. Australia Electric Ship Market Size and Forecast, by Power Output (2022-2029) 7.5.5.3. Australia Electric Ship Market Size and Forecast, By Autonomy Level (2022-2029) 7.5.5.4. Australia Electric Ship Market Size and Forecast, By Vessel Type (2022-2029) 7.5.6. Indonesia 7.5.6.1. Indonesia Electric Ship Market Size and Forecast, By Power Source (2022-2029) 7.5.6.2. Indonesia Electric Ship Market Size and Forecast, by Power Output (2022-2029) 7.5.6.3. Indonesia Electric Ship Market Size and Forecast, By Autonomy Level (2022-2029) 7.5.6.4. Indonesia Electric Ship Market Size and Forecast, By Vessel Type (2022-2029) 7.5.7. Malaysia 7.5.7.1. Malaysia Electric Ship Market Size and Forecast, By Power Source (2022-2029) 7.5.7.2. Malaysia Electric Ship Market Size and Forecast, by Power Output (2022-2029) 7.5.7.3. Malaysia Electric Ship Market Size and Forecast, By Autonomy Level (2022-2029) 7.5.7.4. Malaysia Electric Ship Market Size and Forecast, By Vessel Type (2022-2029) 7.5.8. Vietnam 7.5.8.1. Vietnam Electric Ship Market Size and Forecast, By Power Source (2022-2029) 7.5.8.2. Vietnam Electric Ship Market Size and Forecast, by Power Output (2022-2029) 7.5.8.3. Vietnam Electric Ship Market Size and Forecast, By Autonomy Level (2022-2029) 7.5.8.4. Vietnam Electric Ship Market Size and Forecast, By Vessel Type (2022-2029) 7.5.9. Taiwan 7.5.9.1. Taiwan Electric Ship Market Size and Forecast, By Power Source (2022-2029) 7.5.9.2. Taiwan Electric Ship Market Size and Forecast, by Power Output (2022-2029) 7.5.9.3. Taiwan Electric Ship Market Size and Forecast, By Autonomy Level (2022-2029) 7.5.9.4. Taiwan Electric Ship Market Size and Forecast, By Vessel Type (2022-2029) 7.5.10. Rest of Asia Pacific 7.5.10.1. Rest of Asia Pacific Electric Ship Market Size and Forecast, By Power Source (2022-2029) 7.5.10.2. Rest of Asia Pacific Electric Ship Market Size and Forecast, by Power Output (2022-2029) 7.5.10.3. Rest of Asia Pacific Electric Ship Market Size and Forecast, By Autonomy Level (2022-2029) 7.5.10.4. Rest of Asia Pacific Electric Ship Market Size and Forecast, By Vessel Type (2022-2029) 8. Middle East and Africa Electric Ship Market Size and Forecast by Segmentation by Demand and Supply Side (by Value in USD Million and Volume in Units) (2022-2029 8.1. Middle East and Africa Electric Ship Market Size and Forecast, By Power Source (2022-2029) 8.2. Middle East and Africa Electric Ship Market Size and Forecast, by Power Output (2022-2029) 8.3. Middle East and Africa Electric Ship Market Size and Forecast, By Autonomy Level (2022-2029) 8.4. Middle East and Africa Electric Ship Market Size and Forecast, By Vessel Type (2022-2029) 8.5. Middle East and Africa Electric Ship Market Size and Forecast, by Country (2022-2029) 8.5.1. South Africa 8.5.1.1. South Africa Electric Ship Market Size and Forecast, By Power Source (2022-2029) 8.5.1.2. South Africa Electric Ship Market Size and Forecast, by Power Output (2022-2029) 8.5.1.3. South Africa Electric Ship Market Size and Forecast, By Autonomy Level (2022-2029) 8.5.1.4. South Africa Electric Ship Market Size and Forecast, By Vessel Type (2022-2029) 8.5.2. GCC 8.5.2.1. GCC Electric Ship Market Size and Forecast, By Power Source (2022-2029) 8.5.2.2. GCC Electric Ship Market Size and Forecast, by Power Output (2022-2029) 8.5.2.3. GCC Electric Ship Market Size and Forecast, By Autonomy Level (2022-2029) 8.5.2.4. GCC Electric Ship Market Size and Forecast, By Vessel Type (2022-2029) 8.5.3. Nigeria 8.5.3.1. Nigeria Electric Ship Market Size and Forecast, By Power Source (2022-2029) 8.5.3.2. Nigeria Electric Ship Market Size and Forecast, by Power Output (2022-2029) 8.5.3.3. Nigeria Electric Ship Market Size and Forecast, By Autonomy Level (2022-2029) 8.5.3.4. Nigeria Electric Ship Market Size and Forecast, By Vessel Type (2022-2029) 8.5.4. Rest of ME&A 8.5.4.1. Rest of ME&A Electric Ship Market Size and Forecast, By Power Source (2022-2029) 8.5.4.2. Rest of ME&A Electric Ship Market Size and Forecast, by Power Output (2022-2029) 8.5.4.3. Rest of ME&A Electric Ship Market Size and Forecast, By Autonomy Level (2022-2029) 8.5.4.4. Rest of ME&A Electric Ship Market Size and Forecast, By Vessel Type (2022-2029) 9. South America Electric Ship Market Size and Forecast by Segmentation by Demand and Supply Side (by Value in USD Million and Volume in Units) (2022-2029 9.1. South America Electric Ship Market Size and Forecast, By Power Source (2022-2029) 9.2. South America Electric Ship Market Size and Forecast, by Power Output (2022-2029) 9.3. South America Electric Ship Market Size and Forecast, By Autonomy Level (2022-2029) 9.4. South America Electric Ship Market Size and Forecast, By Vessel Type (2022-2029) 9.5. South America Electric Ship Market Size and Forecast, by Country (2022-2029) 9.5.1. Brazil 9.5.1.1. Brazil Electric Ship Market Size and Forecast, By Power Source (2022-2029) 9.5.1.2. Brazil Electric Ship Market Size and Forecast, by Power Output (2022-2029) 9.5.1.3. Brazil Electric Ship Market Size and Forecast, By Autonomy Level (2022-2029) 9.5.1.4. Brazil Electric Ship Market Size and Forecast, By Vessel Type (2022-2029) 9.5.2. Argentina 9.5.2.1. Argentina Electric Ship Market Size and Forecast, By Power Source (2022-2029) 9.5.2.2. Argentina Electric Ship Market Size and Forecast, by Power Output (2022-2029) 9.5.2.3. Argentina Electric Ship Market Size and Forecast, By Autonomy Level (2022-2029) 9.5.2.4. Argentina Electric Ship Market Size and Forecast, By Vessel Type (2022-2029) 9.5.3. Rest Of South America 9.5.3.1. Rest Of South America Electric Ship Market Size and Forecast, By Power Source (2022-2029) 9.5.3.2. Rest Of South America Electric Ship Market Size and Forecast, by Power Output (2022-2029) 9.5.3.3. Rest Of South America Electric Ship Market Size and Forecast, By Autonomy Level (2022-2029) 9.5.3.4. Rest Of South America Electric Ship Market Size and Forecast, By Vessel Type (2022-2029) 10. Global Electric Ship Market: Competitive Landscape 10.1. MMR Competition Matrix 10.2. Competitive Landscape 10.3. Key Players Benchmarking 10.3.1. Company Name 10.3.2. Service Segment 10.3.3. End-user Segment 10.3.4. Revenue (2022) 10.3.5. Company Locations 10.4. Leading Electric Ship Market Companies, by Market Capitalization 10.5. Market Structure 10.5.1. Market Leaders 10.5.2. Market Followers 10.5.3. Emerging Players 10.6. Mergers and Acquisitions Details 11. Company Profile: Key Players 11.1. BoeschMotorboote 11.1.1. Company Overview 11.1.2. Business Portfolio 11.1.3. Financial Overview 11.1.4. SWOT Analysis 11.1.5. Strategic Analysis 11.1.6. Scale of Operation (Small, Medium, and Large) 11.1.7. Details on Partnership 11.1.8. Regulatory Accreditations and Certifications Received by Them 11.1.9. Awards Received by the Firm 11.1.10. Recent Developments 11.2. Bureau Veritas 11.3. Vision Marine Technologies 11.4. Corvus Energy Ltd. 11.5. YaraBirkeland 11.6. Duffy Electric Boat 11.7. General Dynamics (Electric Boat) 11.8. Kongsberg Gruppen ASA 11.9. Electrovaya Inc. 11.10. Triton Submarines 11.11. Vard (FINCANTIERI S.p.A. 11.12. Baltic Workboats AS 11.13. Norwegian Electric Systems AS 11.14. General Dynamics Electric Boat 11.15. MAN Energy Solutions SE 11.16. Vard 12. Key Findings 13. Industry Recommendations 14. Terms and Glossary
  • INQUIRE BEFORE BUYING