
Corporate Travel Market Size, Share, Growth & Forecast (2025–2032): Industry Trends, ROI, Platform Disruption & Value Shift Analysis
Overview
The Global Corporate Travel Market is not a logistics category — it is the revenue-generation infrastructure of global business. Every client relationship sustained, every partnership forged, every deal closed across a table — has a flight, a hotel room, and a meeting behind it.
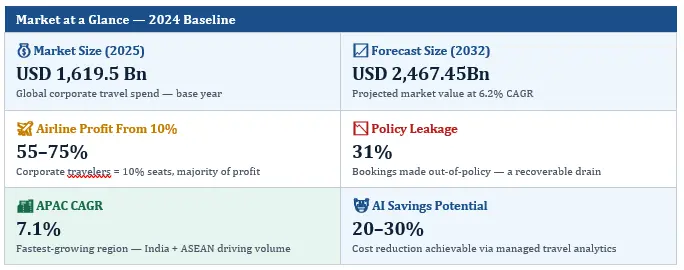
According to Maximize Market Research (MMR), the global Corporate Travel market was valued at USD 1,619.5 Billion in 2025 and is projected to reach USD 2,467.45 Billion by 2032, growing at a CAGR of 6.2% (2025–2032). This growth is not volume-led. It is driven by a multi-layered interaction of globalization, hybrid work realignment, AI-led optimization, ESG mandates, and the irreplaceable economics of face-to-face business interaction. What differentiates this market is not "growth" — but who captures value, who controls data, who absorbs cost, and where the margin pools are migrating.
The global corporate travel market plays a critical role in determining deal velocity, client engagement depth, and revenue generation across industries.. What makes this market strategically unusual is not its size — it is the disproportionate economic leverage it generates for every dollar spent wisely
This report is designed for corporate travel buyers, TMC executives, airline revenue strategists, hotel groups, technology platforms, and institutional investors seeking to understand where value is shifting in global corporate mobility economics. This corporate travel market analysis highlights key growth drivers, industry trends, competitive landscape, and future opportunities shaping the global business travel market.
To know about the Research Methodology :- Request Free Sample Report
Corporate Travel Market Spend Economics & Consumption Reality: The Core Engine
Globally in 2025, corporate travel spend exceeds USD 1.4 Trillion per year, making it the largest B2B service expenditure category in the world — ahead of IT services procurement in many industries. This is not discretionary spending. For most organizations, corporate travel is a strategic investment directly tied to revenue generation, client retention, and business development outcomes.
Why Spend Is Structurally Locked In (Key Highlights)
- 85% of executives say face-to-face meetings are more effective than video for complex deal closure
- Business travel = 12–15% of total corporate operating expenditure across most industries
- Airlines derive 55–75% of total profit from the ~10% of seats occupied by corporate travelers
- Hotels generate 30–40% of total revenue from corporate accounts despite lower room allocation
- Every 1% improvement in travel program efficiency saves USD 2–5M for a mid-large enterprise
| Corporate Travel Spend Breakdown — By Category (2025 Estimated) | |
| Air Travel (Fare+Ancillary) | ████████████████████████████████████ % 42 |
| Lodging & Accommodation | ██████████████████████████░░░░░░░░░░ % 30 |
| Ground Transportation | ██████████░░░░░░░░░░░░░░░░░░░░░░░░░░ % 12 |
| Dining & Entertainment | ███████░░░░░░░░░░░░░░░░░░░░░░░░░░░░░ % 8 |
| TMC Fees & Admin | ████░░░░░░░░░░░░░░░░░░░░░░░░░░░░░░░░ % 5 |
| Ancillary / Misc. | ███░░░░░░░░░░░░░░░░░░░░░░░░░░░░░░░░░ % 3 |
Key Economic Insights
Air travel dominates spend — but hotels drive margin leakage. 65% of out-of-policy spend occurs in accommodation and ground transport, where policy enforcement is weakest and platform fragmentation is highest. The real savings opportunity is not in airfare — it is in fixing the long tail.
Corporate Travel Market Segment Intelligence: Where the Real Profit Pools Exist
By Type (2025)
| Segment | Market Share | Value (USD Bn) | Forecast 2032 (USD Bn) | CAGR | Margin Intensity |
| Managed Corporate Travel | ~X% | 888.4 | 1,351.2 | 5.4% | High |
| Unmanaged Corporate Travel | ~X% | X | X | X% | Low–Medium |
Managed travel offers 20–30% savings vs unmanaged — yet 38% of global corporate spend remains unmanaged. This is not a demand problem. It is a product-market-fit problem. Most TMC solutions are built for enterprise complexity. The unmanaged middle is a USD 544 Billion addressable opportunity waiting for a lightweight, self-serve alternative.
By Purpose: Trip ROI Classification
| Trip Purpose | Volume Share | Revenue Impact | ROI Class | Virtual Substitutability |
| Client Meetings & Sales | ~28% | Very High | Revenue-Generating | 🔴 Low |
| MICE (Meetings, Incentives, Conf.) | ~X% | High | Revenue-Generating | 🟡 Medium |
| Internal Meetings & Training | ~20% | Low | Operational | 🟢 High |
| Project & Site Visits | ~X% | High | Operational | 🔴 Low |
| Trade Shows & Exhibitions | ~X% | Medium | Revenue-Generating | 🟡 Medium |
Strategic Takeway — The Trip ROI Matrix
Not all travel creates equal value. Internal meetings are structurally over-funded; client travel is under-protected. Companies applying a trip-ROI filter — approving only trips where virtual engagement demonstrably underdelivers — consistently achieve X% volume reduction with zero revenue impact.
Corporate Travel Market DROCT Framework: Strategic Market Forces
| Dimension | Key Forces | Market Impact |
| Drivers | Post-COVID relationship rebuilding; globalization & cross-border FDI; Asia Pacific economic expansion; ROI-proven face-to-face meetings | High |
| Restraints | Virtual meeting substitution for routine trips; rising air & hotel cost inflation; restrictive CFO budgets; geopolitical visa friction | High |
| Opportunities | AI-driven cost optimization (20–30% savings); SME market penetration (only 15–25% managed); APAC volume growth; ESG-premium travel products | Very High |
| Challenges | Policy fragmentation; duty-of-care compliance complexity; traveler autonomy vs control tension; spend leakage in tail spend | Medium–High |
| Trends | AI-native platforms; ESG Scope 3 carbon mandates; NDC adoption reshaping GDS; bleisure mainstreaming; subscription travel models | Transformative |
Hybrid Work: The Demand Re-Architecture
The hybrid work transition has not reduced corporate travel. It has redefined its purpose. Pre-COVID, much of business travel was routine: weekly office check-ins, quarterly internal reviews — low-value interactions easily replaced by video. Post-2022, this discretionary travel has been permanently compressed. But high-value, relationship-critical travel has proven inelastic to virtual alternatives.
• Average trip value up: fewer trips, but higher spend-per-trip and higher business outcome-per-trip
• 69% of corporate travelers now control their own booking decisions — structural shift from centralized procurement
• Bleisure (business + leisure) trips now 28–32% of all corporate travel, up from ~15% pre-pandemic
• APAC travelers prioritize speed and convenience over cost — fundamentally different policy design required
Corporate Travel Industry Structure & Value Chain Analysis: Who Controls Value vs Who Carries Cost
The corporate travel market looks fragmented — but competitive advantage and margin capture are highly concentrated. Platform aggregators and technology-first TMCs are reshaping the value chain, while traditional intermediaries face structural disintermediation from both ends: airlines and hotels reclaiming direct relationships above, and AI-native platforms eroding the booking layer below.
| Value Migration Map — Corporate Travel 2025 | ||
| Bulk Transaction Processing | ────────────────────► Structural shift | Intelligent Data & Analytics |
| Traditional TMC Revenue | ────────────────────► Platform disruption | SaaS & Subscription Models |
| GDS Distribution Control | ────────────────────► NDC pressure | Airline Direct + AI Booking |
| Unmanaged Tail Spend | ────────────────────► Policy automation | Compliant, Visible Spend |
Corporate Travel Market Competitive Landscape / Key Positioning: Who Wins, Who Transforms, Who Exits
| Player Type | Strategic Advantage | Margin | Disruption Risk | Strategic Verdict |
| Global TMCs (Amex GBT, CWT, BCD) | Relationships, global reach, full-service | X% | High — from platforms | Must transform or lose margin |
| AI Platforms (Navan, TravelPerk) | UX, automation, SME, real-time data | X0–40% | Disruptor — not disrupted | Fastest-growing cohort |
| SaaS Tools (SAP Concur, Coupa) | ERP integration, enterprise compliance | X% | Low | Defensible software economics |
| GDS (Amadeus, Sabre) | Volume, booking infrastructure | X% | Structural — NDC | Revenue model reset needed |
| Airlines (Premium Cabin) | Pricing power, direct data, loyalty | 15–28% | Low (increasing power) | Actively reclaiming control |
The Structural Insights Nobody is Talking About
Corporate travelers represent approximately 10% of airline seats globally — yet generate X% of total airline profitability. This is the single most consequential statistic in corporate travel economics. It explains why airlines are investing billions in direct corporate sales channels, NDC adoption, and loyalty program redesign. Whoever owns the corporate traveler owns airline economics.
Regional Power Dynamics: Where Volume vs Value Plays Out
| Regional Market Size — Corporate Travel (USD Billion, 2024) | |
| North America | ████████████████████████████████████ USD 543 |
| Europe | █████████████████████████░░░░░░░░░░░ USD X |
| Asia Pacific | ███████████████████████░░░░░░░░░░░░░ USD X |
| Middle East & Africa | ██████░░░░░░░░░░░░░░░░░░░░░░░░░░░░░░ USD X |
| South America | ████░░░░░░░░░░░░░░░░░░░░░░░░░░░░░░░░ USD 64 |
| Regional CAGR 2026–2032 — Growth Intensity by Geography | |
| South America | ▓▓▓▓▓▓ X% |
| Middle East & Africa | ▓▓▓▓ X% |
| Asia Pacific | ▓▓▓ 7.1% |
| Europe | ▓▓ X% |
| North America | ▓▓ X% |
| Region | Strategic Narrative | Watch Indicator |
| North America | Maturity + Tech leadership. Home to the world's most sophisticated TMC ecosystem. US alone = ~32% of global managed travel spend. AI adoption highest here. | Platform vs TMC battleground — winner shapes global standard |
| Europe | ESG-driven transformation. CSRD forces Scope 3 disclosure. Rail substituting short-haul air. NDC adoption outpacing other regions. | Carbon regulation as demand architect |
| Asia Pacific | Volume growth engine. India CAGR ~11–13%. ASEAN corridors highest-frequency routes globally. APAC adds ~USD 294 Bn in absolute opportunity by 2032. | India's tier-2 city corporate travel — biggest white space |
| Middle East & Africa | Infrastructure hub. UAE + Saudi Vision 2030 driving premium travel demand. Dubai = #1 global MICE destination 2024–2026. | Megaproject travel as permanent demand driver |
Asia Pacific dominates the global corporate travel market due to rapid economic growth, increasing business travel demand, and expansion of multinational corporations in countries like India and China. North America remains a mature yet high-value corporate travel market, driven by advanced travel management systems and strong enterprise adoption.
Corporate Travel Technology Trends & AI-Driven Transformation: The Primary Competitive Differentiator
Technology is no longer a feature in corporate travel — it is the primary competitive differentiator separating market leaders from followers. The shift from GDS-based, phone-first TMC models to AI-native, data-driven platforms has permanently altered the economics and user experience of corporate travel management. And the platform that wins the data wins the ecosystem. The global business travel market is undergoing a transformation driven by digital platforms, automation, and evolving corporate travel policies.
| AI-Driven Savings Potential Across Travel Program Levers (% cost reduction) | |
| Advance booking optimization | ████████░░░░░░░░░░░░░░░░░░░░░░░░░░░░ ≤ 18 |
| Policy compliance automation | ██████░░░░░░░░░░░░░░░░░░░░░░░░░░░░░░ ≤ X |
| Preferred hotel program rigor | ██████████░░░░░░░░░░░░░░░░░░░░░░░░░░ ≤ X6 |
| Ground transport consolidation | ████████░░░░░░░░░░░░░░░░░░░░░░░░░░░░ ≤ X7 |
| Expense auto-reconciliation | ██████████████████████████████░░░░░░ ≤ X5 |
| Predictive budgeting accuracy | ████████████████████████████████████ ≤ X8 |
| Technology Layer | Function | Adoption (2025) | Value Created |
| AI & Predictive Analytics | Cost forecasting, demand prediction, route optimization | Medium–High | 12–18% fare reduction |
| Automated Approval Workflows | Real-time policy enforcement, pre-trip guardrails | High (enterprise) | 8–14% out-of-policy reduction |
| Expense Reconciliation + ERP Sync | Auto-matching receipts, finance integration | High | 60–70% processing time saved |
| Carbon & ESG Tracking Tools | Scope 3 emissions, green supplier scoring | Low–Medium | Regulatory compliance + premium pricing |
| GenAI Trip Planning | Natural language booking, preference learning | Early stage | Personalization + traveler satisfaction |
| Real-Time Risk Monitoring | Geopolitical alerts, traveler tracking, crisis response | Medium | Duty-of-care + legal compliance |
Platform VS TMC: The Inflection has Already Happened
Traditional TMCs are losing on 5 of 8 critical capability dimensions to platform-native players. Booking speed, policy automation, analytics depth, pricing transparency, and SME accessibility all favor platforms. TMCs retain advantage only in complex itinerary management, group travel, and 24/7 human crisis support — capabilities that platforms are actively building. The window for TMC transformation is 2–4 years.
Corporate Travel Sustainability Trends & ESG Impact Analysis : From Compliance Checkbox to Competitive Moat
ESG is no longer a corporate travel 'nice-to-have.' The EU's Corporate Sustainability Reporting Directive (CSRD) mandates Scope 3 emissions disclosure — directly implicating business travel in corporate carbon reporting. Regulation is not suppressing corporate travel. It is redistributing value — toward green-certified suppliers, SAF-enabled carriers, and technology platforms that can quantify and report emissions at the trip level. Corporate travel industry trends indicate a shift toward cost optimization, policy compliance, and traveler experience enhancement.
| ESG Dimension | 2025 Status | Strategic Implication |
| Scope 3 Carbon Reporting | X2% of enterprises have formal sustainable travel policies (vs 18% in 2021) | CSRD compliance forces program redesign for all EU companies |
| SAF (Sustainable Aviation Fuel) | Corporates willing to pay 8–15% premium on SAF-enabled corporate accounts | Airlines with SAF programs win preferred carrier contracts |
| Rail Substitution Policy | 29% of European corporate programs mandate rail for trips under 3 hours | Hotel and ground spend shifting; airline mix changing |
| Green Hotel Certification | 34% of Fortune 500 preferred programs require LEED/Green Key certification | Hotels without certification lose corporate accounts |
| Carbon Offset Integration | Early-stage — credibility concerns persist; voluntary demand growing | Platform that solves offset credibility wins ESG differentiation |
The ESG Paradox in Corporate Travel
Companies are simultaneously cutting travel for sustainability and increasing premium travel spend. The apparent contradiction resolves when you understand the logic: fewer trips, higher per-trip quality, lower carbon footprint per dollar of business outcome. ESG is accelerating the shift from travel volume to travel value — which is exactly what this market needed structurally.
Innovation & White Spaces: Where the Next Billion-Dollar Opportunities Lie
Despite platform proliferation and AI adoption, the corporate travel market contains structural white spaces — segments underserved by current solutions. Adoption remains concentrated among large enterprises, while SMEs, emerging markets, and specialized verticals face cost, scalability, and product-fit barriers — creating untapped opportunities that dwarf the existing managed market.
| White Space | Current Penetration | Opportunity (USD Bn, 2032) | Winning Model |
| SME Managed Travel | X5–X5% managed | USD X00+ Bn | SaaS-priced, self-serve, AI-automated |
| India Tier-2/3 Corporate | Minimal — no structured digital solution | USD X0–X0 Bn | India-native tech platform + regional TMC |
| ASEAN Growth Corridors | Fragmented, volume growing | USD X0–X00 Bn | Pan-ASEAN aggregator with duty-of-care |
| MICE Digital Platforms | Structurally manual | USD X0–X0 Bn | End-to-end digital group travel |
| Analytics-as-a-Service | Near-nascent | USD X–X2 Bn SaaS TAM | Sell spend intelligence back to corporates |
| ESG-Premium Travel | Low supply, demand growing | USD 25–35 Bn premium | Green product bundle by airlines + hotels |
THE SME Blind Spot: A USD 200 Billion Problem Waiting for a Product
The SME corporate travel segment — companies with fewer than 500 employees — represents over USD 220 Billion in annual travel spend with only X5–X5% managed. The barrier is not willingness — it is product-market fit. Most TMC solutions are built for enterprise-scale complexity. The winning model for SMEs needs to be: self-serve, mobile-first, policy-light, AI-automated, and priced on a per-user SaaS basis.
Corporate Travel Market Competitive Landscape & Key Players: Why This Is No Longer a Relationships Business
The corporate travel market looks like a relationships business — and historically, it was. The TMC that had the best account managers won. In 2025, that model is structurally obsolete. The TMC with the best AI, the cleanest UX, the most transparent pricing, and the deepest spend analytics wins. Relationships extend tenure; technology determines contract outcomes.
| Player | Revenue (2025 Est.) | Strategic Strength | Key Vulnerability | 2025 Bet |
| Amex GBT | ~USD X.1 Bn | Global scale, data, brand trust | Premium pricing; slower tech vs platforms | Neo platform + AI expansion |
| CWT | ~USD X.4 Bn | Mid-market depth, global reach | Legacy tech stack; private equity pressure | Tech modernization + cost focus |
| BCD Travel | ~USD X.2 Bn | Analytics leadership, ESG positioning | Scale vs Amex GBT | Sustainability product + consulting |
| Navan | ~USD X.8 Bn | AI-native, UX-first, SME leader | Limited MICE + complex itinerary | Enterprise move-up + international |
| TravelPerk | ~USD X.4 Bn | SME champion, FlexiPerk, API-open | US market nascent | US expansion + AI features |
| SAP Concur | ~USD X.6 Bn | ERP lock-in, enterprise compliance | UX dated; booking experience poor | GenAI integration + modernization |
| Integrated Giants | Multinational TMC Leaders | Platform-First Disruptors | Specialty / Niche |
| Amex GBT | CWT | Navan (TripActions) | Frosch Travel (JPMorgan) |
| BCD Travel | FCM Travel | TravelPerk | ATPI |
| CTM | SAP Concur | Radius Travel |
Recent Developments & Industry Impact
• Amex GBT acquires Egencia from Expedia (2021) — scale + tech + SME channel access in a single move
• Navan raises USD 304M Series G (2022) — signals investor conviction in AI-native platform model for corporate travel
• IATA NDC adoption accelerating — airlines bypassing GDS, reclaiming pricing control and traveler data ownership
• EU CSRD enforcement (2024–2026 phased) — forces Scope 3 disclosure, directly restructuring supplier selection
• TravelPerk launches FlexiPerk — full refund guarantee product that fundamentally reframes booking risk for SMEs
• SAP Concur integrates GenAI planning assistant — legacy incumbent acknowledging the AI-first architecture shift
These developments collectively increase structural entry barriers and accelerate market consolidation — while simultaneously creating the largest window of disruption the corporate travel market has seen since GDS emerged in the 1970s.
Corporate Travel Market — Segmentation Coverage
| Report Coverage | Details |
| Base Year: | 2025 |
| Forecast Period: | 2026–2032 |
| Historical Data: | 2019 to 2025 |
| Market Size in 2024: | USD 1,619.5 Billion |
| Forecast Period CAGR: | 6.2% (2025–2032) |
| Market Size in 2032: | USD 2,467.45Billion |
| Segments | Sub-segments |
| By Type | Managed Corporate Travel | Unmanaged Corporate Travel |
| By Traveler | Solo Traveler | Group Traveler |
| By Purpose | Client Meetings & Sales | MICE | Internal Meetings | Trade Shows | Site Visits | Product Launch & Roadshows |
| By Booking Channel | OTAs | TMCs | Corporate Self-Booking Tools | Direct Supplier |
| By Expenditure | Air Travel | Lodging | Ground Transport | Dining & Entertainment | TMC Fees | Ancillary |
| By Service Type | Air | Accommodation | Ground Transport | Travel Management | Insurance & Risk | Visa & Documentation |
| By Org. Size | Large Enterprise (>5,000) | Mid-Market (500–5,000) | SME (<500) | Startups |
| By Industry | BFSI | IT & Telecom | Consulting | Healthcare & Pharma | Manufacturing | Retail | Energy | Government | Others |
| By Region | North America | Europe | Asia Pacific | Middle East & Africa | South America |
Strategic Takeaway
• Travel spend is structurally guaranteed — but margin migrates toward technology, data, and compliance capability
• The 10% of travelers driving X5–X5% of airline profit are the most fought-over customers in global service economics
• SME managed travel is the largest underpenetrated opportunity — a USD 200+ Billion problem without a product-market-fit solution
• AI-native platforms will capture value from traditional TMCs over the next X years — the consolidation is structural
• ESG is not compressing travel demand — it is reshaping supplier selection and premium pricing power
• The corporate travel market growth is strongly linked to increasing cross-border business expansion and enterprise mobility demand.
• Asia Pacific adds more absolute opportunity by 2032 than any other region — APAC is where the next growth phase originates
The Central Thesis
Corporate travel is no longer about moving people. It is about controlling the revenue-generation infrastructure of global commerce. The organizations that understand this — and build travel programs, platforms, or investment theses around this reality — will define the next decade of corporate mobility. Those that treat it as a cost line will continue to manage it as one. Overall, the global corporate travel market is expected to witness sustained growth, supported by increasing enterprise travel demand, digital transformation in travel management, and rising focus on ROI-driven travel strategies. This corporate travel industry analysis provides a comprehensive view of market size, trends, opportunities, and competitive dynamics shaping the future of business travel.
Frequently Asked Questions
Frequently asked questions related to the corporate travel market size, trends, growth, and future outlook are addressed below to provide clarity for stakeholders and decision-makers.
Q1. What is the size of the global corporate travel market in 2024?
The global corporate travel market size was valued at USD 1,619.5 Billion in 2024 and is projected to reach USD 2,467.45Billion by 2032, growing at a CAGR of 6.2%.
Q2. Why is corporate travel growing despite the rise of virtual meetings?
Virtual meetings have replaced routine, low-value interactions — but have proven structurally ineffective for complex deal closure, relationship maintenance, and high-stakes negotiations. Corporate travel demand is increasingly ROI-filtered, not suppressed.
Q3. Which segment offers the highest growth potential?
SME managed travel — companies with fewer than 500 employees — remains the largest underpenetrated segment. With only 15–25% adoption of managed travel programs vs 85%+ for large enterprises, this represents a USD 200+ Billion addressable opportunity.
Q4. How is AI changing corporate travel economics?
AI-driven advance booking optimization, automated policy enforcement, and predictive budgeting together deliver 20–30% cost reduction for organizations with mature travel programs. The platform with the richest behavioral data builds the most defensible AI advantage.
Q5. Which region offers maximum long-term growth?
Asia Pacific — driven by India (CAGR ~11–13%), ASEAN corridor growth, and rapid industrialization — will add the most absolute market opportunity by 2032. India's tier-2 and tier-3 city corporate travel represents the largest single white space in the market.
Q6. Is ESG reducing corporate travel demand trend?
No. ESG is reshaping supplier selection, shifting spend toward premium sustainable options, and accelerating the trip-quality-over-quantity transition. The net effect: fewer trips, higher per-trip value, better business outcomes per dollar spent.
Lead Analyst Profile
Lead Analyst — Global Corporate Travel & Business Mobility Markets
This research is authored by analysts with deep expertise in corporate travel economics, TMC competitive dynamics, travel technology platform strategy, airline revenue management, and enterprise procurement architecture — advising Fortune 500 travel programs, private equity investors, TMC leadership teams, and airline corporate sales divisions across North America, Europe, and Asia Pacific.
Core competencies: Travel spend econometrics | ROI architecture modeling | Platform competitive analysis | ESG compliance design | TMC transformation strategy | Regional demand modeling