
Clean Label Ingredients Market – Global Market Size, Strategic Growth Drivers, Risk Assessment Framework, Regulatory Landscape Review, Competitive Intensity Mapping & Long-Term Industry Outlook to 2030
Overview
The Clean Label Ingredients Market was valued at USD 46.24 Bn. in 2023. The Clean Label Ingredients Market size is estimated to grow at a CAGR of 6.75 % over the forecast period.
Clean Label Ingredients Market Overview:
Clean label ingredients are increasingly essential in a consumer-driven market, shaped primarily by consumer perceptions regarding ingredient acceptability and label claims. While there is no formal regulatory definition for clean labels, it typically refers to ingredients that are recognized and accepted by consumers as being free from genetically modified organisms (GMOs) and devoid of artificial components. These ingredients align with consumer expectations for transparency in food labeling.
Clean label ingredients also facilitate margin management by allowing manufacturers to navigate global sourcing challenges, replace costly ingredients like dairy, and optimize formulation costs. Their functional performance is noteworthy, as native starches and citrus fibers maintain quality through various temperatures, supporting both shelf-stable and frozen products, while emulsifiers prolong shelf life and reduce waste.
Clean label ingredients enhance label appeal by ensuring non-GMO and certified organic options, catering to dietary needs such as gluten-free, nut-free, and vegan lifestyles. With a focus on recognized ingredients, these components improve nutritional profiles by enabling fat reduction and resonate with health-conscious consumers seeking quality in their food and beverage choices. The clean label ingredients market continues to evolve, driven by consumer demand for transparency and wellness in their dietary options. To know about the Research Methodology :- Request Free Sample Report
Clean Label Ingredients Market Dynamics:
Consumer preferences are shifting towards organic and natural ingredients because of the health awareness among the people. Increasing demand for quality food and nutrition because of the growth of urbanization and the workforce. Products like ready-to-eat food, packaged food, frozen meals, instant noodles, etc., are increasing rapidly in the clean label ingredients market because of the various microorganisms which maintain the quality and reduce the spoilage. The demand for clean label ingredients products by the consumer is increasing every day, which is becoming the driving factor of the clean label ingredients market. Also, the income level and age groups also play an important role in the clean label ingredients market. Millennials are driving the clean label ingredients market.
The high cost involved in clean-label ingredients is hauling the market expansion of the clean label ingredients market. Manufacturers are facing problems during the process because maintaining the ingredients mixers in the products will also save the cost. This balance will restrain the growth of the clean label market.
Various companies are investing a high amount in research and development to gain the largest share in the market. The process of clean label products is lengthy, it is done by the traditional method, but companies are using advanced technology without compromising the quality and taste of the product. It will create a great opportunity in the forecasted period.
Clean Label Ingredients Market Trends:
The increasing involvement of the government in the clean label ingredients products because of the increasing artificial products demands in the market and also consumers are becoming more aware of their health concerns and started consuming healthy ingredients products. The FDA (Food and Drug Administrative) is responsible for selling safe and properly labeled products in the U.S., and also the U.S. government has banned the various projects which consist of artificial and synthetic food ingredients in 2022. Globally, the “Free-From” claim is increasing rapidly in the retail and foodservice menu. Because the growing health concern is increasing among customers regarding the food and beverages products being consumed, which is expected to increase the demand for the clean label ingredients market by the forecasted period.
Clean Label Ingredients Market Segment Analysis:
Based on the Form, the market is segmented into Liquid, Powder and Others. Powder is expected to dominate the Clean Label Ingredients Market during the forecast period.
Powdered ingredients are seamlessly incorporated into a wide range of food and beverage applications, such as dry mixes and others, making them highly attractive to manufacturers seeking clean label solutions. The powder form also facilitates precise measurement and consistent formulation, allowing for better control over product quality and performance.
Consumers prefer powdered clean label ingredients because they are perceived as less processed and more natural. The growth in demand for gluten-free, plant-based, and organic products has boosted the development of powdered clean label alternatives, which replace traditional ingredients without compromising taste or texture. As manufacturers strive to meet consumer preferences for transparency and simplicity, powdered clean label ingredients provide an effective way to enhance product appeal while aligning with health-conscious trends.
Based on the Ingredients Type, the market is categorized into Flours, Naturals Colors, Naturals Flavors, Starch and Sweeteners and Others. Naturals Colors dominated the Clean Label Ingredients Market in 2023. As consumers become more health-conscious and discerning about the ingredients in their food, the shift away from synthetic additives has led to a significant increase in the use of natural colors. These ingredients improve the visual appeal of food and beverages and align with the clean label trend that highlights transparency and simplicity in ingredient sourcing.
Natural colors derived from fruits, vegetables, and other plant sources are favored for their safety and functionality with consumer preferences for recognizable ingredients. The regulations and consumer awareness surrounding food labeling have driven the demand for natural colors. Manufacturers seek to replace artificial colors to meet regulatory requirements and consumer expectations. The versatility of natural colors enables their application across various product categories, including snacks, beverages, and baked goods. This makes them essential for brands aiming to enhance product aesthetics while adhering to clean label principles.
Clean Label Ingredients Market Regional Insights:
The Europe region held the largest market share accounting for 45% in 2023. The Europe region has dominated the market because of the largest consumer of clean label ingredients in the UK, Spain, and Italy. And also growing awareness of healthy food. The demand in western and eastern Europe has also dominated the clean label ingredients market. APAC region also chose to shift from artificial products to cleaner products and is expecting to grow in the forecasted period. The reason for the growing demand in the APAC region is because of the rising in the living standard, and it has diverse economic backgrounds.
The objective of the report is to present a comprehensive analysis of the global Clean Label Ingredients Market to the stakeholders in the industry. The past and current status of the industry with the forecasted market size and trends are presented in the report with the analysis of complicated data in simple language. The report covers all the aspects of the industry with a dedicated study of key players that include market leaders, followers, and new entrants.
PORTER, PESTEL analysis with the potential impact of micro-economic factors of the market have been presented in the report. External as well as internal factors that are supposed to affect the business positively or negatively have been analyzed, which will give a clear, futuristic view of the industry to the decision-makers.
The reports also help in understanding the market dynamic and structure by analyzing the market segments and projecting the Clean Label Ingredients Market size. Clear representation of competitive analysis of key players by Design, price, financial position, product portfolio, growth strategies, and regional presence in the market make the report investor’s guide.
Clean Label Ingredients Market Ecosystem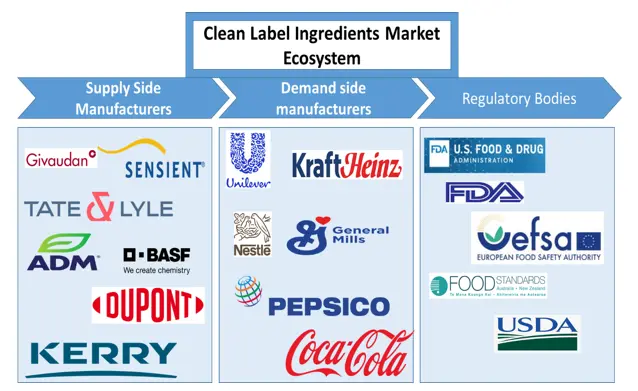
Clean Label Ingredients Market Scope: Inquire before buying
| Clean Label Ingredients Market | |||
|---|---|---|---|
| Report Coverage | Details | ||
| Base Year: | 2023 | Forecast Period: | 2024-2030 |
| Historical Data: | 2018 to 2023 | Market Size in 2023: | USD 46.24 Billion |
| Forecast Period 2024 to 2030 CAGR: | 6.75% | Market Size in 2030: | USD 73.05 Billion |
| Segments Covered: | by Form | Liquid Powder Others |
|
| by Ingredients Type | Flours Naturals Colors Naturals Flavors Starch and Sweeteners Others |
||
| by Application | Food Dairy & Frozen Desserts Bakery Products Prepared Meals/Ready Meals Cereals & Snacks Meat, Poultry, & Seafood Others Beverages Personal Care and Cosmetics Pharmaceuticals Confectionery Others |
||
Clean Label Ingredients Market, by Region
North America (United States, Canada and Mexico)
Europe (UK, France, Germany, Italy, Spain, Sweden, Austria and Rest of Europe)
Asia Pacific (China, South Korea, Japan, India, Australia, Indonesia, Malaysia, Vietnam, Taiwan, Bangladesh, Pakistan and Rest of APAC)
Middle East and Africa (South Africa, GCC, Egypt, Nigeria and Rest of ME&A)
South America (Brazil, Argentina Rest of South America)
Clean Label Ingredients Market Key Players:
1. Givaudan
2. Sensient Technologies Corporation
3. ADM (Archer Daniels Midland Company)
4. Kerry Group
5. Tate & Lyle
6. BASF
7. DuPont Nutrition & Biosciences
8. CHR Hansen
9. Emsland Group
10. Cargill
11. Ben & Jerry's
12. Olam International
13. Sethness Forms Company
14. Maroon Group
15. AquaBounty Technologies
16. WILD Flavors & Specialty Ingredients (part of ADM)
17. Nutraceutical International Corporation
18. Mane
19. Vita Ingredients
20. Glanbia Nutritionals
21. NutraBlast
22. AptarGroup
23. Fuchs North America
Frequently Asked Questions
1] What segments are covered in the Global market report?
Ans. The segments covered in the market report are based on Form, Ingredients Type and Application.
2] Which region is expected to hold the highest share in the Global market?
Ans. The Europe region is expected to hold the highest share of the market.
3] What was the market size of the Global market in 2023?
Ans. The market size of the market in 2023 was valued at USD 46.24 Bn.
4] What is the market size of the Global market by 2030?
Ans. The market size of the market by 2030 is expected to reach US$ 73.05 Bn.
5] What is the forecast period for the Global market?
Ans. The forecast period for the market is 2024-2030.