
Global Automotive Market Size by Vehicle Type, Propulsion, Application, Ownership and Sales Channel
Overview
Global Automotive Market Overview
The Global Automotive Market was valued at USD 2.75 trillion in 2025 and is projected to reach USD 3.26 trillion by 2032, growing at a CAGR of 3.46% during 2025–2032. Asia-Pacific is the largest regional automotive market, accounting for 53.11% of global vehicle sales in 2024, while passenger cars represent the largest vehicle category with a 72.45% revenue share. The global automotive industry is being reshaped by vehicle electrification, connected vehicles, advanced driver-assistance systems (ADAS), software-defined vehicles, autonomous driving, automotive semiconductors, and changing mobility models.
The global automotive market encompasses passenger cars, commercial vehicles, two-wheelers, three-wheelers, and off-highway vehicles across internal combustion engine (ICE), hybrid, battery-electric vehicle (BEV), and fuel-cell electric vehicle (FCEV) powertrains. The market is further analyzed by vehicle type, propulsion type, powertrain, fuel type, vehicle class, sales channel, end user, application, automation level, connectivity, and region. Beyond the conventional vehicle-transaction market, MMR separately evaluates the broader full-stack automotive economy, including software, connected services, electrification technologies, mobility services and other technology-enabled value pools.
| 6.92% | 8.51 USD Tn. | 250+ | 165 |
| CAGR (2025-2032) | FORECAST MARKET SIZE | REPORT PAGES | MARKET TABLES |
The Automotive Industry Is No Longer Selling Vehicles. It Is Selling Platforms.
The cost of building software into a car has just become cheaper than the cost of not building it. That single economic inversion is rewriting the global automotive industry from the factory floor to the boardroom. Between 2025 and 2032, the global automotive market is set to expand from a vehicle-transaction base of USD 2.75 trillion to a full-stack platform economy worth well over USD 6 trillion — and the companies that fail to recognize this shift will not simply grow slower. They will be acquired by the ones that do.
Consider the scale of what is actually happening: global EV sales jumped 35 percent in a single year to cross 14 million units; BYD overtook Tesla to become the world's largest single-brand battery-electric-vehicle seller in a market that did not meaningfully exist a decade ago; and software subscription bundles are now delivering incremental margins above 40 percent — five to eight times the margin available anywhere in traditional vehicle manufacturing. This is not incremental industry evolution. It is a full economic re-platforming, and this report is built to show exactly where the next dollar of value lands.
What makes this transformation unprecedented is that five industries are now converging into one. The automotive industry is no longer merely a vehicle manufacturing sector; it is becoming a software industry, an energy industry, an artificial intelligence industry, a semiconductor industry, and a mobility-services industry simultaneously. Battery supply chains are reshaping geopolitical alliances, software-defined vehicles are creating recurring revenue streams long after the initial sale, and vehicle-generated data is emerging as a monetizable asset class in its own right. The winners of the next decade will not necessarily be the companies that build the most vehicles, but the companies that control the most profitable layers of the automotive value chain.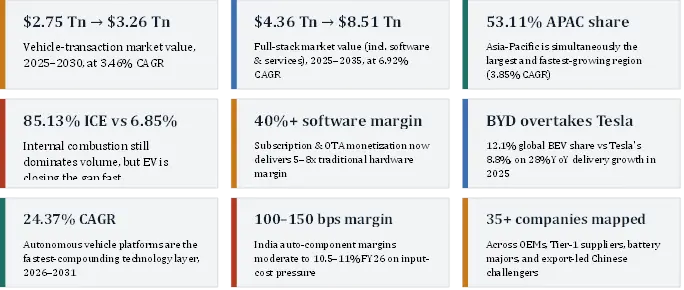
To know about the Research Methodology :- Request Free Sample Report
EXECUTIVE DASHBOARD ] KPI dashboard tile set — market size, CAGR, EV penetration %, software margin %, top region, top risk — rendered as a single glance summary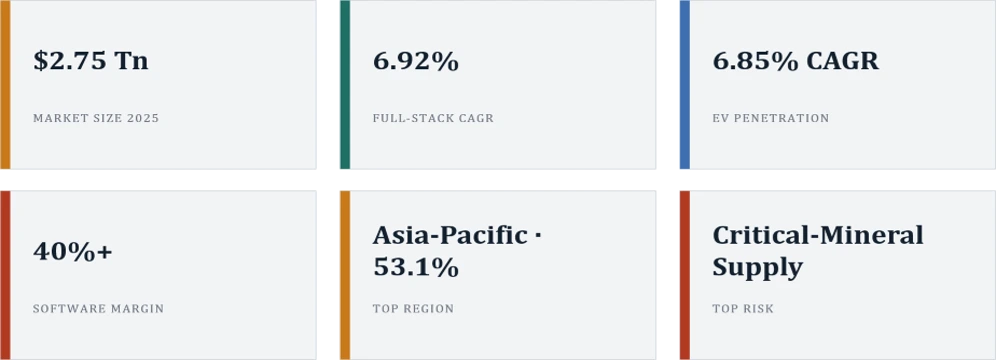
Global Automotive Market Snapshot
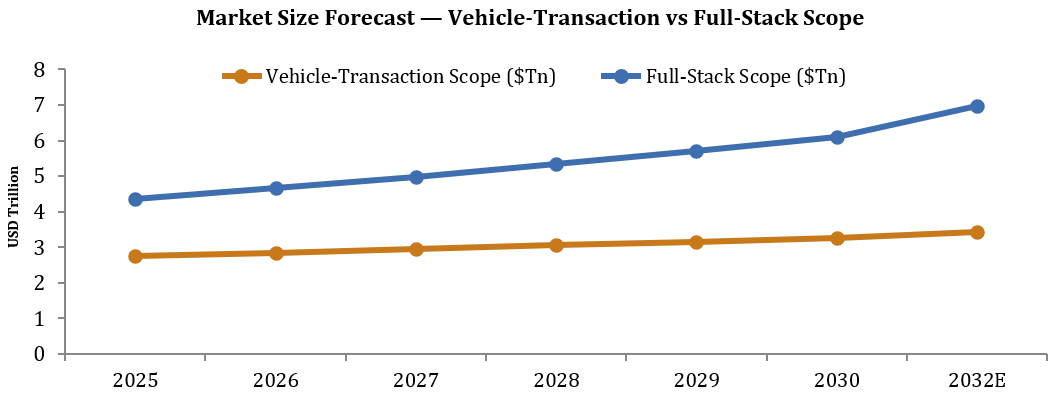
The global automotive market size was valued at USD 2.75 trillion in 2025 and is projected to reach USD 3.26 trillion by 2032, registering a CAGR of 3.46% during 2025–2032. Growth is supported by rising vehicle demand in emerging economies, fleet replacement, urbanization, increasing commercial mobility requirements, vehicle electrification, and continued investment in connected and intelligent vehicle technologies..
For the primary market sizing analysis, the Global Automotive Market is defined as the value of new vehicle transactions across passenger cars, commercial vehicles, two-wheelers, three-wheelers, and off-highway vehicles. The primary market estimate excludes aftermarket services, standalone software revenues, charging services, financing, insurance, and other adjacent automotive ecosystem revenues unless directly attributable to the sale of a new vehicle.
MMR's Full-Stack Automotive Economy is presented separately as a proprietary strategic framework covering the broader value ecosystem created by vehicle software, connected services, electrification, batteries, charging, mobility services, and other technology-enabled revenue pools.
Global Automotive Market Size and Forecast
| Metric | Value |
| Global Automotive Market Size, 2025 | USD 2.75 Trillion |
| Global Automotive Market Forecast, 2032 | USD 3.26 Trillion |
| CAGR, 2025–2032 | 3.46% |
| Largest Region | Asia-Pacific |
| Asia-Pacific Share | 53.11% |
| Largest Vehicle Type | Passenger Cars |
| Passenger Car Share | 72.45% |
| Largest Propulsion Type | Internal Combustion Engine |
| ICE Share | 85.13% |
| Fastest-Growing Propulsion Type | Electric Vehicles |
| EV CAGR | 6.85% |
What Is the Global Automotive Market?
The Global Automotive market encompasses the production and sale of passenger cars, commercial vehicles, two-wheelers, three-wheelers, and off-highway vehicles across major global markets. The industry includes vehicles powered by internal combustion engines, hybrid powertrains, battery-electric systems, and fuel-cell technologies. In addition to vehicle manufacturing and sales, the automotive value chain is increasingly influenced by software-defined vehicles, connected-car technologies, ADAS, autonomous driving, batteries, charging infrastructure, automotive semiconductors, digital services, and mobility platforms.
Executive Summary - Global Automotive Market
The automotive industry is transcending its century-old identity as a hardware-manufacturing business to become a software, mobility, and energy-platform economy. Four converging forces are driving this transformation: the electrification supercycle sweeping China, Europe and North America; the software-defined-vehicle transition converting cars into recurring-revenue platforms; the on-shoring of battery and semiconductor supply chains following years of geopolitical exposure; and the rise of subscription and pay-per-use ownership models displacing single-transaction retail. Asia-Pacific remains the undisputed volume and growth engine, commanding over 53 percent of global vehicle sales, while blockchain-based supply-chain traceability, AI-driven predictive maintenance, and zonal electrical-electronic architecture are elevating the modern vehicle from a depreciating mechanical asset into a continuously monetizable digital product. So what does this mean in practice? Every OEM, supplier and investor evaluating this industry over the next decade needs to stop asking "how many units will sell" and start asking "which layer of this value chain will I own."
Global Automotive Market - Market Positioning — What Is the Automotive Industry Becoming?
The automotive market can no longer be classified as a single category. It is simultaneously becoming a Mobility Platform (subscription and shared-access models), an Energy Platform (battery storage, vehicle-to-grid integration, charging infrastructure), a Software Platform (over-the-air monetization, in-car app ecosystems), an AI Platform (autonomous driving, predictive maintenance, generative-AI-driven configurators), a Connected Data Economy (telematics-driven insurance, fleet analytics, behavioral data licensing), and — in an increasing number of national industrial strategies — a Strategic Manufacturing Asset tied directly to semiconductor sovereignty and battery-supply security. Why does this matter? Because a company valuing itself purely as a vehicle manufacturer is capitalizing itself against the smallest and slowest-growing of these six identities, while its most dangerous competitors are already pricing themselves against the largest and fastest.
Figure: MARKET POSITIONING Six-axis radar/hexagon chart plotting the automotive industry's identity across Mobility, Energy, Software, AI, Data, and Strategic-Manufacturing dimensions, sized by projected 2032 value pool.
Demand Engine Analysis of Global Automotive Market
Demand in this industry is not a single force — it is five distinct engines running at different speeds. Structural demand comes from population growth, urbanization and rising middle-class incomes across Asia-Pacific, Africa and Latin America, and is effectively permanent. Replacement demand comes from the roughly 1.4-billion-vehicle global fleet aging out of service, and is recession-resistant but cyclical. Policy-driven demand comes from emissions mandates, EV tax credits and zero-emission-zone regulation — powerful but reversible if political will shifts.
Recurring demand comes from software subscriptions, OTA feature unlocks and predictive-maintenance contracts — the newest and fastest-growing engine, and the only one priced closer to a SaaS multiple than an industrial multiple. Discretionary demand comes from premium and luxury upgrades, the most cyclical and most exposed to macroeconomic downturns. Can this demand disappear? Structural and replacement demand cannot; policy demand can be legislated away; recurring demand, once embedded in a subscription base, is the stickiest revenue line the industry has ever built. That is precisely why every OEM's capital-allocation priority should be shifting toward the engines that do not evaporate with the next election cycle.
DEMAND ENGINE TREE - Root-and-branch tree diagram splitting total demand into five engines (structural, replacement, policy, recurring, discretionary), sized by 2025 volume share and colored by durability/elasticity.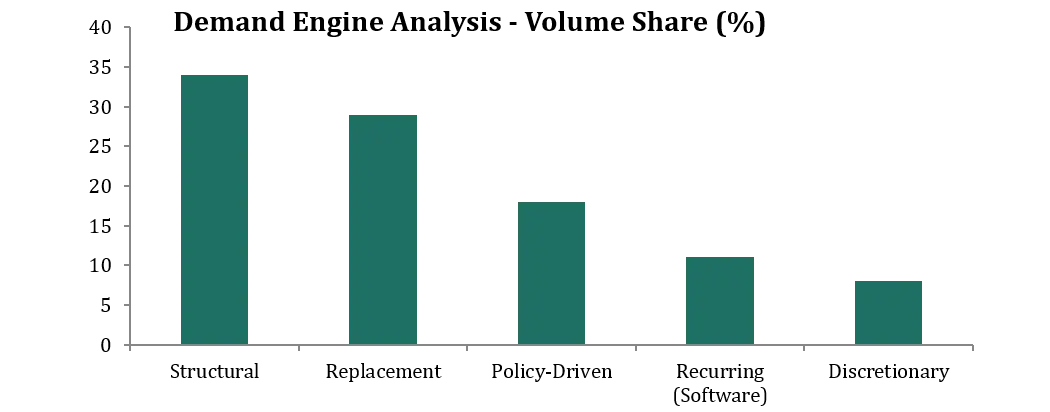
Market Economics of Global Automotive Market
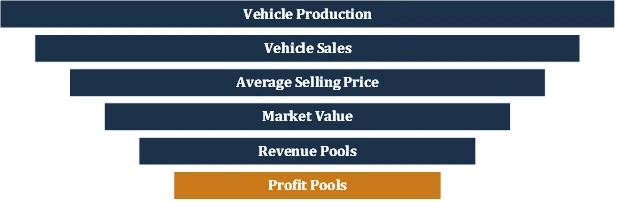
The logical chain from unit sold to profit realized runs through six distinct stages, and most market reports stop at the first one. Vehicle production feeds vehicle sales, which at an average global selling price generates market value. That market value splits into revenue pools across manufacturing, financing, aftermarket and — increasingly — software. Revenue pools then compress into profit pools once cost structure, capital intensity and competitive density are applied, and profit pools finally point toward future monetization: which layer of this chain will still be generating margin in 2032 regardless of how many vehicles are physically sold that year. Passenger cars alone command 72.45 percent of 2024 revenue share, yet the fastest-compounding profit pool sits in software subscriptions delivering 40 percent-plus incremental margin — a segment representing a small fraction of total revenue today but an outsized share of tomorrow's enterprise value.
MARKET ECONOMICS FUNNEL ] Six-stage funnel — Production → Sales → ASP → Market Value → Revenue Pools → Profit Pools — with a callout box showing the disproportionate margin captured by the smallest (software) stage.
Global Automotive Market Growth Drivers, Restraints & Opportunities
The global automotive market is being driven by rising vehicle demand in emerging economies, fleet replacement, urbanization, vehicle electrification, increasing connected-vehicle adoption, advanced driver-assistance systems, software-defined vehicle development, and supply-chain localization. These structural factors are influencing both vehicle demand and the distribution of value across the automotive ecosystem
Four converging trends are structurally driving demand across the global automotive market. First, rapid electrification momentum has pushed global EV sales past 14 million units in a single year — a 35 percent jump — with China alone contributing 60 percent of that volume, and battery pack costs falling toward USD 72 per kilowatt-hour by 2030, steadily closing the price gap against internal combustion vehicles. Second, urban air-quality legislation — including Euro 7 tailpipe standards adding USD 1,400 to 1,900 in compliance cost per combustion vehicle from 2025, and California's mandate for 100 percent zero-emission new-vehicle sales by 2035 — is mechanically accelerating the shift toward electrified and zero-emission fleets. Third, digital cockpit and connected-vehicle demand is compounding fastest of all drivers on a short two-year horizon, as semiconductor content per vehicle rises and software subscription bundles priced between USD 10 and 25 monthly begin delivering margins exceeding 40 percent. Finally, supply-chain on-shoring initiatives — CHIPS Act-linked fabrication capacity and multi-gigawatt-hour battery plants across North America and Europe — are reducing multi-year exposure to single-region manufacturing risk.
Industry Pain Points
Five pain points define where this industry genuinely struggles today. Battery and chip supply concentration leaves the entire sector exposed to a handful of geopolitically sensitive producers of lithium, cobalt, nickel and automotive-grade semiconductors. Margin compression under regulatory pass-through means component makers absorb 100–150 basis points of cost pressure this fiscal alone, since OEM cost pass-through typically lags one to two quarters and is rarely full. Legacy asset stranding threatens every OEM still carrying combustion-era tooling that will not clear its cost of capital by 2032. Software talent scarcity is forcing century-old manufacturing organizations to compete for the same engineering talent as pure technology companies, often losing that fight on compensation structure alone. And customer trust in autonomy remains fragile — a single high-profile ADAS or autonomous-driving incident can set adoption timelines back years, regardless of the underlying safety statistics.
Cost Structure Analysis
| Cost Component | Approx. Share of Total Cost | Commentary |
| Raw materials (steel, aluminium, battery inputs) | ~X5–50% | Steel + aluminium alone = 50–60% of non-battery input cost; battery-grade lithium/nickel/cobalt add volatility |
| Labor & manufacturing | ~X8–X0% | Rising with minimum-wage revisions across key manufacturing hubs |
| Electronics & semiconductors | ~X0–X2% | Rising fastest as ADAS and digital-cockpit content per vehicle increases |
| Logistics & distribution | ~X–X0% | Elevated by longer shipping routes and higher buffer-inventory norms (95–105 days, up from 80–85) |
| Software & compliance | ~X–X% | Smallest cost line today, but the only one converting into 40%+ margin post-sale |

Why does this matter? Because the cost lines shrinking fastest as a share of total cost — software and compliance — are the same lines generating the highest post-sale margin. Every percentage point an OEM shifts its cost structure toward that layer is a percentage point of margin defended against commoditization pressure everywhere else in the value chain.
Profit Pool Migration Analysis of Global Automotive Market
Market size tells you how big the industry is. Profit pool migration tells you where the money actually accumulates — and the two tell almost opposite stories over the next decade.
| Profit Pool | 2025 Share (Est.) | 2035 Share (Est.) | Trajectory |
| Vehicle manufacturing (hardware margin) | ~X8% | ~X5% | Structurally declining as commoditization deepens |
| Software & OTA monetization | ~X% | ~X0% | Fastest-growing pool; 40%+ incremental margin |
| Battery & energy storage | ~X% | ~X2% | Structurally protected via long-term offtake contracts |
| Aftermarket & services | ~X0% | ~X4% | Steady, boosted by predictive-maintenance data monetization |
| Charging & mobility services | ~X% | ~X% | Emerging pool tied directly to EV penetration curve |
| Connectivity & data licensing | ~X% | ~X% | Small today; among the highest-margin pools by 2035 |
Automotive Market Ecosystem Mapping

The value chain runs from raw materials through component suppliers (Tier 2 and Tier 3), Tier-1 systems suppliers, OEMs, dealerships and distribution, fleet operators and consumers, aftermarket service, and finally recycling and the circular economy. Power, margin and risk are distributed unevenly across this chain: raw-material suppliers carry the highest volatility and the lowest margin; Tier-1 suppliers carry moderate margin but high customer concentration risk; OEMs carry brand power but shrinking hardware margin; and the aftermarket-and-recycling layer, historically an afterthought, is emerging as a structurally protected, high-retention profit pool as circular-economy mandates tighten across Europe and North America.
MMR Opportunity Matrix
| Opportunity | Market Size | CAGR | Investment Risk | Entry Difficulty |
| EV Software & OTA Platforms | High | High | Medium | Medium |
| Charging Infrastructure | High | Very High | Medium | High |
| Battery Recycling & Second-Life | Medium | Very High | Medium | Medium |
| Autonomous Mobility (Robotaxi) | High | Very High | High | Very High |
| Fleet Telematics & Predictive Maintenance | Medium | High | Low | Low |
| Hydrogen Commercial-Vehicle Logistics | Medium | Medium | High | High |
| Subscription / Pay-Per-Use Ownership | High | Medium-High | Low | Medium |
Global Automotive Market _ Segment Intelligence
Every dimension of segmentation tells a different growth story, and the complete report decomposes value and volume across each of the following: by vehicle type (passenger cars — hatchback, sedan, SUV, MPV, luxury; commercial vehicles — LCV, MCV, HCV, buses; two-wheelers — motorcycles, scooters, mopeds; three-wheelers; and off-highway vehicles spanning agricultural, construction and mining equipment); by propulsion type (internal combustion across gasoline, diesel, CNG and LPG; hybrid and plug-in hybrid; battery-electric; and fuel-cell electric); by powertrain layout (FWD, RWD, AWD, 4WD); by fuel type (petrol, diesel, CNG, LNG, LPG, electricity, hydrogen, biofuels); by vehicle class (economy, mid-range, premium, luxury, ultra-luxury); by sales channel (OEM versus aftermarket); by end user (individual consumers, fleet operators, government and defense, commercial logistics, ride-hailing and mobility providers); by application (personal transportation, passenger transport, freight and logistics, construction, agriculture, mining, municipal services, defense); by level of automation (conventional, ADAS-enabled, semi-autonomous, autonomous); and by connectivity (non-connected, connected, and fully software-defined vehicles)
SEGMENTATION SUNBURST ] Multi-ring sunburst chart — vehicle type as the inner ring, propulsion type as the middle ring, and automation/connectivity level as the outer ring — sized by 2025 revenue share.
Global Automotive Market Trends and Technology Roadmap
Key innovations are reshaping vehicle architecture and manufacturing economics simultaneously. Zonal and centralized electrical-electronic architecture is trimming wiring-harness weight by up to 30 percent while freeing compute capacity for new features. Over-the-air update infrastructure converts a vehicle sold today into a platform that keeps generating revenue years later. AI-driven predictive maintenance is simultaneously reducing warranty costs and lengthening customer retention. Digital-twin technology has entered plant design outright, and autonomous-vehicle platforms — growing at 24.37 percent CAGR from USD 220.58 billion in 2026 to USD 656.37 billion by 2031 — represent the single fastest-compounding technology layer in the industry.
Disruption Timeline (2025–2040)
• 2025 — Software-defined-vehicle architecture reaches mainstream OEM adoption
• 2026 — AI-native vehicle configurators and generative-AI service assistants scale industry-wide
• 2027 — Battery pack costs cross below the ICE cost-parity threshold in most major markets
• 2028 — EV profitability parity reached across mainstream (non-luxury) segments
• 2029 — Level 3 autonomy scales beyond pilot metros into mainstream commercial deployment
• 2030 — ICE new-vehicle demand enters structural decline across OECD markets
• 2032 — Autonomous mobility fleets expand into second-tier global cities
• 2035 — Zero-emission new-vehicle sales targets take effect across multiple major economies
• 2040 — Circular-economy battery and material recovery becomes a standard OEM supply source rather than an exception
DISRUPTION TIMELINE ] Horizontal roadmap graphic plotting all nine milestones above on a 2025–2040 axis, annotated with adoption-curve intensity bands.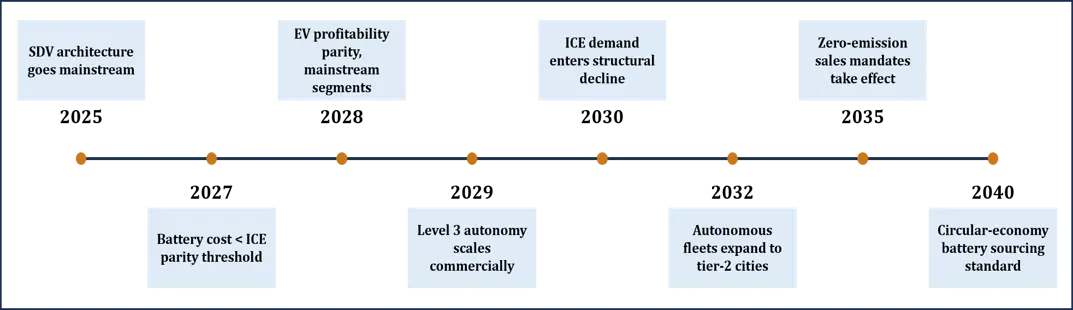
Global Automotive EV Market Transition
Vehicle electrification is one of the most significant structural shifts affecting the global automotive market. Battery-electric vehicles, hybrid vehicles and plug-in hybrid vehicles are changing powertrain economics, vehicle architecture, supply chains, manufacturing investments and consumer purchasing behavior. EV adoption is supported by emissions regulations, government incentives, battery technology improvements, charging infrastructure expansion and increasing model availability. The transition is also shifting value creation toward batteries, power electronics, software, charging infrastructure and energy-management systems. Then use your existing EV analysis.
Automotive Software and Software-Defined Vehicle Market
Software-defined vehicles are creating a new layer of value within the global automotive market by enabling over-the-air updates, connected services, subscription features, predictive maintenance, digital customer experiences and data-driven monetization. As software content per vehicle increases, OEMs and Tier-1 suppliers are increasingly competing on software architecture, computing platforms, cybersecurity, connectivity and recurring digital revenue rather than vehicle hardware alone.
Then your existing:
• Software Platform
• OTA monetization
• AI Platform
• Connected Data Economy
Global Automotive Market Regulatory Landscape
Regulation is not a background variable in this industry — it is a direct line item on every OEM's cost sheet. Euro 7 tailpipe standards add USD 1,400–1,900 in compliance cost per combustion vehicle from 2025. California's zero-emission mandate requires 100 percent zero-emission new-vehicle sales by 2035, forcing national product-roadmap realignment for any OEM selling into that market. The EU's General Safety Regulation Phase 2 has made automatic emergency braking and lane-keep assist mandatory on every new model since July 2024, converting ADAS from an option into baseline compliance cost. The US CHIPS and Science Act is redirecting fabrication capacity toward automotive-grade semiconductors, while India's production-linked incentive scheme is reshaping where small-car manufacturing capacity gets built. Compliance cost, demand timing and margin structure are now inseparable from the regulatory calendar.
Global Automotive Market Regional Analysis
Region-by-region, the automotive industry does not have one winner — it has several, each winning a different game. Asia-Pacific is the volume region, commanding 53.11 percent of global vehicle sales and growing at 3.85 percent CAGR — simultaneously the largest and fastest-growing region. Europe is the innovation and regulatory-leadership region, where Euro 7 compliance cost is functionally accelerating electrification faster than consumer preference alone would. North America is the profit and premium-technology region, anchored by federal EV incentives and the continent's deepest ADAS and autonomy investment. Southeast Asia and India represent the emerging, underpenetrated region, where production-linked incentives and urbanization are building first-time-ownership demand from scratch. The Middle East is the highest-risk, highest-optionality region, layering EV import acceleration on top of continued combustion-vehicle demand. And Mexico stands out as the export-manufacturing powerhouse, having shipped 3.6 million vehicles in 2024 under USMCA rules of origin.
REGIONAL OPPORTUNITY MATRIX ] 2x2 or radar chart classifying each region simultaneously as Volume Leader, Profit Leader, Innovation Leader, Emerging Opportunity, and Risk Concentration, sized by 2025 vehicle-sales share.
Global Automotive Market Competitive Landscape
The Global Automotive Market remains highly competitive, with major OEMs competing across vehicle scale, electrification, software capabilities, autonomous driving, manufacturing efficiency, supply-chain resilience and regional presence. Leading companies include Toyota, Volkswagen, Hyundai, General Motors, Stellantis, Ford, Honda, BMW, Mercedes-Benz, SAIC, Geely, Tata Motors, Nissan, Kia, BYD and Tesla. Competitive differentiation is increasingly shifting from vehicle volume alone toward EV transition speed, software capabilities, battery access, connected services, autonomous-driving technology and ecosystem partnerships.
We map 35-plus competitors into four strategic quadrants. Leaders (Toyota, Volkswagen, General Motors, BYD) combine global manufacturing scale with accelerating electrification capex. Innovators (Hyundai, Tesla, BMW) differentiate through in-house software architecture, autonomous-driving partnerships, and premium electrification. Fast Movers (SAIC, Geely, Changan, VinFast) are converting export-oriented EV manufacturing into rapid global share capture at price points legacy portfolios cannot match. Niche Specialists (Bosch, Denso, Continental, BorgWarner, Nidec, Magna, Valeo, CATL, LG Energy Solution) deliver the sensor, motor and cell technology every OEM ultimately depends on, regardless of brand. The clearest signal inside this competitive set: BYD delivered approximately 2.26 million battery-electric vehicles in 2025, a 28 percent year-on-year increase, overtaking Tesla to become the world's largest single-brand BEV seller with 12.1 percent global share against Tesla's 8.8 percent.
COMPETITIVE LEADERSHIP RADAR ] Radar/spider chart scoring the top 10 OEMs across five axes — Manufacturing Scale, Software Capability, EV Transition Speed, Financial Strength, Innovation Pipeline.
Recent Developments of Global Automotive Market (Last 24 Months)
• BYD overtook Tesla to become the world's largest single-brand BEV seller, delivering ~2.26 million units in 2025.
• Volkswagen committed USD 5.8 billion into Rivian to co-develop next-generation EV platforms.
• Hyundai licensed NVIDIA's Level-3 autonomous-driving stack rather than building the capability in-house.
• Ford secured licensed access to a rival's Supercharger network rather than building a competing footprint.
• BMW scheduled the global debut of its Neue Klasse-based iX3, featuring 30% faster charging and solid-state-ready battery architecture.
• VinFast opened a second Vietnam plant, adding 200,000 units of annual EV production capacity.
• CATL and LG Energy Solution expanded ten-year co-located battery-supply agreements with multiple global OEMs.
Global Automotive Market - Customer Experience & Digital CX Intelligence
The purchase and ownership journey has become as competitive a battleground as the vehicle itself. OEMs are increasingly measured on a Digital CX Maturity Index spanning online reputation management, dealer-locator and local-search optimization, and end-to-end digital touchpoint continuity from first search to post-sale service. AI-powered customer engagement — conversational service scheduling, personalized configurators, predictive-maintenance alerts — is converting the dealership relationship from a twice-a-decade transaction into a continuous, data-rich engagement. Voice-of-customer analysis remains the least mature pillar industry-wide, leaving a clear white-space opportunity for whoever closes that feedback loop first.
Future Scenario Planning (2025–2040)
| Scenario | Key Assumption | 2032 Outcome |
| Optimistic | Battery cost curve accelerates faster than forecast; policy support holds | EV share exceeds 40% of new sales; software margin pool crosses 25% of industry profit |
| Base Case | Current electrification, regulatory and technology trajectories continue | EV share reaches 25–30%; software margin pool reaches 18–20% of industry profit |
| Pessimistic | Critical-mineral shortages and policy reversal slow electrification | EV share stalls below 18%; ICE asset write-downs accelerate across Europe and Japan |
SCENARIO FAN CHART ] Fan chart showing three diverging EV-penetration trajectories (optimistic/base/pessimistic) from 2025 to 2040, with the base case as the central line.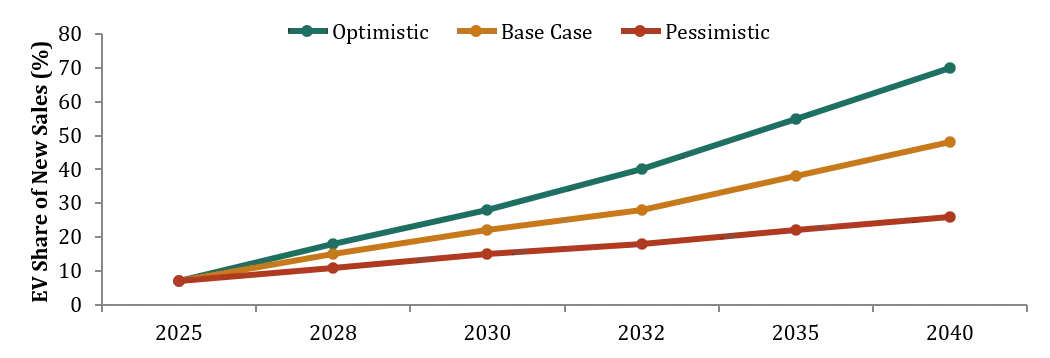
White Space Mapping in Global Automotive Market
• Battery recycling and second-life storage — structurally under-invested relative to forecast EV retirement volumes
• Rural India and Southeast Asia two-wheeler electrification — high volume, low current EV penetration
• Fleet telematics and predictive-maintenance-as-a-service — low competitive density, high recurring-margin potential
• Africa's CKD assembly ecosystem — early-stage, policy-supported, structurally under-covered by global OEMs
• Vehicle-data monetization and insurance-telematics licensing — smallest profit pool today, among the highest-margin by 2035
• Hydrogen commercial-freight corridors — niche today, but the only viable zero-emission path for heavy long-haul duty cycles
Investment Heat Map & Supply Chain Risk Radar
| Segment | Growth | Profitability | Competition | Investment Score |
| Battery-Electric Vehicles | High | High | High | ★★★★★ |
| Connected / Software-Defined Vehicles | Very High | Very High | Medium | ★★★★★ |
| Autonomous Mobility Platforms | Very High | High (long-horizon) | Low | ★★★★☆ |
| Hydrogen Fuel-Cell Vehicles | Medium | Medium | Low | ★★★☆☆ |
| Internal Combustion Engine | Low | Medium | High | ★★☆☆☆ |
| Critical Material | Geopolitical Risk | Price Volatility | Supplier Concentration | Recycling Readiness |
| Lithium | High | High | High | Low-Medium |
| Nickel | Medium | High | Medium | Low |
| Cobalt | Very High | High | Very High (DRC-concentrated) | Low |
| Graphite | High | Medium | High (China-concentrated) | Low |
| Rare Earths | High | Medium | Very High | Very Low |
| Semiconductor Wafers | Medium | High | High (Taiwan/Korea-concentrated) | N/A |
SUPPLY CHAIN RISK RADAR ] Radar chart plotting all six critical materials across four risk axes (geopolitical, price volatility, supplier concentration, recycling readiness) to visualize which inputs carry compounding risk.
Strategic Recommendations of Global Automotive Market
A phased approach balances speed to market, regulatory compliance and capital discipline across the 2025–2032 window. From 2025–2027, prioritize securing battery and semiconductor supply-chain redundancy, expanding software subscription infrastructure, and pursuing selective ecosystem alliances rather than building every capability internally. From 2028–2030, scale electrified platforms across emerging Asia-Pacific and Latin American markets, deepen direct-to-consumer and subscription-based distribution, and integrate AI-driven predictive-maintenance infrastructure across the installed base. From 2031–2032, pursue full software-defined-vehicle platform maturity, circular-economy integration, and disciplined divestment of legacy internal-combustion tooling that no longer clears its cost of capital.
CXO Recommendations by Stakeholder
• Investors: overweight software, battery-offtake, and charging-infrastructure exposure; underweight pure-play legacy ICE tooling assets.
• OEMs: treat software cadence as a core capital-allocation category, not an IT line item; pursue alliances over in-house builds where the capability gap exceeds 18 months.
• Tier-1 Suppliers: attach software and data services to every hardware sale, or accept margin flattening as the default trajectory.
• Government & Policy Bodies: align incentive timing with battery-cost-curve realism to avoid demand cliffs when subsidies expire.
• Private Equity: prioritize battery-recycling, fleet-telematics, and CX/dealer-technology roll-ups — high fragmentation, low current competitive density.
• Startups & Technology Providers: target the white-space layer directly (data monetization, voice-of-customer, battery second-life) rather than competing head-on with OEM-scale capital.
CEO Dashboard — One-Minute Market Summary
| Metric | Answer |
| Biggest Opportunity | Software subscription & OTA monetization (40%+ margin) |
| Biggest Risk | Critical-mineral supply concentration (lithium, cobalt, rare earths) |
| Most Attractive Region | Asia-Pacific (largest + fastest-growing simultaneously) |
| Fastest-Growing Segment | Autonomous vehicle platforms (24.37% CAGR) |
| Highest-Margin Segment | Software & connectivity services |
| Highest-Investment Region | North America (premium tech + federal EV incentives) |
| Top Technology to Watch | Software-defined vehicle architecture |
| Top Acquisition Target Type | Battery-recycling and fleet-telematics platforms |
| Top Regulatory Risk | Euro 7 / zero-emission mandate misalignment with battery-cost timing |
Global Automotive Market Scope: Inquire before buying
| Report Coverage | Details |
| Base Year | 2025 |
| Forecast Period | 2026 – 2032 |
| Historical Data | 2020 – 2025 |
| Market Size in 2025 | USD 2.75 Trillion (vehicle-transaction) / USD 4.36 Trillion (full-stack) |
| Forecast CAGR | 3.46% (vehicle-transaction) / 6.92% (full-stack) |
| Segments Covered — Global Automotive Market by Vehicle Type | Passenger Cars | Two-Wheeler | Three-Wheeler | Commercial Vehicles | Off-Highway Vehicles |
| Segments Covered — Global Automotive Market by Propulsion Type | Internal Combustion Engine | Hybrid | Electric Vehicle | Fuel-Cell EV |
| Segments Covered — Global Automotive Market By Application | Personal | Commercial | Public Transport | Industrial Use |
| Segments Covered — Global Automotive Market By Ownership Model | Individual | Fleet | Subscription-Based | Shared Mobility |
| Segments Covered — Global Automotive Market By Sales Channel | OEM Dealers | Independent Dealers | Online Platforms | Direct-to-Consumer |
Global Automotive Market, by Region
North America (United States, Canada, Mexico)
Europe (Germany, United Kingdom, France, Italy, Spain, Russia, Rest of Europe)
Asia-Pacific (China, India, Japan, South Korea, Rest of Asia-Pacific)
Middle East & Africa (UAE, Saudi Arabia, Turkey, Egypt, South Africa, Rest of MEA)
South America (Brazil, Argentina, Rest of South America)
Global Automotive Market, Key Players Are
1) Toyota Motor Corporation
2) Volkswagen AG
3) Hyundai Motor Company
4) General Motors Company
5) Stellantis N.V.
6) Ford Motor Company
7) Honda Motor Co., Ltd.
8) BMW AG
9) Mercedes-Benz Group AG
10) SAIC Motor Corp., Ltd.
11) Geely Holding Inc.
12) Tata Motors Limited
13) Nissan Motor Co., Ltd
14) Kia Corporation
15) BYD Auto Co., Ltd.
16) Tesla Inc.
17) FAW Group
18) Changan Automobile Group
19) Isuzu Motors Ltd.
20) Suzuki Motor Corporation
21) AB Volvo
22) Hero MotoCorp Limited
23) Yamaha Motor Co. Ltd.
24) Piaggio S.p.A
25) Robert Bosch GmbH
26) Denso Corporation
27) Continental AG
28) BorgWarner Inc.
29) Nidec Corporation
30) Mahle GmbH
31) Magna International
32) Valeo S.A.
33) Siemens AG
34) Mitsubishi Electric Corporation
35) CATL
36) LG Energy Solution
37) VinFast
Others
Global Automotive Market FAQs
What is the global automotive market size in 2025?
The global automotive market was valued at USD 2.75 trillion in 2025 on a vehicle-transaction basis.
What will the global automotive market be worth in 2032?
The global automotive market is projected to reach USD 3.26 trillion by 2032, growing at a CAGR of 3.46% during 2025–2032.
What is the CAGR of the global automotive market?
The global automotive market is projected to grow at a CAGR of 3.46% during 2025–2032 on a vehicle-transaction basis.
Which region dominates the global automotive market?
Asia-Pacific dominates the global automotive market, accounting for 53.11% of global vehicle sales in 2024.
Which region is expected to grow fastest?
Asia-Pacific is expected to remain one of the fastest-growing major regional automotive markets, supported by vehicle demand, manufacturing activity, urbanization, electrification and expanding mobility requirements.
What are the major global automotive market trends?
Major trends include vehicle electrification, software-defined vehicles, connected vehicles, AI and autonomous driving, advanced driver-assistance systems, automotive semiconductor integration, OTA software updates and battery technology development.
What are the major growth drivers of the global automotive market?
Key growth drivers include rising vehicle demand in emerging markets, fleet replacement, urbanization, EV adoption, connected-vehicle adoption, technological innovation and increasing demand for advanced safety and convenience features.
What are the major segments of the global automotive market?
The market is segmented by vehicle type, propulsion type, powertrain, fuel type, vehicle class, sales channel, end user, application, automation level, connectivity and region.
Which vehicle type dominates the global automotive market?
Passenger cars represent the largest vehicle-type segment, accounting for 72.45% of revenue share in 2024.
How is EV adoption affecting the global automotive market?
EV adoption is shifting automotive value creation toward batteries, power electronics, charging infrastructure, software, energy management and connected services while changing traditional vehicle manufacturing economics.
How are software-defined vehicles changing the automotive industry?
Software-defined vehicles enable OTA updates, connected services, subscription features, predictive maintenance and data-driven monetization, creating recurring revenue opportunities beyond the initial vehicle sale.
Who are the leading companies in the global automotive market?
Major automotive companies include Toyota, Volkswagen, Hyundai, General Motors, Stellantis, Ford, Honda, BMW, Mercedes-Benz, SAIC, Geely, Tata Motors, Nissan, Kia, BYD and Tesla.
What are the major opportunities in the global automotive market?
Major opportunities include EV technologies, automotive software, charging infrastructure, battery recycling, autonomous mobility, fleet telematics, predictive maintenance, connected services and emerging-market vehicle electrification.
Where are automotive industry profit pools migrating?
Automotive profit pools are increasingly shifting beyond traditional vehicle manufacturing toward software, connectivity, charging, batteries, data-enabled services and other technology-intensive value pools.
What are the major risks facing the global automotive industry?
Major risks include critical-mineral supply concentration, semiconductor availability, regulatory changes, EV adoption uncertainty, legacy ICE asset exposure, cybersecurity risks and shortages of software and AI talent.