Application Performance Monitoring Market: Global Industry Analysis and Forecast (2024-2030)

The Application Performance Monitoring Market is projected to grow at a CAGR of 12.1% through 2030 and is currently valued at USD 7.40 Bn. in 2023. The Application Performance Monitoring Market is expected to reach USD 16.45 Bn. by 2030

Application Performance Monitoring Market Overview

Application Performance Monitoring tracks and oversees software application performance, availability, and user experience. To find bottlenecks, and anomalies, and optimize application performance, entails gathering data on response time, resource utilization, and error rates. APM tools and solutions give insights and diagnostics to help organizations run their applications smoothly, discover and address issues quickly, and create a flawless user experience. The Application Performance Monitoring (APM) market is projected to grow at a significant rate with a CAGR of 12.1 % over the forecast period. The market size is expected to reach 16.45 Bn USD by 2030. Cloud computing is a major driver of APM market growth, as it necessitates efficient monitoring and management of complex cloud-based applications. APM solutions help businesses identify and resolve performance issues quickly, improving user experience and minimizing financial risks. The rise of big data analytics is also contributing to the APM market's growth, as businesses recognize the importance of utilizing application data for performance optimization and issue identification. However, the market faces challenges due to a lack of awareness among end-users about the benefits of APM solutions and the complexity involved in their implementation and management. Efforts to educate businesses about APM, improve user-friendliness, and provide training and support can help overcome these challenges. North America, Europe, and Asia-Pacific are the leading regions driving the APM market, with cloud computing adoption and customer experience prioritization being key factors. The market is segmented based on deployment, enterprise size, industry, component, monitoring type, technology, region, and end-user. Leading vendors in the APM market include New Relic, Dynatrace, AppDynamics, IBM, and SolarWinds, which offer a range of APM solutions with varying features and capabilities. Application Performance Monitoring Market Research Methodology The report on the Application Performance Monitoring Market covers an in-depth analysis of the industry. Key insights of the report include the Application Performance Monitoring Market size and the growth rate. A thorough regional analysis of the Application Performance Monitoring industry is conducted at a global, regional, and country level. Such an analysis provides valuable information on market penetration, regional dominance, and growth strategies adopted by the key players in the market. The major countries in each region are mapped according to their revenue contribution to the global Application Performance Monitoring Market. To understand the competitive landscape of the Application Performance Monitoring Market, key players and new entrants in the market are listed. Growth indicators such as company profiles, revenue, and share, core competitors, recent developments, new growth strategies, technological advancements and mergers and acquisitions are covered. The report provides a competitive analysis of Application Performance Monitoring Market drivers, restraints, opportunities, and growth strategies. PESTLE, SWOT and Porter’s five forces were used for industry analysis of the Application Performance Monitoring Market. Swot analysis is used to identify the strength and weaknesses of the market. The bottom-up approach was used to estimate the Application Performance Monitoring Market size. The report includes the Application Performance Monitoring Market’s major strategic developments, comprising R&D, new product launches, M&A, partnerships, agreements, collaborations, joint ventures, and regional growth of the key competitors. The report includes an analysis of the global, regional and country levels.Application Performance Monitoring Market
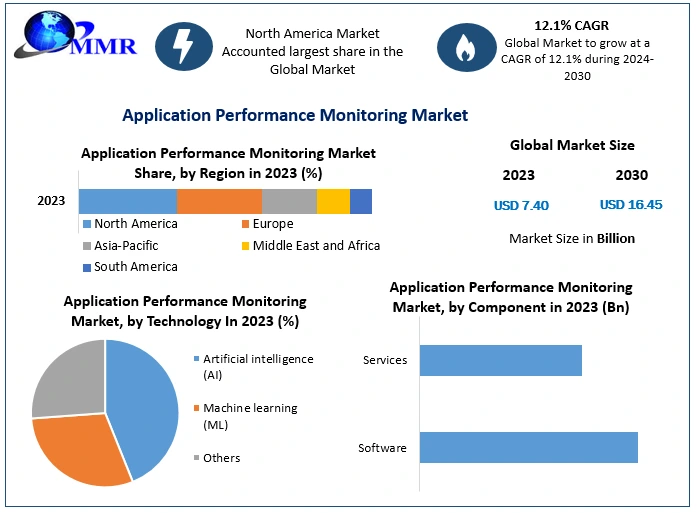
To know about the Research Methodology :- Request Free Sample Report

Application Performance Monitoring Market Dynamics

The increasing usage of cloud computing is driving the Application Performance Monitoring Market Cloud computing is fuelling APM market growth. The analysis anticipates rapid cloud computing market expansion. Cloud computing will expand 17.5% from $371.2 billion in 2021 to $832.1 billion in 2025. This rise is driven by all-business cloud usage. Cloud apps are more complicated. They are often distributed across multiple cloud providers and regions, complicating monitoring and management. Businesses must optimise their cloud-based applications for a seamless user experience. In the cloud, APM solutions help companies identify and fix performance issues quickly. Cloud-based application performance issues can cause user dissatisfaction and poor business results. APM solutions help businesses identify performance issues early and fix them before they affect users. Statistics show that cloud computing is driving the APM market. 75% of businesses had cloud performance issues last year. Cloud performance issues typically cost $100,000. As businesses adopt cloud computing, these statistics demonstrate the need for APM solutions. Businesses need APM solutions to proactively identify and fix performance issues in their cloud-based apps. They can improve user experience, reduce financial risks from performance issues, and stay competitive in the rapidly changing cloud computing landscape by doing so. The Rise of big data analytics is driving the Application Performance Monitoring market Big data analytics is driving the Application Performance Monitoring (APM) market. As businesses generate more data, using it for decision-making, trend analysis, and performance optimization is crucial. APM solutions help businesses collect and analyze application data, improving performance and identifying potential issues. APM solutions enable businesses to efficiently collect and analyze application data across many metrics and indicators. Businesses can identify performance bottlenecks, track trends, and prevent issues. APM solutions also help businesses understand application performance dynamics by correSouthg data from multiple sources. Big data analytics using APM solutions improves performance. APM solutions eliminate application performance constraints. User experience, productivity, and resource efficiency improve. Statistics show that big data analytics is driving APM market growth. The research predicts the global big data analytics market will grow from $182 billion in 2021 to $331 billion in 2025. 70% of companies think big data analytics will help them succeed in five years. These statistics show that big data analytics is driving demand for APM solutions. Businesses realize the importance of effectively using application data to optimize performance and anticipate issues. APM solutions are essential for businesses using big data analytics for informed decision-making, superior performance, and sustained competitive advantage. Lack of awareness is a restraining factor for the Application Performance Monitoring Market End-user ignorance may limit the Application Performance Monitoring (APM) market. APM solutions are still undervalued by many companies. Dynatrace found that 25% of companies understand APM. This suggests that most companies are unaware of APM's performance, bottleneck, and uptime benefits. Even firms that know about APM don't grasp how it can benefit them. This lack of understanding discourages businesses from investing in APM solutions, slowing industry growth. Statistics show that APM end-users lack of awareness may limit the market. The report predicts the worldwide APM market will rise from $6.3 billion in 2021 to $14.8 billion in 2028. The survey also notes that end-user awareness may hamper market expansion. Also, only 15% of organisations had mature APM programmes, indicating that most businesses have yet to fully harness APM's benefits. These numbers demonstrate the serious problem of end-user APM market awareness. Businesses are less likely to invest in APM solutions if they don't understand their value or benefits. Thus, this limitation may slow APM market growth. Several methods can address end-users’ ignorance. Businesses must first learn about APM and its benefits. Webinars, white papers, and other marketing materials can show how APM optimises application performance.

Application Performance Monitoring Market Regional Insights:

North America, Europe, and Asia-Pacific drive the Application Performance Monitoring (APM) market. Due to cloud computing penetration, North America is the largest APM market. Cloud-based apps require efficient APM solutions to work well. The region's focus on customer experience boosts APM demand. APM improves customer happiness by quickly identifying and fixing performance issues. North America's market is rising because of APM awareness. Europe becomes the second-largest APM market, growing 12.5% from 2021 to 2028. Cloud computing use is rising, driving APM demand. European companies prioritise customer satisfaction, requiring quick application performance. Businesses are realising APM's usefulness in boosting performance and customer satisfaction. Asia-Pacific is the third-largest APM market, growing 13.8% during the projection period. Cloud computing is growing in the region, requiring APM solutions to monitor and manage sophisticated cloud-based applications. Asia-Pacific companies prioritise customer experience and flawless application performance. Awareness of APM's relevance increases regional demand for APM solutions. South America, the Middle East, and Africa will also see significant APM market expansion. Cloud computing, customer experience, and APM awareness drive the APM market in North America, Europe, and Asia-Pacific. These regions fuel the APM market's growth, but others do too.

Application Performance Monitoring Market Segment Analysis:

The Application Performance Monitoring (APM) market is segmented by a number of factors, including deployment, enterprise size, industry, component, monitoring type, technology, region, and end-user. Deployment: On-premises and cloud-based deployments divide the APM industry. Customer-installed APM systems are handled on-site. Cloud-based APM systems are vendor-hosted. Due to the commercial acceptance of cloud computing, the cloud-based segment will increase quicker. Enterprise size: SMEs and big companies comprise the Application Performance Monitoring market. SMEs employ less than 1,000 people. Large organizations employ over 1,000 people. Due to their rising demand for APM solutions, big companies are likely to dominate the market throughout the forecast period. Industry: BFSI, IT and telecom, retail and e-commerce, healthcare, education, media and entertainment, manufacturing, and others comprise the Application Performance Monitoring market. Bank, financial, and insurance are BFSI. IT&T stands for information technology and telecommunications. E-commerce is electronic commerce. Health care. Education is education. Entertainment is media. It's manufacturing. Other industries. Due to the bank and financial institutions’ need for APM solutions, the BFSI segment is likely to dominate the market throughout the forecast period. Component: The APM market is segmented by component into software and services. Software refers to the APM software that is used to monitor and analyze applications. Services refer to the services that are provided by APM vendors, such as installation, configuration, and maintenance. The software segment is expected to account for the majority of the market share during the forecast period, due to the increasing demand for APM software solutions. Monitoring type: Infrastructure, application, and user experience monitoring comprise the Application Performance Monitoring market. Monitoring infrastructure supports applications. Application monitoring monitors apps. Application user experience monitoring involves monitoring. Due to the rising demand for APM solutions to monitor infrastructure performance, the infrastructure monitoring sector is likely to dominate the market. Technology: The APM market is segmented by technology into artificial intelligence (AI), machine learning (ML), and others. AI stands for artificial intelligence. ML stands for machine learning. Others refer to other technologies that are used in APM solutions, such as big data and analytics. The AI and ML segments are expected to grow at a faster pace during the forecast period, due to the increasing adoption of these technologies by APM vendors. Region: North America, Europe, Asia-Pacific, South America, and MEA make up the APM market. Due to rising APM adoption in North America, the region is likely to dominate the market.

Application Performance Monitoring Market Competitive Landscape:

The report has in detail information about the Strategies adopted by the following key companies to sustain and grow in the market. These Application Performance Monitoring Manufacturers covered in the report are selected on the basis of certain criteria. Leading manufacturers operate in the Application Performance Monitoring (APM) market. New Relic, Dynatrace, AppDynamics, IBM, and SolarWinds are APM leaders. APM solutions from these manufacturers vary in features and capabilities. Recent APM market advancements have been important. Cloud-based APM solutions are gaining popularity. Scalability, flexibility, and cost-effectiveness distinguish cloud-based APM solutions from on-premises ones. AI and ML usage in APM has also increased. AI and ML are improving root cause analysis and anomaly detection in APM solutions. Government policies also affect the Application Performance Monitoring market. The APM market has prioritised data protection and security due to the EU's GDPR. The APM market is changing. Cloud-based APM solutions, AI and ML technology, and government legislation will drive market growth. For instance, New Relic announced its Microsoft Azure Alliance expansion in February 2023. This cooperation brings New Relic's APM solutions to Microsoft Azure enterprises. Dynatrace added increased observability and AIOps to AWS Compute Optimizer in November 2022. This integration will help organisations optimise their Amazon Web Services (AWS) workloads and performance. These are some recent APM market developments. Staying abreast of market trends and developments is crucial.

Application Performance Monitoring Market Scope: Inquire Before Buying

Global Application Performance Monitoring Market
Report Coverage Details
Base Year: 2023 Forecast Period: 2024-2030
Historical Data: 2018 to 2023 Market Size in 2023: US $ 7.40 Bn.
Forecast Period 2023 to 2030 CAGR: 12.1% Market Size in 2030: US $ 16.45 Bn.
Segments Covered: by Deployment On-premises Cloud-based
by Enterprise Size SMEs Large companies
by Industry BFSI IT and telecom Retail and e-commerce Healthcare Education Media Entertainment Manufacturing Others
by Component Software Services
by Monitoring Type Infrastructure Application User experience monitoring
by Technology Artificial intelligence (AI) Machine learning (ML) Others

Application Performance Monitoring Market, by Region

North America (United States, Canada and Mexico) Europe (UK, France, Germany, Italy, Spain, Sweden, Austria, Turkey, Russia and Rest of Europe) Asia Pacific (China, India, Japan, South Korea, Australia, ASEAN and Rest of APAC) Middle East and Africa (South Africa, GCC, Egypt, Nigeria and Rest of ME&A) South America (Brazil, Argentina, Columbia and Rest of South America)

Application Performance Monitoring Market, Key Players are:

The report has in detail information about the Strategies adopted by the following key companies to sustain and grow in the market. These Application Performance Monitoring Manufacturers covered in the report are selected on the basis of certain criteria. 1. AppDynamics (Santa Clara, CA) 2. Datadog (New York, NY) 3. Dynatrace (Boston, MA) 4. IBM (Armonk, NY) 5. Micro Focus (Newbury, United Kingdom) 6. New Relic (Burlington, MA) 7. Oracle (Redwood Shores, CA) 8. SolarWinds (Austin, TX) 9. Splunk (San Francisco, CA) 10. AppNeta (Burlington, MA) 11. Aternity (Mountain View, CA) 12. Coralogix (Tel Aviv, Israel) 13. Elastic (Mountain View, CA) 14. ELK Stack (various) 15. Fiddler (San Francisco, CA) 16. Honeycomb (San Francisco, CA) 17. Lightstep (San Francisco, CA) 18. Micro Focus Covalence (various) 19. Nagios (Portland, OR) 20. Prometheus (various) 21. Sematext (Tel Aviv, Israel) 22. Site24x7 (Mumbai, India) 23. Stackdriver (Mountain View, CA) 24. Wavefront (Santa Clara, CA) FAQs: 1. What are the growth drivers for the Application Performance Monitoring Market? Ans: The increasing usage of cloud computing along with the use of big data is driving the Application Performance Monitoring Market 2. What is the major restraint for the Application Performance Monitoring Market growth? Ans: The complexity of APM solutions can restrain the Application Performance Monitoring Market 3. Which region is leading the global Application Performance Monitoring Market during the forecast period? Ans: North America is leading the global Application Performance Monitoring Market. 4. What is the projected market size & growth rate of the Application Performance Monitoring Market? Ans: The market size is been forecasted to reach the value of 16.45 Bn USD by the year 2030 with a CAGR of 12.1 % 5. What segments are covered in the Application Performance Monitoring Market report? Ans: Segmentation based on deployment, application, enterprise size and monitoring type is been covered in the Application Performance Monitoring Market report.
1. Application Performance Monitoring Market Introduction 1.1. Study Assumption and Market Definition 1.2. Scope of the Study 1.3. Executive Summary 2. Application Performance Monitoring Market: Dynamics 2.1. Application Performance Monitoring Market Trends by Region 2.1.1. North America Application Performance Monitoring Market Trends 2.1.2. Europe Application Performance Monitoring Market Trends 2.1.3. Asia Pacific Application Performance Monitoring Market Trends 2.1.4. Middle East and Africa Application Performance Monitoring Market Trends 2.1.5. South America Application Performance Monitoring Market Trends 2.2. Application Performance Monitoring Market Dynamics by Region 2.2.1. North America 2.2.1.1. North America Application Performance Monitoring Market Drivers 2.2.1.2. North America Application Performance Monitoring Market Restraints 2.2.1.3. North America Application Performance Monitoring Market Opportunities 2.2.1.4. North America Application Performance Monitoring Market Challenges 2.2.2. Europe 2.2.2.1. Europe Application Performance Monitoring Market Drivers 2.2.2.2. Europe Application Performance Monitoring Market Restraints 2.2.2.3. Europe Application Performance Monitoring Market Opportunities 2.2.2.4. Europe Application Performance Monitoring Market Challenges 2.2.3. Asia Pacific 2.2.3.1. Asia Pacific Application Performance Monitoring Market Drivers 2.2.3.2. Asia Pacific Application Performance Monitoring Market Restraints 2.2.3.3. Asia Pacific Application Performance Monitoring Market Opportunities 2.2.3.4. Asia Pacific Application Performance Monitoring Market Challenges 2.2.4. Middle East and Africa 2.2.4.1. Middle East and Africa Application Performance Monitoring Market Drivers 2.2.4.2. Middle East and Africa Application Performance Monitoring Market Restraints 2.2.4.3. Middle East and Africa Application Performance Monitoring Market Opportunities 2.2.4.4. Middle East and Africa Application Performance Monitoring Market Challenges 2.2.5. South America 2.2.5.1. South America Application Performance Monitoring Market Drivers 2.2.5.2. South America Application Performance Monitoring Market Restraints 2.2.5.3. South America Application Performance Monitoring Market Opportunities 2.2.5.4. South America Application Performance Monitoring Market Challenges 2.3. PORTER’s Five Forces Analysis 2.4. PESTLE Analysis 2.5. Technology Roadmap 2.6. Regulatory Landscape by Region 2.6.1. North America 2.6.2. Europe 2.6.3. Asia Pacific 2.6.4. Middle East and Africa 2.6.5. South America 2.7. Key Opinion Leader Analysis For Application Performance Monitoring Industry 2.8. Analysis of Government Schemes and Initiatives For Application Performance Monitoring Industry 2.9. Application Performance Monitoring Market Trade Analysis 2.10. The Global Pandemic Impact on Application Performance Monitoring Market 3. Application Performance Monitoring Market: Global Market Size and Forecast by Segmentation by Demand and Supply Side (by Value in USD Million) 2023-2030 3.1. Application Performance Monitoring Market Size and Forecast, by Deployment (2023-2030) 3.1.1. On-premises 3.1.2. Cloud-based 3.2. Application Performance Monitoring Market Size and Forecast, by Enterprise Size (2023-2030) 3.2.1. SMEs 3.2.2. Large companies 3.3. Application Performance Monitoring Market Size and Forecast, by Industry (2023-2030) 3.3.1. BFSI 3.3.2. IT and telecom 3.3.3. Retail and e-commerce 3.3.4. Healthcare 3.3.5. Education 3.3.6. Media 3.3.7. Entertainment 3.3.8. Manufacturing 3.3.9. Others 3.4. Application Performance Monitoring Market Size and Forecast, by Component (2023-2030) 3.4.1. Software 3.4.2. Services 3.5. Application Performance Monitoring Market Size and Forecast, by Monitoring Type (2023-2030) 3.5.1. Infrastructure Application 3.5.2. User experience monitoring 3.6. Application Performance Monitoring Market Size and Forecast, by Technology (2023-2030) 3.6.1. Artificial intelligence (AI) 3.6.2. Machine learning (ML) 3.6.3. Others 3.7. Application Performance Monitoring Market Size and Forecast, by Region (2023-2030) 3.7.1. North America 3.7.2. Europe 3.7.3. Asia Pacific 3.7.4. Middle East and Africa 3.7.5. South America 4. North America Application Performance Monitoring Market Size and Forecast by Segmentation (by Value in USD Million) 2023-2030 4.1. North America Application Performance Monitoring Market Size and Forecast, by Deployment (2023-2030) 4.1.1. On-premises 4.1.2. Cloud-based 4.2. North America Application Performance Monitoring Market Size and Forecast, by Enterprise Size (2023-2030) 4.2.1. SMEs 4.2.2. Large companies 4.3. North America Application Performance Monitoring Market Size and Forecast, by Industry (2023-2030) 4.3.1. BFSI 4.3.2. IT and telecom 4.3.3. Retail and e-commerce 4.3.4. Healthcare 4.3.5. Education 4.3.6. Media 4.3.7. Entertainment 4.3.8. Manufacturing 4.3.9. Others 4.4. North America Application Performance Monitoring Market Size and Forecast, by Component (2023-2030) 4.4.1. Software 4.4.2. Services 4.5. North America Application Performance Monitoring Market Size and Forecast, by Monitoring Type (2023-2030) 4.5.1. Infrastructure Application 4.5.2. User experience monitoring 4.6. North America Application Performance Monitoring Market Size and Forecast, by Technology (2023-2030) 4.6.1. Artificial intelligence (AI) 4.6.2. Machine learning (ML) 4.6.3. Others 4.7. North America Application Performance Monitoring Market Size and Forecast, by Country (2023-2030) 4.7.1. United States 4.7.1.1. United States Application Performance Monitoring Market Size and Forecast, by Deployment (2023-2030) 4.7.1.1.1. On-premises 4.7.1.1.2. Cloud-based 4.7.1.2. United States Application Performance Monitoring Market Size and Forecast, by Enterprise Size (2023-2030) 4.7.1.2.1. SMEs 4.7.1.2.2. Large companies 4.7.1.3. United States Application Performance Monitoring Market Size and Forecast, by Industry (2023-2030) 4.7.1.3.1. BFSI 4.7.1.3.2. IT and telecom 4.7.1.3.3. Retail and e-commerce 4.7.1.3.4. Healthcare 4.7.1.3.5. Education 4.7.1.3.6. Media 4.7.1.3.7. Entertainment 4.7.1.3.8. Manufacturing 4.7.1.3.9. Others 4.7.1.4. United States Application Performance Monitoring Market Size and Forecast, by Component (2023-2030) 4.7.1.4.1. Software 4.7.1.4.2. Services 4.7.1.5. United States Application Performance Monitoring Market Size and Forecast, by Monitoring Type (2023-2030) 4.7.1.5.1. Infrastructure Application 4.7.1.5.2. User experience monitoring 4.7.1.6. United States Application Performance Monitoring Market Size and Forecast, by Technology (2023-2030) 4.7.1.6.1. Artificial intelligence (AI) 4.7.1.6.2. Machine learning (ML) 4.7.1.6.3. Others 4.7.2. Canada 4.7.2.1. Canada Application Performance Monitoring Market Size and Forecast, by Deployment (2023-2030) 4.7.2.1.1. On-premises 4.7.2.1.2. Cloud-based 4.7.2.2. Canada Application Performance Monitoring Market Size and Forecast, by Enterprise Size (2023-2030) 4.7.2.2.1. SMEs 4.7.2.2.2. Large companies 4.7.2.3. Canada Application Performance Monitoring Market Size and Forecast, by Industry (2023-2030) 4.7.2.3.1. BFSI 4.7.2.3.2. IT and telecom 4.7.2.3.3. Retail and e-commerce 4.7.2.3.4. Healthcare 4.7.2.3.5. Education 4.7.2.3.6. Media 4.7.2.3.7. Entertainment 4.7.2.3.8. Manufacturing 4.7.2.3.9. Others 4.7.2.4. Canada Application Performance Monitoring Market Size and Forecast, by Component (2023-2030) 4.7.2.4.1. Software 4.7.2.4.2. Services 4.7.2.5. Canada Application Performance Monitoring Market Size and Forecast, by Monitoring Type (2023-2030) 4.7.2.5.1. Infrastructure Application 4.7.2.5.2. User experience monitoring 4.7.2.6. Canada Application Performance Monitoring Market Size and Forecast, by Technology (2023-2030) 4.7.2.6.1. Artificial intelligence (AI) 4.7.2.6.2. Machine learning (ML) 4.7.2.6.3. Others 4.7.3. Mexico 4.7.3.1. Mexico Application Performance Monitoring Market Size and Forecast, by Deployment (2023-2030) 4.7.3.1.1. On-premises 4.7.3.1.2. Cloud-based 4.7.3.2. Mexico Application Performance Monitoring Market Size and Forecast, by Enterprise Size (2023-2030) 4.7.3.2.1. SMEs 4.7.3.2.2. Large companies 4.7.3.3. Mexico Application Performance Monitoring Market Size and Forecast, by Industry (2023-2030) 4.7.3.3.1. BFSI 4.7.3.3.2. IT and telecom 4.7.3.3.3. Retail and e-commerce 4.7.3.3.4. Healthcare 4.7.3.3.5. Education 4.7.3.3.6. Media 4.7.3.3.7. Entertainment 4.7.3.3.8. Manufacturing 4.7.3.3.9. Others 4.7.3.4. Mexico Application Performance Monitoring Market Size and Forecast, by Component (2023-2030) 4.7.3.4.1. Software 4.7.3.4.2. Services 4.7.3.5. Mexico Application Performance Monitoring Market Size and Forecast, by Monitoring Type (2023-2030) 4.7.3.5.1. Infrastructure Application 4.7.3.5.2. User experience monitoring 4.7.3.6. Mexico Application Performance Monitoring Market Size and Forecast, by Technology (2023-2030) 4.7.3.6.1. Artificial intelligence (AI) 4.7.3.6.2. Machine learning (ML) 4.7.3.6.3. Others 5. Europe Application Performance Monitoring Market Size and Forecast by Segmentation (by Value in USD Million) 2023-2030 5.1. Europe Application Performance Monitoring Market Size and Forecast, by Deployment (2023-2030) 5.1. Europe Application Performance Monitoring Market Size and Forecast, by Enterprise Size (2023-2030) 5.1. Europe Application Performance Monitoring Market Size and Forecast, by Industry (2023-2030) 5.1. Europe Application Performance Monitoring Market Size and Forecast, by Component (2023-2030) 5.1. Europe Application Performance Monitoring Market Size and Forecast, by Monitoring Type (2023-2030) 5.1. Europe Application Performance Monitoring Market Size and Forecast, by Technology (2023-2030) 5.7. Europe Application Performance Monitoring Market Size and Forecast, by Country (2023-2030) 5.7.1. United Kingdom 5.7.1.1. United Kingdom Application Performance Monitoring Market Size and Forecast, by Deployment (2023-2030) 5.7.1.2. United Kingdom Application Performance Monitoring Market Size and Forecast, by Enterprise Size (2023-2030) 5.7.1.3. United Kingdom Application Performance Monitoring Market Size and Forecast, by Industry (2023-2030) 5.7.1.4. United Kingdom Application Performance Monitoring Market Size and Forecast, by Component (2023-2030) 5.7.1.5. United Kingdom Application Performance Monitoring Market Size and Forecast, by Monitoring Type (2023-2030) Application Performance Monitoring 5.7.2. France 5.7.2.1. France Application Performance Monitoring Market Size and Forecast, by Deployment (2023-2030) 5.7.2.2. France Application Performance Monitoring Market Size and Forecast, by Enterprise Size (2023-2030) 5.7.2.3. France Application Performance Monitoring Market Size and Forecast, by Industry (2023-2030) 5.7.2.4. France Application Performance Monitoring Market Size and Forecast, by Component (2023-2030) 5.7.2.5. France Application Performance Monitoring Market Size and Forecast, by Monitoring Type (2023-2030) 5.7.2.6. France Application Performance Monitoring Market Size and Forecast, by Technology (2023-2030) 5.7.3. Germany 5.7.3.1. Germany Application Performance Monitoring Market Size and Forecast, by Deployment (2023-2030) 5.7.3.2. Germany Application Performance Monitoring Market Size and Forecast, by Enterprise Size (2023-2030) 5.7.3.3. Germany Application Performance Monitoring Market Size and Forecast, by Industry (2023-2030) 5.7.3.4. Germany Application Performance Monitoring Market Size and Forecast, by Component (2023-2030) 5.7.3.5. Germany Application Performance Monitoring Market Size and Forecast, by Monitoring Type (2023-2030) 5.7.3.6. Germany Application Performance Monitoring Market Size and Forecast, by Technology (2023-2030) 5.7.4. Italy 5.7.4.1. Italy Application Performance Monitoring Market Size and Forecast, by Deployment (2023-2030) 5.7.4.2. Italy Application Performance Monitoring Market Size and Forecast, by Enterprise Size (2023-2030) 5.7.4.3. Italy Application Performance Monitoring Market Size and Forecast, by Industry (2023-2030) 5.7.4.4. Italy Application Performance Monitoring Market Size and Forecast, by Component (2023-2030) 5.7.4.5. Italy Application Performance Monitoring Market Size and Forecast, by Monitoring Type (2023-2030) 5.7.4.6. Italy Application Performance Monitoring Market Size and Forecast, by Technology (2023-2030) 5.7.5. Spain 5.7.5.1. Spain Application Performance Monitoring Market Size and Forecast, by Deployment (2023-2030) 5.7.5.2. Spain Application Performance Monitoring Market Size and Forecast, by Enterprise Size (2023-2030) 5.7.5.3. Spain Application Performance Monitoring Market Size and Forecast, by Industry (2023-2030) 5.7.5.4. Spain Application Performance Monitoring Market Size and Forecast, by Component (2023-2030) 5.7.5.5. Spain Application Performance Monitoring Market Size and Forecast, by Monitoring Type (2023-2030) 5.7.5.6. Spain Application Performance Monitoring Market Size and Forecast, by Technology (2023-2030) 5.7.6. Sweden 5.7.6.1. Sweden Application Performance Monitoring Market Size and Forecast, by Deployment (2023-2030) 5.7.6.2. Sweden Application Performance Monitoring Market Size and Forecast, by Enterprise Size (2023-2030) 5.7.6.3. Sweden Application Performance Monitoring Market Size and Forecast, by Industry (2023-2030) 5.7.6.4. Sweden Application Performance Monitoring Market Size and Forecast, by Component (2023-2030) 5.7.6.5. Sweden Application Performance Monitoring Market Size and Forecast, by Monitoring Type (2023-2030) 5.7.6.6. Sweden Application Performance Monitoring Market Size and Forecast, by Technology (2023-2030) 5.7.7. Austria 5.7.7.1. Austria Application Performance Monitoring Market Size and Forecast, by Deployment (2023-2030) 5.7.7.2. Austria Application Performance Monitoring Market Size and Forecast, by Enterprise Size (2023-2030) 5.7.7.3. Austria Application Performance Monitoring Market Size and Forecast, by Industry (2023-2030) 5.7.7.4. Austria Application Performance Monitoring Market Size and Forecast, by Component (2023-2030) 5.7.7.5. Austria Application Performance Monitoring Market Size and Forecast, by Monitoring Type (2023-2030) 5.7.7.6. Austria Application Performance Monitoring Market Size and Forecast, by Technology (2023-2030) 5.7.8. Rest of Europe 5.7.8.1. Rest of Europe Application Performance Monitoring Market Size and Forecast, by Deployment (2023-2030) 5.7.8.2. Rest of Europe Application Performance Monitoring Market Size and Forecast, by Enterprise Size (2023-2030) 5.7.8.3. Rest of Europe Application Performance Monitoring Market Size and Forecast, by Industry (2023-2030) 5.7.8.4. Rest of Europe Application Performance Monitoring Market Size and Forecast, by Component (2023-2030) 5.7.8.5. Rest of Europe Application Performance Monitoring Market Size and Forecast, by Monitoring Type (2023-2030) 5.7.8.6. Rest of Europe Application Performance Monitoring Market Size and Forecast, by Technology (2023-2030) 6. Asia Pacific Application Performance Monitoring Market Size and Forecast by Segmentation (by Value in USD Million) 2023-2030 6.1. Asia Pacific Application Performance Monitoring Market Size and Forecast, by Deployment (2023-2030) 6.2. Asia Pacific Application Performance Monitoring Market Size and Forecast, by Enterprise Size (2023-2030) 6.3. Asia Pacific Application Performance Monitoring Market Size and Forecast, by Industry (2023-2030) 6.4. Asia Pacific Application Performance Monitoring Market Size and Forecast, by Component (2023-2030) 6.5. Asia Pacific Application Performance Monitoring Market Size and Forecast, by Monitoring Type (2023-2030) 6.6. Asia Pacific Application Performance Monitoring Market Size and Forecast, by Technology (2023-2030) 6.7. Asia Pacific Application Performance Monitoring Market Size and Forecast, by Country (2023-2030) 6.7.1. China 6.7.1.1. China Application Performance Monitoring Market Size and Forecast, by Deployment (2023-2030) 6.7.1.2. China Application Performance Monitoring Market Size and Forecast, by Enterprise Size (2023-2030) 6.7.1.3. China Application Performance Monitoring Market Size and Forecast, by Industry (2023-2030) 6.7.1.4. China Application Performance Monitoring Market Size and Forecast, by Component (2023-2030) 6.7.1.5. China Application Performance Monitoring Market Size and Forecast, by Monitoring Type (2023-2030) 6.7.1.6. China Application Performance Monitoring Market Size and Forecast, by Technology (2023-2030) 6.7.2. S Korea 6.7.2.1. S Korea Application Performance Monitoring Market Size and Forecast, by Deployment (2023-2030) 6.7.2.2. S Korea Application Performance Monitoring Market Size and Forecast, by Enterprise Size (2023-2030) 6.7.2.3. S Korea Application Performance Monitoring Market Size and Forecast, by Industry (2023-2030) 6.7.2.4. S Korea Application Performance Monitoring Market Size and Forecast, by Component (2023-2030) 6.7.2.5. S Korea Application Performance Monitoring Market Size and Forecast, by Monitoring Type (2023-2030) 6.7.2.6. S Korea Application Performance Monitoring Market Size and Forecast, by Technology (2023-2030) 6.7.3. Japan 6.7.3.1. Japan Application Performance Monitoring Market Size and Forecast, by Deployment (2023-2030) 6.7.3.2. Japan Application Performance Monitoring Market Size and Forecast, by Enterprise Size (2023-2030) 6.7.3.3. Japan Application Performance Monitoring Market Size and Forecast, by Industry (2023-2030) 6.7.3.4. Japan Application Performance Monitoring Market Size and Forecast, by Component (2023-2030) 6.7.3.5. Japan Application Performance Monitoring Market Size and Forecast, by Monitoring Type (2023-2030) 6.7.3.6. Japan Application Performance Monitoring Market Size and Forecast, by Technology (2023-2030) 6.7.4. India 6.7.4.1. India Application Performance Monitoring Market Size and Forecast, by Deployment (2023-2030) 6.7.4.2. India Application Performance Monitoring Market Size and Forecast, by Enterprise Size (2023-2030) 6.7.4.3. India Application Performance Monitoring Market Size and Forecast, by Industry (2023-2030) 6.7.4.4. India Application Performance Monitoring Market Size and Forecast, by Component (2023-2030) 6.7.4.5. India Application Performance Monitoring Market Size and Forecast, by Monitoring Type (2023-2030) 6.7.4.6. India Application Performance Monitoring Market Size and Forecast, by Technology (2023-2030) 6.7.5. Australia 6.7.5.1. Australia Application Performance Monitoring Market Size and Forecast, by Deployment (2023-2030) 6.7.5.2. Australia Application Performance Monitoring Market Size and Forecast, by Enterprise Size (2023-2030) 6.7.5.3. Australia Application Performance Monitoring Market Size and Forecast, by Industry (2023-2030) 6.7.5.4. Australia Application Performance Monitoring Market Size and Forecast, by Component (2023-2030) 6.7.5.5. Australia Application Performance Monitoring Market Size and Forecast, by Monitoring Type (2023-2030) 6.7.5.6. Australia Application Performance Monitoring Market Size and Forecast, by Technology (2023-2030) 6.7.6. Indonesia 6.7.6.1. Indonesia Application Performance Monitoring Market Size and Forecast, by Deployment (2023-2030) 6.7.6.2. Indonesia Application Performance Monitoring Market Size and Forecast, by Enterprise Size (2023-2030) 6.7.6.3. Indonesia Application Performance Monitoring Market Size and Forecast, by Industry (2023-2030) 6.7.6.4. Indonesia Application Performance Monitoring Market Size and Forecast, by Component (2023-2030) 6.7.6.5. Indonesia Application Performance Monitoring Market Size and Forecast, by Monitoring Type (2023-2030) 6.7.6.6. Indonesia Application Performance Monitoring Market Size and Forecast, by Technology (2023-2030) 6.7.7. Malaysia 6.7.7.1. Malaysia Application Performance Monitoring Market Size and Forecast, by Deployment (2023-2030) 6.7.7.2. Malaysia Application Performance Monitoring Market Size and Forecast, by Enterprise Size (2023-2030) 6.7.7.3. Malaysia Application Performance Monitoring Market Size and Forecast, by Industry (2023-2030) 6.7.7.4. Malaysia Application Performance Monitoring Market Size and Forecast, by Component (2023-2030) 6.7.7.5. Malaysia Application Performance Monitoring Market Size and Forecast, by Monitoring Type (2023-2030) 6.7.7.6. Malaysia Application Performance Monitoring Market Size and Forecast, by Technology (2023-2030) 6.7.8. Vietnam 6.7.8.1. Vietnam Application Performance Monitoring Market Size and Forecast, by Deployment (2023-2030) 6.7.8.2. Vietnam Application Performance Monitoring Market Size and Forecast, by Enterprise Size (2023-2030) 6.7.8.3. Vietnam Application Performance Monitoring Market Size and Forecast, by Industry (2023-2030) 6.7.8.4. Vietnam Application Performance Monitoring Market Size and Forecast, by Component (2023-2030) 6.7.8.5. Vietnam Application Performance Monitoring Market Size and Forecast, by Monitoring Type (2023-2030) 6.7.8.6. Vietnam Application Performance Monitoring Market Size and Forecast, by Technology (2023-2030) 6.7.9. Taiwan 6.7.9.1. Taiwan Application Performance Monitoring Market Size and Forecast, by Deployment (2023-2030) 6.7.9.2. Taiwan Application Performance Monitoring Market Size and Forecast, by Enterprise Size (2023-2030) 6.7.9.3. Taiwan Application Performance Monitoring Market Size and Forecast, by Industry (2023-2030) 6.7.9.4. Taiwan Application Performance Monitoring Market Size and Forecast, by Component (2023-2030) 6.7.9.5. Taiwan Application Performance Monitoring Market Size and Forecast, by Monitoring Type (2023-2030) 6.7.9.6. Taiwan Application Performance Monitoring Market Size and Forecast, by Technology (2023-2030) 6.7.10. Rest of Asia Pacific 6.7.10.1. Rest of Asia Pacific Application Performance Monitoring Market Size and Forecast, by Deployment (2023-2030) 6.7.10.2. Rest of Asia Pacific Application Performance Monitoring Market Size and Forecast, by Enterprise Size (2023-2030) 6.7.10.3. Rest of Asia Pacific Application Performance Monitoring Market Size and Forecast, by Industry (2023-2030) 6.7.10.4. Rest of Asia Pacific Application Performance Monitoring Market Size and Forecast, by Component (2023-2030) 6.7.10.5. Rest of Asia Pacific Application Performance Monitoring Market Size and Forecast, by Monitoring Type (2023-2030) 6.7.10.6. Rest of Asia Pacific Application Performance Monitoring Market Size and Forecast, by Technology (2023-2030) 7. Middle East and Africa Application Performance Monitoring Market Size and Forecast by Segmentation (by Value in USD Million) 2023-2030 7.1. Middle East and Africa Application Performance Monitoring Market Size and Forecast, by Deployment (2023-2030) 7.2. Middle East and Africa Application Performance Monitoring Market Size and Forecast, by Enterprise Size (2023-2030) 7.3. Middle East and Africa Application Performance Monitoring Market Size and Forecast, by Industry (2023-2030) 7.4. Middle East and Africa Application Performance Monitoring Market Size and Forecast, by Component (2023-2030) 7.5. Middle East and Africa Application Performance Monitoring Market Size and Forecast, by Monitoring Type (2023-2030) 7.6. Middle East and Africa Application Performance Monitoring Market Size and Forecast, by Technology (2023-2030) 7.7. Middle East and Africa Application Performance Monitoring Market Size and Forecast, by Country (2023-2030) 7.7.1. South Africa 7.7.1.1. South Africa Application Performance Monitoring Market Size and Forecast, by Deployment (2023-2030) 7.7.1.2. South Africa Application Performance Monitoring Market Size and Forecast, by Enterprise Size (2023-2030) 7.7.1.3. South Africa Application Performance Monitoring Market Size and Forecast, by Industry (2023-2030) 7.7.1.4. South Africa Application Performance Monitoring Market Size and Forecast, by Component (2023-2030) 7.7.1.5. South Africa Application Performance Monitoring Market Size and Forecast, by Monitoring Type (2023-2030) 7.7.1.6. South Africa Application Performance Monitoring Market Size and Forecast, by Technology (2023-2030) 7.7.2. GCC 7.7.2.1. GCC Application Performance Monitoring Market Size and Forecast, by Deployment (2023-2030) 7.7.2.2. GCC Application Performance Monitoring Market Size and Forecast, by Enterprise Size (2023-2030) 7.7.2.3. GCC Application Performance Monitoring Market Size and Forecast, by Industry (2023-2030) 7.7.2.4. GCC Application Performance Monitoring Market Size and Forecast, by Component (2023-2030) 7.7.2.5. GCC Application Performance Monitoring Market Size and Forecast, by Monitoring Type (2023-2030) 7.7.2.6. GCC Application Performance Monitoring Market Size and Forecast, by Technology (2023-2030) 7.7.3. Nigeria 7.7.3.1. Nigeria Application Performance Monitoring Market Size and Forecast, by Deployment (2023-2030) 7.7.3.2. Nigeria Application Performance Monitoring Market Size and Forecast, by Enterprise Size (2023-2030) 7.7.3.3. Nigeria Application Performance Monitoring Market Size and Forecast, by Industry (2023-2030) 7.7.3.4. Nigeria Application Performance Monitoring Market Size and Forecast, by Component (2023-2030) 7.7.3.5. Nigeria Application Performance Monitoring Market Size and Forecast, by Monitoring Type (2023-2030) 7.7.3.6. Nigeria Application Performance Monitoring Market Size and Forecast, by Technology (2023-2030) 7.7.4. Rest of ME&A 7.7.4.1. Rest of ME&A Application Performance Monitoring Market Size and Forecast, by Deployment (2023-2030) 7.7.4.2. Rest of ME&A Application Performance Monitoring Market Size and Forecast, by Enterprise Size (2023-2030) 7.7.4.3. Rest of ME&A Application Performance Monitoring Market Size and Forecast, by Industry (2023-2030) 7.7.4.4. Rest of ME&A Application Performance Monitoring Market Size and Forecast, by Component (2023-2030) 7.7.4.5. Rest of ME&A Application Performance Monitoring Market Size and Forecast, by Monitoring Type (2023-2030) 7.7.4.6. Rest of ME&A Application Performance Monitoring Market Size and Forecast, by Technology (2023-2030) 8. South America Application Performance Monitoring Market Size and Forecast by Segmentation (by Value in USD Million) 2023-2030 8.1. South America Application Performance Monitoring Market Size and Forecast, by Deployment (2023-2030) 8.2. South America Application Performance Monitoring Market Size and Forecast, by Enterprise Size (2023-2030) 8.3. South America Application Performance Monitoring Market Size and Forecast, by Industry(2023-2030) 8.4. South America Application Performance Monitoring Market Size and Forecast, by Component (2023-2030) 8.5. South America Application Performance Monitoring Market Size and Forecast, by Monitoring Type (2023-2030) 8.6. South America Application Performance Monitoring Market Size and Forecast, by Technology (2023-2030) 8.7. South America Application Performance Monitoring Market Size and Forecast, by Country (2023-2030) 8.7.1. Brazil 8.7.1.1. Brazil Application Performance Monitoring Market Size and Forecast, by Deployment (2023-2030) 8.7.1.2. Brazil Application Performance Monitoring Market Size and Forecast, by Enterprise Size (2023-2030) 8.7.1.3. Brazil Application Performance Monitoring Market Size and Forecast, by Industry (2023-2030) 8.7.1.4. Brazil Application Performance Monitoring Market Size and Forecast, by Component (2023-2030) 8.7.1.5. Brazil Application Performance Monitoring Market Size and Forecast, by Monitoring Type (2023-2030) 8.7.1.6. Brazil Application Performance Monitoring Market Size and Forecast, by Technology (2023-2030) 8.7.2. Argentina 8.7.2.1. Argentina Application Performance Monitoring Market Size and Forecast, by Deployment (2023-2030) 8.7.2.2. Argentina Application Performance Monitoring Market Size and Forecast, by Enterprise Size (2023-2030) 8.7.2.3. Argentina Application Performance Monitoring Market Size and Forecast, by Industry (2023-2030) 8.7.2.4. Argentina Application Performance Monitoring Market Size and Forecast, by Component (2023-2030) 8.7.2.5. Argentina Application Performance Monitoring Market Size and Forecast, by Monitoring Type (2023-2030) 8.7.2.6. Argentina Application Performance Monitoring Market Size and Forecast, by Technology (2023-2030) 8.7.3. Rest Of South America 8.7.3.1. Rest Of South America Application Performance Monitoring Market Size and Forecast, by Deployment (2023-2030) 8.7.3.2. Rest Of South America Application Performance Monitoring Market Size and Forecast, by Enterprise Size (2023-2030) 8.7.3.3. Rest Of South America Application Performance Monitoring Market Size and Forecast, by Industry (2023-2030) 8.7.3.4. Rest Of South America Application Performance Monitoring Market Size and Forecast, by Component (2023-2030) 8.7.3.5. Rest Of South America Application Performance Monitoring Market Size and Forecast, by Monitoring Type (2023-2030) 8.7.3.6. Rest Of South America Application Performance Monitoring Market Size and Forecast, by Technology (2023-2030) 9. Global Application Performance Monitoring Market: Competitive Landscape 9.1. MMR Competition Matrix 9.2. Competitive Landscape 9.3. Key Players Benchmarking 9.3.1. Company Name 9.3.2. Business Segment 9.3.3. End-user Segment 9.3.4. Revenue (2023) 9.3.5. Company Locations 9.4. Leading Application Performance Monitoring Market Companies, by market capitalization 9.5. Market Structure 9.5.1. Market Leaders 9.5.2. Market Followers 9.5.3. Emerging Players 9.6. Mergers and Acquisitions Details 10. Company Profile: Key Players 10.1. AppDynamics (Santa Clara, CA) 10.1.1. Company Overview 10.1.2. Business Portfolio 10.1.3. Financial Overview 10.1.4. SWOT Analysis 10.1.5. Strategic Analysis 10.1.6. Scale of Operation (small, medium, and large) 10.1.7. Details on Partnership 10.1.8. Regulatory Accreditations and Certifications Received by Them 10.1.9. Awards Received by the Firm 10.1.10. Recent Developments 10.2. Datadog (New York, NY) 10.3. Dynatrace (Boston, MA) 10.4. IBM (Armonk, NY) 10.5. Micro Focus (Newbury, United Kingdom) 10.6. New Relic (Burlington, MA) 10.7. Oracle (Redwood Shores, CA) 10.8. SolarWinds (Austin, TX) 10.9. Splunk (San Francisco, CA) 10.10. AppNeta (Burlington, MA) 10.11. Aternity (Mountain View, CA) 10.12. Coralogix (Tel Aviv, Israel) 10.13. Elastic (Mountain View, CA) 10.14. ELK Stack (various) 10.15. Fiddler (San Francisco, CA) 10.16. Honeycomb (San Francisco, CA) 10.17. Lightstep (San Francisco, CA) 10.18. Micro Focus Covalence (various) 10.19. Nagios (Portland, OR) 10.20. Prometheus (various) 10.21. Sematext (Tel Aviv, Israel) 10.22. Site24x7 (Mumbai, India) 10.23. Stackdriver (Mountain View, CA) 10.24. Wavefront (Santa Clara, CA) 11. Key Findings 12. Industry Recommendations 13. Application Performance Monitoring Market: Research Methodology 14. Terms and Glossary
  • INQUIRE BEFORE BUYING