Advanced Visualization Market
1. Preface
1.1. Market Definition and Key Research Objectives
1.2. Research Highlights
2. Assumptions and Research Methodology
2.1. Report Assumptions
2.2. Abbreviations
2.3. Research Methodology
2.3.1. Secondary Research
2.3.1.1. Secondary data
2.3.1.2. Secondary Sources
2.3.2. Primary Research
2.3.2.1. Data from Primary Sources
2.3.2.2. Breakdown of Primary Sources
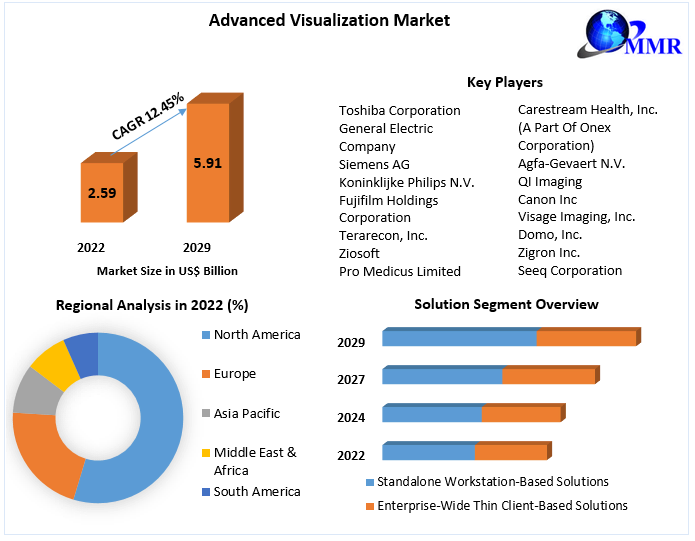
3. Executive Summary: Advanced Visualization Market Size, by Market Value (US$ Bn)
3.1. Market Segmentation
3.2. Market Segmentation Share Analysis, 2022
3.2.1.
3.2.2. By Region (North America, Europe, Asia Pacific, South America, Middle East Africa)
3.3. Geographical Snapshot of the Advanced Visualization Market
3.4. Geographical Snapshot of the Advanced Visualization Market, By Manufacturer share
4. Advanced Visualization Market Overview, 2022-2029
4.1. Market Dynamics
4.1.1. Drivers
4.1.1.1.
4.1.1.2. By Region (North America, Europe, Asia Pacific, South America, Middle East Africa)
4.1.2. Restraints
4.1.2.1.
4.1.2.2. By Region (North America, Europe, Asia Pacific, South America, Middle East Africa)
4.1.3. Opportunities
4.1.3.1.
4.1.3.2. By Region (North America, Europe, Asia Pacific, South America, Middle East Africa)
4.1.4. Challenges
4.1.4.1.
4.1.4.2. By Region (North America, Europe, Asia Pacific, South America, Middle East Africa)
4.1.5. Industry Trends and Emerging Technologies
4.1.6. Porters Five Forces Analysis
4.1.6.1. Threat of New Entrants
4.1.6.2. Bargaining Power of Buyers/Consumers
4.1.6.3. Bargaining Power of Suppliers
4.1.6.4. Threat of Substitute Products
4.1.6.5. Intensity of Competitive Rivalry
4.1.7. Value Chain Analysis
4.1.8. Technological Roadmap
4.1.9. Regulatory landscape
4.1.10. Impact of the Covid-19 Pandemic on the Advanced Visualization Market
5. Supply Side and Demand Side Indicators
6. Advanced Visualization Market Analysis and Forecast, 2022-2029
6.1. Advanced Visualization Market Size & Y-o-Y Growth Analysis.
7. Advanced Visualization Market Analysis and Forecasts, 2022-2029
7.1. Market Size (Value) Estimates & ForecastBy Products & Service, 2022-2029
7.1.1. Hardware & Software
7.1.2. Services
7.1.2.1. Implementation Services
7.1.2.2. Post-Sale and Maintenance Services
7.1.2.3. Consulting/Optimization Services
7.1.2.4. Training and Education Services
7.2. Market Size (Value) Estimates & ForecastBy Application, 2022-2029
7.2.1. Computed Tomography (CT)
7.2.2. Magnetic Resonance Imaging (MRI)
7.2.3. Positron Emission Tomography (PET)
7.2.4. Ultrasound
7.2.5. Radiotherapy (RT)
7.2.6. Nuclear Medicine
7.3. Market Size (Value) Estimates & ForecastBy Solution, 2022-2029
7.3.1. Standalone Workstation-Based Solutions
7.3.2. Enterprise-Wide Thin Client-Based Solutions
7.4. Market Size (Value) Estimates & ForecastBy Clinical Application, 2022-2029
7.4.1. Neurology
7.4.2. Radiology/Interventional Radiology
7.4.3. Cardiology
7.4.4. Orthopedics
7.4.5. Oncology
7.4.6. Vascular
7.4.7. Other Clinical Applications
7.5. Market Size (Value) Estimates & ForecastBy End User, 2022-2029
7.5.1. Imaging Centers
7.5.2. Hospitals, and Surgical Centers
7.5.3. Academic and Research Centers
7.5.4. Other End Users
8. Advanced Visualization Market Analysis and Forecasts, By Region
8.1. Market Size (Value) Estimates & Forecast By Region, 2022-2029
8.1.1. North America
8.1.2. Europe
8.1.3. Asia-Pacific
8.1.4. Middle East & Africa
8.1.5. South America
9. North America Advanced Visualization Market Analysis and Forecasts, 2022-2029
9.1. Market Size (Value) Estimates & ForecastBy Products & Service, 2022-2029
9.1.1. Hardware & Software
9.1.2. Services
9.1.2.1. Implementation Services
9.1.2.2. Post-Sale and Maintenance Services
9.1.2.3. Consulting/Optimization Services
9.1.2.4. Training and Education Services
9.2. Market Size (Value) Estimates & ForecastBy Application, 2022-2029
9.2.1. Computed Tomography (CT)
9.2.2. Magnetic Resonance Imaging (MRI)
9.2.3. Positron Emission Tomography (PET)
9.2.4. Ultrasound
9.2.5. Radiotherapy (RT)
9.2.6. Nuclear Medicine
9.3. Market Size (Value) Estimates & ForecastBy Solution, 2022-2029
9.3.1. Standalone Workstation-Based Solutions
9.3.2. Enterprise-Wide Thin Client-Based Solutions
9.4. Market Size (Value) Estimates & ForecastBy Clinical Application, 2022-2029
9.4.1. Neurology
9.4.2. Radiology/Interventional Radiology
9.4.3. Cardiology
9.4.4. Orthopedics
9.4.5. Oncology
9.4.6. Vascular
9.4.7. Other Clinical Applications
9.5. Market Size (Value) Estimates & ForecastBy End User, 2022-2029
9.5.1. Imaging Centers
9.5.2. Hospitals, and Surgical Centers
9.5.3. Academic and Research Centers
9.5.4. Other End Users
10. North America Advanced Visualization Market Analysis and Forecasts, By Country
10.1. Market Size (Value) Estimates & Forecast By Country, 2022-2029
10.1.1. US
10.1.2. Canada
10.1.3. Mexico
11. U.S. Advanced Visualization Market Analysis and Forecasts, 2022-2029
11.1. Market Size (Value) Estimates & ForecastBy Products & Service, 2022-2029
11.2. Market Size (Value) Estimates & ForecastBy Application, 2022-2029
11.3. Market Size (Value) Estimates & ForecastBy Solution, 2022-2029
11.4. Market Size (Value) Estimates & ForecastBy Clinical Application, 2022-2029
11.5. Market Size (Value) Estimates & Forecast By End User, 2022-2029
12. Canada Advanced Visualization Market Analysis and Forecasts, 2022-2029
12.1. Market Size (Value) Estimates & ForecastBy Products & Service, 2022-2029
12.2. Market Size (Value) Estimates & ForecastBy Application, 2022-2029
12.3. Market Size (Value) Estimates & ForecastBy Solution, 2022-2029
12.4. Market Size (Value) Estimates & ForecastBy Clinical Application, 2022-2029
12.5. Market Size (Value) Estimates & Forecast By End User, 2022-2029
13. Mexico Advanced Visualization Market Analysis and Forecasts, 2022-2029
13.1. Market Size (Value) Estimates & ForecastBy Products & Service, 2022-2029
13.2. Market Size (Value) Estimates & ForecastBy Application, 2022-2029
13.3. Market Size (Value) Estimates & ForecastBy Solution, 2022-2029
13.4. Market Size (Value) Estimates & ForecastBy Clinical Application, 2022-2029
13.5. Market Size (Value) Estimates & Forecast By End User, 2022-2029
14. Europe Advanced Visualization Market Analysis and Forecasts, 2022-2029
14.1. Market Size (Value) Estimates & ForecastBy Products & Service, 2022-2029
14.2. Market Size (Value) Estimates & ForecastBy Application, 2022-2029
14.3. Market Size (Value) Estimates & ForecastBy Solution, 2022-2029
14.4. Market Size (Value) Estimates & ForecastBy Clinical Application, 2022-2029
14.5. Market Size (Value) Estimates & Forecast By End User, 2022-2029
15. Europe Advanced Visualization Market Analysis and Forecasts, By Country
15.1. Market Size (Value) Estimates & Forecast By Country, 2022-2029
15.1.1. U.K
15.1.2. France
15.1.3. Germany
15.1.4. Italy
15.1.5. Spain
15.1.6. Sweden
15.1.7. CIS Countries
15.1.8. Rest of Europe
16. U.K. Advanced Visualization Market Analysis and Forecasts, 2022-2029
16.1. Market Size (Value) Estimates & ForecastBy Products & Service, 2022-2029
16.2. Market Size (Value) Estimates & ForecastBy Application, 2022-2029
16.3. Market Size (Value) Estimates & ForecastBy Solution, 2022-2029
16.4. Market Size (Value) Estimates & ForecastBy Clinical Application, 2022-2029
16.5. Market Size (Value) Estimates & Forecast By End User, 2022-2029
17. France Advanced Visualization Market Analysis and Forecasts, 2022-2029
17.1. Market Size (Value) Estimates & ForecastBy Products & Service, 2022-2029
17.2. Market Size (Value) Estimates & ForecastBy Application, 2022-2029
17.3. Market Size (Value) Estimates & ForecastBy Solution, 2022-2029
17.4. Market Size (Value) Estimates & ForecastBy Clinical Application, 2022-2029
17.5. Market Size (Value) Estimates & Forecast By End User, 2022-2029
18. Germany Advanced Visualization Market Analysis and Forecasts, 2022-2029
18.1. Market Size (Value) Estimates & ForecastBy Products & Service, 2022-2029
18.2. Market Size (Value) Estimates & ForecastBy Application, 2022-2029
18.3. Market Size (Value) Estimates & ForecastBy Solution, 2022-2029
18.4. Market Size (Value) Estimates & ForecastBy Clinical Application, 2022-2029
18.5. Market Size (Value) Estimates & Forecast By End User, 2022-2029
19. Italy Advanced Visualization Market Analysis and Forecasts, 2022-2029
19.1. Market Size (Value) Estimates & ForecastBy Products & Service, 2022-2029
19.2. Market Size (Value) Estimates & ForecastBy Application, 2022-2029
19.3. Market Size (Value) Estimates & ForecastBy Solution, 2022-2029
19.4. Market Size (Value) Estimates & ForecastBy Clinical Application, 2022-2029
19.5. Market Size (Value) Estimates & Forecast By End User, 2022-2029
20. Spain Advanced Visualization Market Analysis and Forecasts, 2022-2029
20.1. Market Size (Value) Estimates & ForecastBy Products & Service, 2022-2029
20.2. Market Size (Value) Estimates & ForecastBy Application, 2022-2029
20.3. Market Size (Value) Estimates & ForecastBy Solution, 2022-2029
20.4. Market Size (Value) Estimates & ForecastBy Clinical Application, 2022-2029
20.5. Market Size (Value) Estimates & Forecast By End User, 2022-2029
21. Sweden Advanced Visualization Market Analysis and Forecasts, 2022-2029
21.1. Market Size (Value) Estimates & ForecastBy Products & Service, 2022-2029
21.2. Market Size (Value) Estimates & ForecastBy Application, 2022-2029
21.3. Market Size (Value) Estimates & ForecastBy Solution, 2022-2029
21.4. Market Size (Value) Estimates & ForecastBy Clinical Application, 2022-2029
21.5. Market Size (Value) Estimates & Forecast By End User, 2022-2029
22. CIS CountriesAdvanced Visualization Market Analysis and Forecasts, 2022-2029
22.1. Market Size (Value) Estimates & ForecastBy Products & Service, 2022-2029
22.2. Market Size (Value) Estimates & ForecastBy Application, 2022-2029
22.3. Market Size (Value) Estimates & ForecastBy Solution, 2022-2029
22.4. Market Size (Value) Estimates & ForecastBy Clinical Application, 2022-2029
22.5. Market Size (Value) Estimates & Forecast By End User, 2022-2029
23. Rest of Europe Advanced Visualization Market Analysis and Forecasts, 2022-2029
23.1. Market Size (Value) Estimates & ForecastBy Products & Service, 2022-2029
23.2. Market Size (Value) Estimates & ForecastBy Application, 2022-2029
23.3. Market Size (Value) Estimates & ForecastBy Solution, 2022-2029
23.4. Market Size (Value) Estimates & ForecastBy Clinical Application, 2022-2029
23.5. Market Size (Value) Estimates & Forecast By End User, 2022-2029
24. Asia Pacific Advanced Visualization Market Analysis and Forecasts, 2022-2029
24.1. Market Size (Value) Estimates & ForecastBy Products & Service, 2022-2029
24.2. Market Size (Value) Estimates & ForecastBy Application, 2022-2029
24.3. Market Size (Value) Estimates & ForecastBy Solution, 2022-2029
24.4. Market Size (Value) Estimates & ForecastBy Clinical Application, 2022-2029
24.5. Market Size (Value) Estimates & Forecast By End User, 2022-2029
25. Asia Pacific Advanced Visualization Market Analysis and Forecasts, by Country
25.1. Market Size (Value) Estimates & ForecastBy Country, 2022-2029
25.1.1. China
25.1.2. India
25.1.3. Japan
25.1.4. South Korea
25.1.5. Australia
25.1.6. ASEAN
25.1.7. Rest of Asia Pacific
26. China Advanced Visualization Market Analysis and Forecasts, 2022-2029
26.1. Market Size (Value) Estimates & ForecastBy Products & Service, 2022-2029
26.2. Market Size (Value) Estimates & ForecastBy Application, 2022-2029
26.3. Market Size (Value) Estimates & ForecastBy Solution, 2022-2029
26.4. Market Size (Value) Estimates & ForecastBy Clinical Application, 2022-2029
26.5. Market Size (Value) Estimates & Forecast By End User, 2022-2029
27. India Advanced Visualization Market Analysis and Forecasts, 2022-2029
27.1. Market Size (Value) Estimates & ForecastBy Products & Service, 2022-2029
27.2. Market Size (Value) Estimates & ForecastBy Application, 2022-2029
27.3. Market Size (Value) Estimates & ForecastBy Solution, 2022-2029
27.4. Market Size (Value) Estimates & ForecastBy Clinical Application, 2022-2029
27.5. Market Size (Value) Estimates & Forecast By End User, 2022-2029
28. Japan Advanced Visualization Market Analysis and Forecasts, 2022-2029
28.1. Market Size (Value) Estimates & ForecastBy Products & Service, 2022-2029
28.2. Market Size (Value) Estimates & ForecastBy Application, 2022-2029
28.3. Market Size (Value) Estimates & ForecastBy Solution, 2022-2029
28.4. Market Size (Value) Estimates & ForecastBy Clinical Application, 2022-2029
28.5. Market Size (Value) Estimates & Forecast By End User, 2022-2029
29. South Korea Advanced Visualization Market Analysis and Forecasts, 2022-2029
29.1. Market Size (Value) Estimates & ForecastBy Products & Service, 2022-2029
29.2. Market Size (Value) Estimates & ForecastBy Application, 2022-2029
29.3. Market Size (Value) Estimates & ForecastBy Solution, 2022-2029
29.4. Market Size (Value) Estimates & ForecastBy Clinical Application, 2022-2029
29.5. Market Size (Value) Estimates & Forecast By End User, 2022-2029
30. Australia Advanced Visualization Market Analysis and Forecasts, 2022-2029
30.1. Market Size (Value) Estimates & ForecastBy Products & Service, 2022-2029
30.2. Market Size (Value) Estimates & ForecastBy Application, 2022-2029
30.3. Market Size (Value) Estimates & ForecastBy Solution, 2022-2029
30.4. Market Size (Value) Estimates & ForecastBy Clinical Application, 2022-2029
30.5. Market Size (Value) Estimates & Forecast By End User, 2022-2029
31. ASEAN Advanced Visualization Market Analysis and Forecasts, 2022-2029
31.1. Market Size (Value) Estimates & ForecastBy Products & Service, 2022-2029
31.2. Market Size (Value) Estimates & ForecastBy Application, 2022-2029
31.3. Market Size (Value) Estimates & ForecastBy Solution, 2022-2029
31.4. Market Size (Value) Estimates & ForecastBy Clinical Application, 2022-2029
31.5. Market Size (Value) Estimates & Forecast By End User, 2022-2029
32. Rest of Asia Pacific Advanced Visualization Market Analysis and Forecasts, 2022-2029
32.1. Market Size (Value) Estimates & ForecastBy Products & Service, 2022-2029
32.2. Market Size (Value) Estimates & ForecastBy Application, 2022-2029
32.3. Market Size (Value) Estimates & ForecastBy Solution, 2022-2029
32.4. Market Size (Value) Estimates & ForecastBy Clinical Application, 2022-2029
32.5. Market Size (Value) Estimates & Forecast By End User, 2022-2029
33. Middle East Africa Advanced Visualization Market Analysis and Forecasts, 2022-2029
33.1. Market Size (Value) Estimates & ForecastBy Products & Service, 2022-2029
33.2. Market Size (Value) Estimates & ForecastBy Application, 2022-2029
33.3. Market Size (Value) Estimates & ForecastBy Solution, 2022-2029
33.4. Market Size (Value) Estimates & ForecastBy Clinical Application, 2022-2029
33.5. Market Size (Value) Estimates & Forecast By End User, 2022-2029
34. Middle East Africa Advanced Visualization Market Analysis and Forecasts, by Country
34.1. Market Size (Value) Estimates & Forecast by Country, 2022-2029
34.1.1. South Africa
34.1.2. GCC Countries
34.1.3. Egypt
34.1.4. Nigeria
34.1.5. Rest of ME&A
35. South Africa Advanced Visualization Market Analysis and Forecasts, 2022-2029
35.1. Market Size (Value) Estimates & ForecastBy Products & Service, 2022-2029
35.2. Market Size (Value) Estimates & ForecastBy Application, 2022-2029
35.3. Market Size (Value) Estimates & ForecastBy Solution, 2022-2029
35.4. Market Size (Value) Estimates & ForecastBy Clinical Application, 2022-2029
35.5. Market Size (Value) Estimates & Forecast By End User, 2022-2029
36. GCC Countries Advanced Visualization Market Analysis and Forecasts, 2022-2029
36.1. Market Size (Value) Estimates & ForecastBy Products & Service, 2022-2029
36.2. Market Size (Value) Estimates & ForecastBy Application, 2022-2029
36.3. Market Size (Value) Estimates & ForecastBy Solution, 2022-2029
36.4. Market Size (Value) Estimates & ForecastBy Clinical Application, 2022-2029
36.5. Market Size (Value) Estimates & Forecast By End User, 2022-2029
37. Egypt Advanced Visualization Market Analysis and Forecasts, 2022-2029
37.1. Market Size (Value) Estimates & ForecastBy Products & Service, 2022-2029
37.2. Market Size (Value) Estimates & ForecastBy Application, 2022-2029
37.3. Market Size (Value) Estimates & ForecastBy Solution, 2022-2029
37.4. Market Size (Value) Estimates & ForecastBy Clinical Application, 2022-2029
37.5. Market Size (Value) Estimates & Forecast By End User, 2022-2029
38. Nigeria Advanced Visualization Market Analysis and Forecasts, 2022-2029
38.1. Market Size (Value) Estimates & ForecastBy Products & Service, 2022-2029
38.2. Market Size (Value) Estimates & ForecastBy Application, 2022-2029
38.3. Market Size (Value) Estimates & ForecastBy Solution, 2022-2029
38.4. Market Size (Value) Estimates & ForecastBy Clinical Application, 2022-2029
38.5. Market Size (Value) Estimates & Forecast By End User, 2022-2029
39. Rest of ME&A Advanced Visualization Market Analysis and Forecasts, 2022-2029
39.1. Market Size (Value) Estimates & ForecastBy Products & Service, 2022-2029
39.2. Market Size (Value) Estimates & ForecastBy Application, 2022-2029
39.3. Market Size (Value) Estimates & ForecastBy Solution, 2022-2029
39.4. Market Size (Value) Estimates & ForecastBy Clinical Application, 2022-2029
39.5. Market Size (Value) Estimates & Forecast By End User, 2022-2029
40. South AmericaAdvanced Visualization Market Analysis and Forecasts, 2022-2029
40.1. Market Size (Value) Estimates & ForecastBy Products & Service, 2022-2029
40.2. Market Size (Value) Estimates & ForecastBy Application, 2022-2029
40.3. Market Size (Value) Estimates & ForecastBy Solution, 2022-2029
40.4. Market Size (Value) Estimates & ForecastBy Clinical Application, 2022-2029
40.5. Market Size (Value) Estimates & Forecast By End User, 2022-2029
41. South America Advanced Visualization Market Analysis and Forecasts, by Country
41.1. Market Size (Value) Estimates & Forecast by Country, 2022-2029
41.1.1. Brazil
41.1.2. Argentina
41.1.3. Rest of South America
42. Brazil Advanced Visualization Market Analysis and Forecasts, 2022-2029
42.1. Market Size (Value) Estimates & ForecastBy Products & Service, 2022-2029
42.2. Market Size (Value) Estimates & ForecastBy Application, 2022-2029
42.3. Market Size (Value) Estimates & ForecastBy Solution, 2022-2029
42.4. Market Size (Value) Estimates & ForecastBy Clinical Application, 2022-2029
42.5. Market Size (Value) Estimates & Forecast By End User, 2022-2029
43. Argentina Advanced Visualization Market Analysis and Forecasts, 2022-2029
43.1. Market Size (Value) Estimates & ForecastBy Products & Service, 2022-2029
43.2. Market Size (Value) Estimates & ForecastBy Application, 2022-2029
43.3. Market Size (Value) Estimates & ForecastBy Solution, 2022-2029
43.4. Market Size (Value) Estimates & ForecastBy Clinical Application, 2022-2029
43.5. Market Size (Value) Estimates & Forecast By End User, 2022-2029
44. Rest of South America Advanced Visualization Market Analysis and Forecasts, 2022-2029
44.1. Market Size (Value) Estimates & ForecastBy Products & Service, 2022-2029
44.2. Market Size (Value) Estimates & ForecastBy Application, 2022-2029
44.3. Market Size (Value) Estimates & ForecastBy Solution, 2022-2029
44.4. Market Size (Value) Estimates & ForecastBy Clinical Application, 2022-2029
44.5. Market Size (Value) Estimates & Forecast By End User, 2022-2029
45. Competitive Landscape
45.1. Geographic Footprint of Major Players in the Advanced Visualization Market
45.2. Competition Matrix
45.2.1. Competitive Benchmarking of Key Players By Price, Presence, Market Share, Applications and R&D Investment
45.2.2. New Product Launches and Product Enhancements
45.2.3. Market Consolidation
45.2.3.1. M&A by Regions, Investment and Verticals
45.2.3.2. M&A, Forward Integration and Backward
Integration
45.2.3.3. Partnership, Joint Ventures and Strategic Alliances/ Sales Agreements
45.3. Company Profile : Key Players
45.3.1. Toshiba Corporation.
45.3.1.1. Company Overview
45.3.1.2. Financial Overview
45.3.1.3. Geographic Footprint
45.3.1.4. Product Portfolio
45.3.1.5. Business Strategy
45.3.1.6. Recent Developments
45.3.2. General Electric Company
45.3.3. Siemens AG
45.3.4. Koninklijke Philips N.V.
45.3.5. Fujifilm Holdings Corporation
45.3.6. Terarecon, Inc.
45.3.7. Ziosoft
45.3.8. Pro Medicus Limited
45.3.9. Carestream Health, Inc. (A Part Of Onex Corporation)
45.3.10. Agfa-Gevaert N.V.
45.3.11. QI Imaging
45.3.12. Canon Inc.
45.3.13. Visage Imaging, Inc.
45.3.14. Domo, Inc.
45.3.15. Zigron Inc.
45.3.16. Seeq Corporation
46. Primary Key Insights

 To Know About The Research Methodology :- Request Free Sample Report