Virtual Reality Shopping Market: Global Product Categories Analysis and Forecast (2022 -2029)

Global Virtual Reality Shopping Market size was valued at USD 42.70 Bn. in 2022 and the total Virtual Reality Shopping revenue is expected to grow by 28.2 % from 2023 to 2029, reaching nearly USD 243.02 Bn.

Virtual Reality Shopping Market Overview:

Virtual Reality (VR) is a computer-generated atmosphere with objects and scenes that seem to be real, making the user feel immersed in the surroundings. VR technology has gadgets such as VR headsets, bodysuits, glasses, and gloves which gives an immersive experience to consumers. The VR shopping market is increasing its demand as the trend of gaming and e-sports is increasing day by day. There are major market key players like Unity Software Inc., Barco NV, CyberGlove Systems Inc., Samsung Electronics Co., Ltd., Meta Platforms Inc., Sensics Inc., etc that are developing and building the gaming experience at higher levels for consumers. Segment-wise, the commercial segment has dominated the Virtual Reality Shopping Market.Virtual Reality Shopping MarketTo know about the Research Methodology :- Request Free Sample Report

Virtual Reality Shopping Market Dynamics

Integration of VR in E-Commerce and Advancements in VR Technology drives the market The addition of VR shopping features in E-commerce is reducing the gap between online and offline shopping. Visual Reality (VR) shopping offers an immersive and engaging shopping experience compared to traditional online shopping. VR shopping helps customers to visit the store virtually and try on the products without any physical presence which provides convenience and safety to the consumers. VR technology is becoming more affordable and accessible because the technology is upgrading and it become a more feasible option for many businesses and consumers as well. As the development of VR technology is improving the demand for the Virtual Reality Shopping Market is growing. This leads to the broader adoption of VR technology in many industries including the commercial and healthcare sectors. Whereas the demand for HMDs is growing in numerous industries including electronics, aerospace & defence, and automotive. Health, Privacy, and Security concerns can restraint the virtual reality shopping market Virtual Reality technologies are used in a broad range of gaming and e-sports for an exclusive gaming experience. The usage of VR headsets and devices is extensive and this can cause health concerns like fatigue, motion sickness, discomfort, lack of concentration, eye-sight issues, hearing issues, and dizziness. Thus, the extreme usage of VR devices might lead to health concerns, which are expected to impact the market marginally. However, this device collects personal user data, including movement patterns, interactions, and conducting transactions within VR environments. Hence, the collection of data raises privacy and security concerns about unauthorized data exploitation among consumers. Hence, This can limit or hamper the demand of the Virtual Reality Shopping Market. Utilization of VR in the Commerical, Healthcare, and Other sectors to create opportunities VR is being used progressively in various sectors for different purposes. The application of VR in the commercial sector and healthcare sector is more compared to other sectors. There are primary 3 types of VR devices as Gesture-Tracking Devices (GTD), Head-Mounted Displays (HMD), and Projectors & Display Wall (PDW). The main use of a Head-Mounted Display(HMD) is in the healthcare sector for medical training applications. With the development of HMD interfaces, medical professionals can easily perform surgeries through VR simulation. The technology of VR is widely used in Commercial sectors like Real Estate, Interior Design and Furniture Retail, Retail and E-Commerce, etc. Whereas in the retail Application, VR is used for virtual product visualization and storefronts where customers can virtually explore stores, and can view products in detail before making a purchase decision on clothing and accessories. Other sectors such as Aerospace & Defence, Education, Enterprises, Entertainment, etc are expected to grow as the importance of the Virtual Reality Shopping Market is increasing its demand.

Virtual Reality Shopping Market Segment Analysis

Based on the Technology, The Semi-Fully Immersive segment has dominated the market with a revenue share of 83.8% in the year 2022 and is expected to dominate the market during the forecast period. This technology has increased its popularity for the ability to provide the architecture of actual surroundings in a virtual platform. Semi-Fully Immersive VR involves the usage of devices or headsets which provides a more immersive visual and auditory experience. Virtual Reality technology is in demand for educational purposes as well, as it allows students to exercise reasoning and motor activities which is not possible to conduct in a classroom. Whereas the Non-Immersive segment accounted for a revenue share of 16.2% in the year 2022. This technology offers augmented reality (AR) applications that overlap virtual elements in the real world.Virtual Reality Shopping Market1
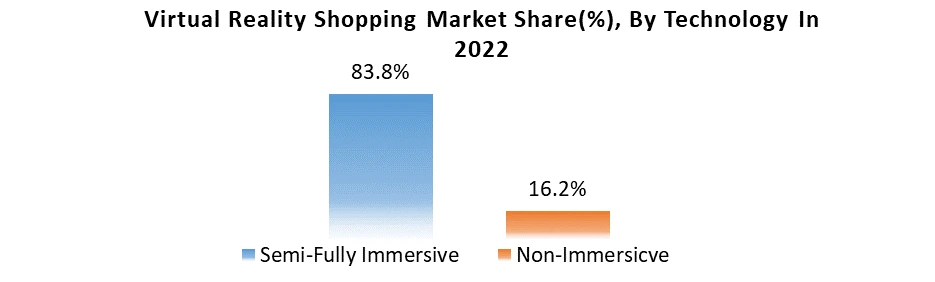
Based on the Application, The commercial segment has dominated the market with the largest revenue share of 55.6% in the year 2022 and is expected to dominate during the forecast period. The commercial sector is the key driver of virtual reality shopping applications as a business. The usage of VR is increasing in this sector and this sector includes consumer brands, retail businesses, and e-commerce platforms. The acceptance of mobile devices and other devices is increasing and hence it is expected to lift the usage of VR technologies in this sector. Whereas the Healthcare sector is expected to dominate the market during the forecast period as VR technology is used for medical procedures in healthcare. The demand in this segment is growing as hospitals and medical colleges use VR solutions and tools to train students and doctors.Virtual Reality Shopping Market2

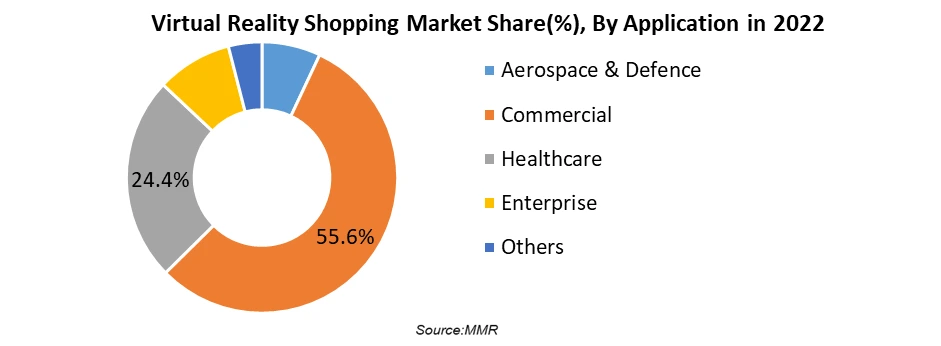
Virtual Reality Shopping Market Regional Insights:

Asia Pacific region has dominated the market in the year 2022 with the highest revenue share of over 40% and is expected to dominate the market during the forecast period. Countries like China and Japan have investments and are interested in Virtual Reality Shopping. China is a country with major manufacturers and suppliers of VR hardware. The online shopping experience in China is been enhancing as e-commerce giants have been exploring Virtual Reality (VR) and augmented reality (AR) technologies. Retailers in Japan have been examining VR showrooms and shopping experiences as well. North American region is witness to grow its market during the forecast period, especially in the United States. Major E-commerce companies and retailers in the U.S. and Canada are experimenting with VR shopping experiences, allowing consumers to virtually travel to stores and products.Virtual Reality Shopping Market3The objective of the report is to present a comprehensive analysis of the Virtual Reality Shopping Market including all the stakeholders of the Application. The past and current status of the Application with forecasted market size and trends are presented in the report with the analysis of complicated data in simple language. The report covers all the aspects of the Application with a dedicated study of key players that includes market leaders, followers, and new entrants by region. PORTER, SVOR, and PESTEL analysis with the potential impact of micro-economic factors by region on the market have been presented in the report. External as well as internal factors that are supposed to affect the business positively or negatively have been analyzed, which will give a clear futuristic view of the Application to the decision-makers. The report also helps in understanding Virtual Reality Shopping Market dynamics, and structure by analyzing the market segments and projecting the Virtual Reality Shopping Market size. Clear representation of competitive analysis of key players by type, price, financial position, product portfolio, growth strategies, and regional presence in the Virtual Reality Shopping Market makes the report an investor’s guide.

Virtual Reality Shopping Market Scope: Inquire before buying

Virtual Reality Shopping Market
Report Coverage Details
Base Year: 2022 Forecast Period: 2023-2029
Historical Data: 2018 to 2022 Market Size in 2022: US $ 42.70 Bn.
Forecast Period 2023 to 2029 CAGR: 28.2% Market Size in 2029: US $ 243.02 Bn.
Segments Covered: by Device Gesture-Tracking Device(GTD) Head-Mounted Display(HMD) Projectors & Display Wall (PDW)
by Technology Semi & Fully Immersive Non-Immersive
by Component Hardware Software
by Application Aerospace & Defence Commercial Healthcare Enterprise Others

Virtual Reality Shopping Market by Region

North America (United States, Canada, and Mexico) Europe (UK, France, Germany, Italy, Spain, Sweden, Austria, and the Rest of Europe) Asia Pacific (China, South Korea, Japan, India, Australia, Indonesia, Malaysia, Vietnam, Taiwan, Bangladesh, Pakistan, and the Rest of APAC) Middle East and Africa (South Africa, GCC, Egypt, Nigeria, and the Rest of ME&A) South America (Brazil, Argentina Rest of South America)

Virtual Reality Shopping Market Key Players

1. Unity Software Inc. (U.S.) 2. Barco NV 3. CyberGlove Systems Inc. 4. Samsung Electronics Co., Ltd. (South Korea) 5. Meta Platforms Inc. 6. Sensics Inc. 7. Sixense Enterprises, Inc. 8. Ultraleap Ltd. 9. Google LLC (Alphabet Inc.) 10. Microsoft Corporation 11. Sony Interactive Entertainment LLC 12. HTC Corporation 13. Qualcomm Incorporated 14. Nvidia Corporation 15. HaptX Inc. 16. Magic Leap 17. Marxent Labs LLC 18. Oculus VR 19. WorldViz 20. Firsthand Technology Inc.

Frequently Asked Questions:

1] What segments are covered in the Global Virtual Reality Shopping Market report? Ans. The segments covered in the Virtual Reality Shopping Market report are based on Device, Technology, Component, Application, and Region. 2] Which region is expected to hold the highest share of the Global Virtual Reality Shopping Market? Ans. The Asia Pacific region is expected to hold the highest share of the Virtual Reality Shopping Market. 3] What is the market size of the Global Virtual Reality Shopping Market by 2029? Ans. The market size of the Virtual Reality Shopping Market by 2029 is expected to reach US$ 243.02 Bn. 4] What is the forecast period for the Global Virtual Reality Shopping Market? Ans. The forecast period for the Virtual Reality Shopping Market is 2023-2029. 5] What was the market size of the Global Virtual Reality Shopping Market in 2022? Ans. The market size of the Virtual Reality Shopping Market in 2022 was valued at US$ 42.70 Bn.
1. Virtual Reality Shopping Market: Research Methodology 2. Virtual Reality Shopping Market Introduction 2.1. Study Assumption and Market Definition 2.2. Scope of the Study 2.3. Executive Summary 3. Virtual Reality Shopping Market: Dynamics 3.1. Virtual Reality Shopping Market Trends by Region 3.1.1. Global Virtual Reality Shopping Market Trends 3.1.2. North America Virtual Reality Shopping Market Trends 3.1.3. Europe Virtual Reality Shopping Market Trends 3.1.4. Asia Pacific Virtual Reality Shopping Market Trends 3.1.5. Middle East and Africa Virtual Reality Shopping Market Trends 3.1.6. South America Virtual Reality Shopping Market Trends 3.2. Virtual Reality Shopping Market Dynamics by Region 3.2.1. North America 3.2.1.1. North America Virtual Reality Shopping Market Drivers 3.2.1.2. North America Virtual Reality Shopping Market Restraints 3.2.1.3. North America Virtual Reality Shopping Market Opportunities 3.2.1.4. North America Virtual Reality Shopping Market Challenges 3.2.2. Europe 3.2.2.1. Europe Virtual Reality Shopping Market Drivers 3.2.2.2. Europe Virtual Reality Shopping Market Restraints 3.2.2.3. Europe Virtual Reality Shopping Market Opportunities 3.2.2.4. Europe Virtual Reality Shopping Market Challenges 3.2.3. Asia Pacific 3.2.3.1. Asia Pacific Virtual Reality Shopping Market Drivers 3.2.3.2. Asia Pacific Virtual Reality Shopping Market Restraints 3.2.3.3. Asia Pacific Virtual Reality Shopping Market Opportunities 3.2.3.4. Asia Pacific Virtual Reality Shopping Market Challenges 3.2.4. Middle East and Africa 3.2.4.1. Middle East and Africa Virtual Reality Shopping Market Drivers 3.2.4.2. Middle East and Africa Virtual Reality Shopping Market Restraints 3.2.4.3. Middle East and Africa Virtual Reality Shopping Market Opportunities 3.2.4.4. Middle East and Africa Virtual Reality Shopping Market Challenges 3.2.5. South America 3.2.5.1. South America Virtual Reality Shopping Market Drivers 3.2.5.2. South America Virtual Reality Shopping Market Restraints 3.2.5.3. South America Virtual Reality Shopping Market Opportunities 3.2.5.4. South America Virtual Reality Shopping Market Challenges 3.3. PORTER’s Five Forces Analysis 3.4. PESTLE Analysis 3.5. Technology Roadmap 3.6. Regulatory Landscape by Region 3.6.1. Global 3.6.2. North America 3.6.3. Europe 3.6.4. Asia Pacific 3.6.5. Middle East and Africa 3.6.6. South America 3.7. Key Opinion Leader Analysis For Allogeneic Cell Therapy Application 3.8. Analysis of Government Schemes and Initiatives For Allogeneic Cell Therapy Application 3.9. The Global Pandemic Impact on Virtual Reality Shopping Market 4. Virtual Reality Shopping Market: Global Market Size and Forecast by Segmentation by Demand and Supply Side (by Value in USD Million) (2022-2029) 4.1. Virtual Reality Shopping Market Size and Forecast, by Device (2022-2029) 4.1.1. Gesture-Tracking Device(GTD) 4.1.2. Head-Mounted Display(HMD) 4.1.3. Projectors & Display Wall (PDW) 4.2. Virtual Reality Shopping Market Size and Forecast, by Technology (2022-2029) 4.2.1. Semi & Fully Immersive 4.2.2. Non-Immersive 4.3. Virtual Reality Shopping Market Size and Forecast, by Component (2022-2029) 4.3.1. Hardware 4.3.2. Software 4.4. Virtual Reality Shopping Market Size and Forecast, by Application (2022-2029) 4.4.1. Aerospace & Defence 4.4.2. Commercial 4.4.3. Healthcare 4.4.4. Enterprise 4.4.5. Others 4.5. Virtual Reality Shopping Market Size and Forecast, by Region (2022-2029) 4.5.1. North America 4.5.2. Europe 4.5.3. Asia Pacific 4.5.4. Middle East and Africa 4.5.5. South America 5. North America Virtual Reality Shopping Market Size and Forecast by Segmentation by Demand and Supply Side (by Value in USD Million) (2022-2029) 5.1. North America Virtual Reality Shopping Market Size and Forecast, by Device (2022-2029) 5.1.1. Gesture-Tracking Device(GTD) 5.1.2. Head-Mounted Display(HMD) 5.1.3. Projectors & Display Wall (PDW) 5.2. North America Virtual Reality Shopping Market Size and Forecast, by Technology (2022-2029) 5.2.1. Semi & Fully Immersive 5.2.2. Non-Immersive 5.3. North America Virtual Reality Shopping Market Size and Forecast, by Component (2022-2029) 5.3.1. Hardware 5.3.2. Software 5.4. North America Virtual Reality Shopping Market Size and Forecast, by Application (2022-2029) 5.4.1. Aerospace & Defence 5.4.2. Commercial 5.4.3. Healthcare 5.4.4. Enterprise 5.4.5. Others 5.5. North America Virtual Reality Shopping Market Size and Forecast, by Country (2022-2029) 5.5.1. United States 5.5.1.1. United States Virtual Reality Shopping Market Size and Forecast, by Device (2022-2029) 5.5.1.1.1. Gesture-Tracking Device(GTD) 5.5.1.1.2. Head-Mounted Display(HMD) 5.5.1.1.3. Projectors & Display Wall (PDW) 5.5.1.2. United States Virtual Reality Shopping Market Size and Forecast, by Technology (2022-2029) 5.5.1.2.1. Semi & Fully Immersive 5.5.1.2.2. Non-Immersive 5.5.1.3. United States Virtual Reality Shopping Market Size and Forecast, by Component (2022-2029) 5.5.1.3.1. Hardware 5.5.1.3.2. Software 5.5.1.4. United States Virtual Reality Shopping Market Size and Forecast, by Application (2022-2029) 5.5.1.4.1. Aerospace & Defence 5.5.1.4.2. Commercial 5.5.1.4.3. Healthcare 5.5.1.4.4. Enterprise 5.5.1.4.5. Others 5.5.2. Canada 5.5.2.1. Canada Virtual Reality Shopping Market Size and Forecast, by Device (2022-2029) 5.5.2.1.1. Gesture-Tracking Device(GTD) 5.5.2.1.2. Head-Mounted Display(HMD) 5.5.2.1.3. Projectors & Display Wall (PDW) 5.5.2.2. Canada Virtual Reality Shopping Market Size and Forecast, by Technology (2022-2029) 5.5.2.2.1. Semi & Fully Immersive 5.5.2.2.2. Non-Immersive 5.5.2.3. Canada Virtual Reality Shopping Market Size and Forecast, by Component (2022-2029) 5.5.2.3.1. Hardware 5.5.2.3.2. Software 5.5.2.4. Canada Virtual Reality Shopping Market Size and Forecast, by Application (2022-2029) 5.5.2.4.1. Aerospace & Defence 5.5.2.4.2. Commercial 5.5.2.4.3. Healthcare 5.5.2.4.4. Enterprise 5.5.2.4.5. Others 5.5.3. Mexico 5.5.3.1. Mexico Virtual Reality Shopping Market Size and Forecast, by Device (2022-2029) 5.5.3.1.1. Gesture-Tracking Device(GTD) 5.5.3.1.2. Head-Mounted Display(HMD) 5.5.3.1.3. Projectors & Display Wall (PDW) 5.5.3.2. Mexico Virtual Reality Shopping Market Size and Forecast, by Technology (2022-2029) 5.5.3.2.1. Semi & Fully Immersive 5.5.3.2.2. Non-Immersive 5.5.3.3. Mexico Virtual Reality Shopping Market Size and Forecast, by Component (2022-2029) 5.5.3.3.1. Hardware 5.5.3.3.2. Software 5.5.3.4. Mexico Virtual Reality Shopping Market Size and Forecast, by Application (2022-2029) 5.5.3.4.1. Aerospace & Defence 5.5.3.4.2. Commercial 5.5.3.4.3. Healthcare 5.5.3.4.4. Enterprise 5.5.3.4.5. Others 6. Europe Virtual Reality Shopping Market Size and Forecast by Segmentation by Demand and Supply Side (by Value in USD Million) (2022-2029) 6.1. Europe Virtual Reality Shopping Market Size and Forecast, by Device (2022-2029) 6.2. Europe Virtual Reality Shopping Market Size and Forecast, by Technology (2022-2029) 6.3. Europe Virtual Reality Shopping Market Size and Forecast, by Component (2022-2029) 6.4. Europe Virtual Reality Shopping Market Size and Forecast, by Application (2022-2029) 6.5. Europe Virtual Reality Shopping Market Size and Forecast, by Country (2022-2029) 6.5.1. United Kingdom 6.5.1.1. United Kingdom Virtual Reality Shopping Market Size and Forecast, by Device (2022-2029) 6.5.1.2. United Kingdom Virtual Reality Shopping Market Size and Forecast, by Technology (2022-2029) 6.5.1.3. United Kingdom Virtual Reality Shopping Market Size and Forecast, by Component (2022-2029) 6.5.1.4. United Kingdom Virtual Reality Shopping Market Size and Forecast, by Application (2022-2029) 6.5.2. France 6.5.2.1. France Virtual Reality Shopping Market Size and Forecast, by Device (2022-2029) 6.5.2.2. France Virtual Reality Shopping Market Size and Forecast, by Technology (2022-2029) 6.5.2.3. France Virtual Reality Shopping Market Size and Forecast, by Component (2022-2029) 6.5.2.4. France Virtual Reality Shopping Market Size and Forecast, by Application (2022-2029) 6.5.3. Germany 6.5.3.1. Germany Virtual Reality Shopping Market Size and Forecast, by Device (2022-2029) 6.5.3.2. Germany Virtual Reality Shopping Market Size and Forecast, by Technology (2022-2029) 6.5.3.3. Germany Virtual Reality Shopping Market Size and Forecast, by Component (2022-2029) 6.5.3.4. Germany Virtual Reality Shopping Market Size and Forecast, by Application (2022-2029) 6.5.4. Italy 6.5.4.1. Italy Virtual Reality Shopping Market Size and Forecast, by Device (2022-2029) 6.5.4.2. Italy Virtual Reality Shopping Market Size and Forecast, by Technology (2022-2029) 6.5.4.3. Italy Virtual Reality Shopping Market Size and Forecast, by Component (2022-2029) 6.5.4.4. Italy Virtual Reality Shopping Market Size and Forecast, by Application (2022-2029) 6.5.5. Spain 6.5.5.1. Spain Virtual Reality Shopping Market Size and Forecast, by Device (2022-2029) 6.5.5.2. Spain Virtual Reality Shopping Market Size and Forecast, by Technology (2022-2029) 6.5.5.3. Spain Virtual Reality Shopping Market Size and Forecast, by Component (2022-2029) 6.5.5.4. Spain Virtual Reality Shopping Market Size and Forecast, by Application (2022-2029) 6.5.6. Sweden 6.5.6.1. Sweden Virtual Reality Shopping Market Size and Forecast, by Device (2022-2029) 6.5.6.2. Sweden Virtual Reality Shopping Market Size and Forecast, by Technology (2022-2029) 6.5.6.3. Sweden Virtual Reality Shopping Market Size and Forecast, by Component (2022-2029) 6.5.6.4. Sweden Virtual Reality Shopping Market Size and Forecast, by Application (2022-2029) 6.5.7. Austria 6.5.7.1. Austria Virtual Reality Shopping Market Size and Forecast, by Device (2022-2029) 6.5.7.2. Austria Virtual Reality Shopping Market Size and Forecast, by Technology (2022-2029) 6.5.7.3. Austria Virtual Reality Shopping Market Size and Forecast, by Component (2022-2029) 6.5.7.4. Austria Virtual Reality Shopping Market Size and Forecast, by Application (2022-2029) 6.5.8. Rest of Europe 6.5.8.1. Rest of Europe Virtual Reality Shopping Market Size and Forecast, by Device (2022-2029) 6.5.8.2. Rest of Europe Virtual Reality Shopping Market Size and Forecast, by Technology (2022-2029) 6.5.8.3. Rest of Europe Virtual Reality Shopping Market Size and Forecast, by Component (2022-2029) 6.5.8.4. Rest of Europe Virtual Reality Shopping Market Size and Forecast, by Application (2022-2029) 7. Asia Pacific Virtual Reality Shopping Market Size and Forecast by Segmentation by Demand and Supply Side (by Value in USD Million) (2022-2029) 7.1. Asia Pacific Virtual Reality Shopping Market Size and Forecast, by Device (2022-2029) 7.2. Asia Pacific Virtual Reality Shopping Market Size and Forecast, by Technology (2022-2029) 7.3. Asia Pacific Virtual Reality Shopping Market Size and Forecast, by Component (2022-2029) 7.4. Asia Pacific Virtual Reality Shopping Market Size and Forecast, by Application (2022-2029) 7.5. Asia Pacific Virtual Reality Shopping Market Size and Forecast, by Country (2022-2029) 7.5.1. China 7.5.1.1. China Virtual Reality Shopping Market Size and Forecast, by Device (2022-2029) 7.5.1.2. China Virtual Reality Shopping Market Size and Forecast, by Technology (2022-2029) 7.5.1.3. China Virtual Reality Shopping Market Size and Forecast, by Component (2022-2029) 7.5.1.4. China Virtual Reality Shopping Market Size and Forecast, by Application (2022-2029) 7.5.2. S Korea 7.5.2.1. S Korea Virtual Reality Shopping Market Size and Forecast, by Device (2022-2029) 7.5.2.2. S Korea Virtual Reality Shopping Market Size and Forecast, by Technology (2022-2029) 7.5.2.3. S Korea Virtual Reality Shopping Market Size and Forecast, by Component (2022-2029) 7.5.2.4. S Korea Virtual Reality Shopping Market Size and Forecast, by Application (2022-2029) 7.5.3. Japan 7.5.3.1. Japan Virtual Reality Shopping Market Size and Forecast, by Device (2022-2029) 7.5.3.2. Japan Virtual Reality Shopping Market Size and Forecast, by Technology (2022-2029) 7.5.3.3. Japan Virtual Reality Shopping Market Size and Forecast, by Component (2022-2029) 7.5.3.4. Japan Virtual Reality Shopping Market Size and Forecast, by Application (2022-2029) 7.5.4. India 7.5.4.1. India Virtual Reality Shopping Market Size and Forecast, by Device (2022-2029) 7.5.4.2. India Virtual Reality Shopping Market Size and Forecast, by Technology (2022-2029) 7.5.4.3. India Virtual Reality Shopping Market Size and Forecast, by Component (2022-2029) 7.5.4.4. India Virtual Reality Shopping Market Size and Forecast, by Application (2022-2029) 7.5.5. Australia 7.5.5.1. Australia Virtual Reality Shopping Market Size and Forecast, by Device (2022-2029) 7.5.5.2. Australia Virtual Reality Shopping Market Size and Forecast, by Technology (2022-2029) 7.5.5.3. Australia Virtual Reality Shopping Market Size and Forecast, by Component (2022-2029) 7.5.5.4. Australia Virtual Reality Shopping Market Size and Forecast, by Application (2022-2029) 7.5.6. Indonesia 7.5.6.1. Indonesia Virtual Reality Shopping Market Size and Forecast, by Device (2022-2029) 7.5.6.2. Indonesia Virtual Reality Shopping Market Size and Forecast, by Technology (2022-2029) 7.5.6.3. Indonesia Virtual Reality Shopping Market Size and Forecast, by Component (2022-2029) 7.5.6.4. Indonesia Virtual Reality Shopping Market Size and Forecast, by Application (2022-2029) 7.5.7. Malaysia 7.5.7.1. Malaysia Virtual Reality Shopping Market Size and Forecast, by Device (2022-2029) 7.5.7.2. Malaysia Virtual Reality Shopping Market Size and Forecast, by Technology (2022-2029) 7.5.7.3. Malaysia Virtual Reality Shopping Market Size and Forecast, by Component (2022-2029) 7.5.7.4. Malaysia Virtual Reality Shopping Market Size and Forecast, by Application (2022-2029) 7.5.8. Vietnam 7.5.8.1. Vietnam Virtual Reality Shopping Market Size and Forecast, by Device (2022-2029) 7.5.8.2. Vietnam Virtual Reality Shopping Market Size and Forecast, by Technology (2022-2029) 7.5.8.3. Vietnam Virtual Reality Shopping Market Size and Forecast, by Component (2022-2029) 7.5.8.4. Vietnam Virtual Reality Shopping Market Size and Forecast, by Application (2022-2029) 7.5.9. Taiwan 7.5.9.1. Taiwan Virtual Reality Shopping Market Size and Forecast, by Device (2022-2029) 7.5.9.2. Taiwan Virtual Reality Shopping Market Size and Forecast, by Technology (2022-2029) 7.5.9.3. Taiwan Virtual Reality Shopping Market Size and Forecast, by Component (2022-2029) 7.5.9.4. Taiwan Virtual Reality Shopping Market Size and Forecast, by Application (2022-2029) 7.5.10. Rest of Asia Pacific 7.5.10.1. Rest of Asia Pacific Virtual Reality Shopping Market Size and Forecast, by Device (2022-2029) 7.5.10.2. Rest of Asia Pacific Virtual Reality Shopping Market Size and Forecast, by Technology (2022-2029) 7.5.10.3. Rest of Asia Pacific Virtual Reality Shopping Market Size and Forecast, by Component (2022-2029) 7.5.10.4. Rest of Asia Pacific Virtual Reality Shopping Market Size and Forecast, by Application (2022-2029) 8. Middle East and Africa Virtual Reality Shopping Market Size and Forecast by Segmentation by Demand and Supply Side (by Value in USD Million) (2022-2029 8.1. Middle East and Africa Virtual Reality Shopping Market Size and Forecast, by Device (2022-2029) 8.2. Middle East and Africa Virtual Reality Shopping Market Size and Forecast, by Technology (2022-2029) 8.3. Middle East and Africa Virtual Reality Shopping Market Size and Forecast, by Component (2022-2029) 8.4. Middle East and Africa Virtual Reality Shopping Market Size and Forecast, by Application (2022-2029) 8.5. Middle East and Africa Virtual Reality Shopping Market Size and Forecast, by Country (2022-2029) 8.5.1. South Africa 8.5.1.1. South Africa Virtual Reality Shopping Market Size and Forecast, by Device (2022-2029) 8.5.1.2. South Africa Virtual Reality Shopping Market Size and Forecast, by Technology (2022-2029) 8.5.1.3. South Africa Virtual Reality Shopping Market Size and Forecast, by Component (2022-2029) 8.5.1.4. South Africa Virtual Reality Shopping Market Size and Forecast, by Application (2022-2029) 8.5.2. GCC 8.5.2.1. GCC Virtual Reality Shopping Market Size and Forecast, by Device (2022-2029) 8.5.2.2. GCC Virtual Reality Shopping Market Size and Forecast, by Technology (2022-2029) 8.5.2.3. GCC Virtual Reality Shopping Market Size and Forecast, by Component (2022-2029) 8.5.2.4. GCC Virtual Reality Shopping Market Size and Forecast, by Application (2022-2029) 8.5.3. Nigeria 8.5.3.1. Nigeria Virtual Reality Shopping Market Size and Forecast, by Device (2022-2029) 8.5.3.2. Nigeria Virtual Reality Shopping Market Size and Forecast, by Technology (2022-2029) 8.5.3.3. Nigeria Virtual Reality Shopping Market Size and Forecast, by Component (2022-2029) 8.5.3.4. Nigeria Virtual Reality Shopping Market Size and Forecast, by Application (2022-2029) 8.5.4. Rest of ME&A 8.5.4.1. Rest of ME&A Virtual Reality Shopping Market Size and Forecast, by Device (2022-2029) 8.5.4.2. Rest of ME&A Virtual Reality Shopping Market Size and Forecast, by Technology (2022-2029) 8.5.4.3. Rest of ME&A Virtual Reality Shopping Market Size and Forecast, by Component (2022-2029) 8.5.4.4. Rest of ME&A Virtual Reality Shopping Market Size and Forecast, by Application (2022-2029) 9. South America Virtual Reality Shopping Market Size and Forecast by Segmentation by Demand and Supply Side (by Value in USD Million) (2022-2029 9.1. South America Virtual Reality Shopping Market Size and Forecast, by Device (2022-2029) 9.2. South America Virtual Reality Shopping Market Size and Forecast, by Technology (2022-2029) 9.3. South America Virtual Reality Shopping Market Size and Forecast, by Component (2022-2029) 9.4. South America Virtual Reality Shopping Market Size and Forecast, by Application (2022-2029) 9.5. South America Virtual Reality Shopping Market Size and Forecast, by Country (2022-2029) 9.5.1. Brazil 9.5.1.1. Brazil Virtual Reality Shopping Market Size and Forecast, by Component (2022-2029) 9.5.1.2. Brazil Virtual Reality Shopping Market Size and Forecast, by Technology (2022-2029) 9.5.1.3. Brazil Virtual Reality Shopping Market Size and Forecast, by Component (2022-2029) 9.5.1.4. Brazil Virtual Reality Shopping Market Size and Forecast, by Application (2022-2029) 9.5.2. Argentina 9.5.2.1. Argentina Virtual Reality Shopping Market Size and Forecast, by Device (2022-2029) 9.5.2.2. Argentina Virtual Reality Shopping Market Size and Forecast, by Technology (2022-2029) 9.5.2.3. Argentina Virtual Reality Shopping Market Size and Forecast, by Component (2022-2029) 9.5.2.4. Argentina Virtual Reality Shopping Market Size and Forecast, by Application (2022-2029) 9.5.3. Rest Of South America 9.5.3.1. Rest Of South America Virtual Reality Shopping Market Size and Forecast, by Device (2022-2029) 9.5.3.2. Rest Of South America Virtual Reality Shopping Market Size and Forecast, by Technology (2022-2029) 9.5.3.3. Rest Of South America Virtual Reality Shopping Market Size and Forecast, by Component (2022-2029) 9.5.3.4. Rest Of South America Virtual Reality Shopping Market Size and Forecast, by Application (2022-2029) 10. Global Virtual Reality Shopping Market: Competitive Landscape 10.1. MMR Competition Matrix 10.2. Competitive Landscape 10.3. Key Players Benchmarking 10.3.1. Company Name 10.3.2. Service Segment 10.3.3. End-user Segment 10.3.4. Revenue (2022) 10.3.5. Company Locations 10.4. Leading Virtual Reality Shopping Market Companies, by Market Capitalization 10.5. Market Structure 10.5.1. Market Leaders 10.5.2. Market Followers 10.5.3. Emerging Players 10.6. Mergers and Acquisitions Details 11. Company Profile: Key Players 11.1. Unity Software Inc. (U.S.) 11.1.1. Company Overview 11.1.2. Business Portfolio 11.1.3. Financial Overview 11.1.4. SWOT Analysis 11.1.5. Strategic Analysis 11.1.6. Scale of Operation (Small, Medium, and Large) 11.1.7. Details on Partnership 11.1.8. Regulatory Accreditations and Certifications Received by Them 11.1.9. Awards Received by the Firm 11.1.10. Recent Developments 11.2. Barco NV 11.3. CyberGlove Systems Inc. 11.4. Samsung Electronics Co., Ltd. (South Korea) 11.5. Meta Platforms Inc. 11.6. Sensics Inc. 11.7. Sixense Enterprises, Inc. 11.8. Ultraleap Ltd. 11.9. Google LLC (Alphabet Inc.) 11.10. Microsoft Corporation 11.11. Sony Interactive Entertainment LLC 11.12. HTC Corporation 11.13. Qualcomm Incorporated 11.14. Nvidia Corporation 11.15. HaptX Inc. 11.16. Magic Leap 11.17. Marxent Labs LLC 11.18. Oculus VR 11.19. WorldViz 11.20. Firsthand Technology Inc. 12. Key Findings 13. Application Recommendations 14. Terms and Glossary
  • INQUIRE BEFORE BUYING