RPA & Hyper Automation Market: Global Industry Analysis and Forecast (2025-2032)

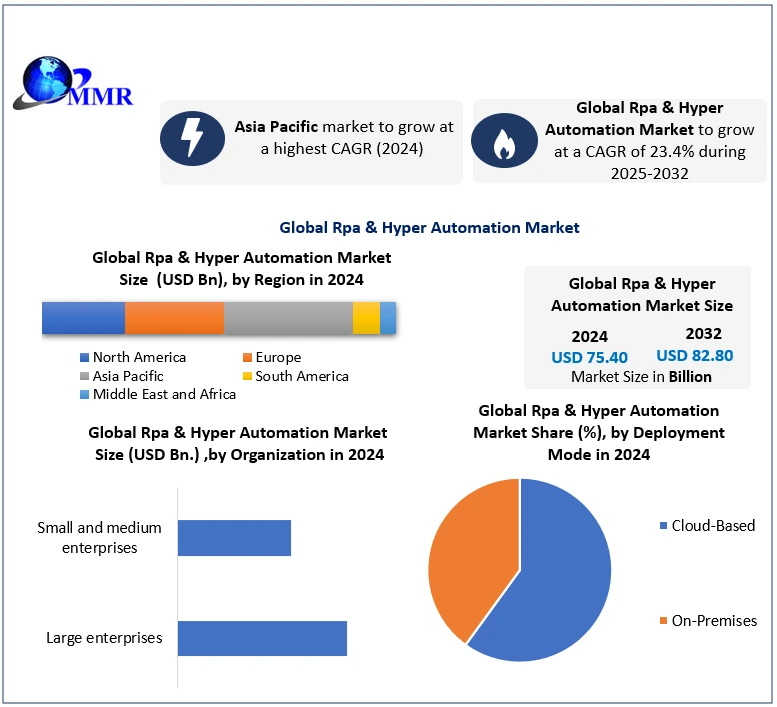
Global Rpa & Hyper Automation Market size was valued at USD 75.40 Bn in 2024, and the total Rpa Hyper Automation Market revenue is expected to grow at a CAGR of 23.4% from 2025 to 2032, reaching nearly USD 82.80 Bn

RPA & Hyper automation Market Overview:

Hyper automation is the combination of artificial intelligence (AL) and machine learning (ML) and robotic automation (RPA).this technology are help to enhance business operations, rise in demand for an automated solution for business continuity and planning is driving the growth of RPA and hyper automation market. This helps to simplify workflow and increases efficiency with minimum human errors also reducing operation cost. Rpa & Hyper Automation Market 2025-2032To know about the Research Methodology :- Request Free Sample Report Due to mordanozation hyper automation market is expected to witness significant growth. In some industries such as the manufacturing industry, pharmaceutical, automobile, etc. There are some jobs done by humans previously right now its perform by machine. Impact of COVID-19 on RPA and Hyper Automation Market In COVID-19 entire world in under the pressure of industrial losses, and many companies had to close their offices and shut down their factories, most of the employees started working from home at that time online communication is the key component. At that hard time when all industries are going through a crisis situation. At that time RPA became the new disruptive technology that offered innovation to the business world. It found application areas during COVID-19 in various sectors such as healthcare, education and public sectors. Governments and companies got help from the RPA robots to track patients, optimize supply chain processes, assist students and teachers in online classes and respond to the increased demand in online shopping these RPA robots help to work 24/7 without any disadvantage.

RPA & Hyper Automation Market Dynamics:

RPA with advanced technology such as al and ml and hyper automation extend the core automation. RPA and Hyper automation helps to increase efficiency to automate the process, reduce cost by using technology to make tasks easier, it makes the quality product in faster time with less human efforts with the help of accurate decision making, identifying an area of improvement and enhancing customer experience by providing instant of data. Hyper automation is especially advantageous for organizations with legacy operations or low automation levels. These organizations can see real results through digital process automation and infrastructure automation to increase connectivity, agility or efficiency of business operations. The use of robotic process automation there is no innovative thing. RPA is reducing the need for human power due to this there is increasing unemployment in the market this is the major disadvantage of RPA and hyper-automation. Hyper automation and RPA technologies are expensive and they need high maintenance. Also, there is a lack of technical ability Give employees a risk-free way to explore. The resulting familiarity and comfort level will ease implementation and also determine where training is needed or where issues may arise

RPA & Hyper Automation Market Segment Analysis:

By Organization Size, Small and medium size organizations have large CAGR during the forecast period this RPA market has encouraged these small and medium size organisations to invest in RPA and hyper automation market to grow their productivity and reduce the cost these enterprises select RPA for flexibility, lower technology risk, cost effectiveness, and improve organisations productivity. In small and medium size organisations increasing the use of automation in organisations will help them to increase the growth of the market. These small organisations have limitations regarding human resources and budget and need to retain their operational expenses. By Business Function, Sales & Marketing, Finance & Accounting, Human resources, Operation and supply chain, Information technology, are the different types of RPA and hyper automation market business In which service segment to hold a higher market during the forecast period. Services form an integral part of the software lifecycle, including deployment, integration, and product upgrade, maintenance, training, and consulting. Servers, apps, and managed services are the three types of services into which this segment is divided. Managed services are used for hosting and managing servers, applications, and networks for clients; these services are provided by third-party vendors. Professional services are obtained directly from parent companies. RPA and Hyper automation combine multiple technologies to automate complex business processes that involve decision making and continuous learning. Services segment holds a higher CAGR during the forecast period.

RPA & Hyper Automation Market Regional Insights

Among the region, Asia pacific is expected to grow at a CAGR of xx% during the forecast period. Asia pacific includes china, Japan, India, and the other countries in the region. In hyper automation market India, Japan, China these countries drive a large market. Small and large enterprises in APAC have become more aware of government regulations and compliances and started proactively adopting RPA and Hyper automation solutions. The adoption of AI technology by different verticals, such as the BFSI, manufacturing, and retail, is expected to be contributing to the high growth of the RPA and Hyper automation market. Rapid economic development, globalization, digitalization, and the increased adoption of cloud-based technologies are expected to drive the growth of the RPA and Hyper automation market in the Asia Pacific region. RPA & hyper automation market Europe is expected to second largest CAGR during the forecast period. market can help Europe to boost its opportunity and creative work mode. Europe is continuously investing and focusing on RPA and hyper automation in the past few years to grow their economy and growth of their market. Germany is one of the major manufacturing hub for machinery and electric equipment. RPA & hyper automation market helps companies decrease sing manual process in costs, automate customer service, order managements. The objective of the report is to present a comprehensive analysis of the market to the stakeholders in the industry. The past and current status of the industry with the forecasted market size and trends are presented in the report with the analysis of complicated data in simple language. The report covers all the aspects of the industry with a dedicated study of key players that include market leaders, followers, and new entrants. PORTER, PESTEL analysis with the potential impact of micro-economic factors of the market have been presented in the report. External as well as internal factors that are supposed to affect the business positively or negatively have been analyzed, which will give a clear futuristic view of the industry to the decision-makers. The report also helps in understanding the market dynamics, and structure by analyzing the market segments and projecting the market size. Clear representation of competitive analysis of key players by product, price, financial position, product portfolio, growth strategies, and regional presence in the market make the report investor’s guide.

RPA & Hyper Automation Market Scope: Inquiry Before Buying

Global RPA & Hyper Automation Market
Report Coverage Details
Base Year: 2024 Forecast Period: 2025-2032
Historical Data: 2019 to 2024 Market Size in 2024: USD 75.40 Bn.
Forecast Period 2025 to 2032 CAGR: 23.4% Market Size in 2032: USD 82.80 Bn.
Segments Covered: by Deployment Mode Cloud-Based On-Premises
by Organizations Large enterprises Small and medium enterprises
by Business Sales & marketing Finance & accounting Human resources Operation and supply chain Information technology Services
by End-User BFSI (Banking, Financial Services & Insurance) Healthcare & Pharmaceuticals Manufacturing IT & Telecom Retail Others

RPA & Hyper Automation Market, by Region

North America (United States, Canada and Mexico) Europe (UK, France, Germany, Italy, Spain, Sweden, Austria and Rest of Europe) Asia Pacific (China, South Korea, Japan, India, Australia, Indonesia, Malaysia, Vietnam, Taiwan, Bangladesh, Pakistan and Rest of APAC) Middle East and Africa (South Africa, GCC, Egypt, Nigeria and Rest) South America (Brazil, Argentina and Rest of South America)

RPA & Hyper Automation Market, Key Players

1. IBM (US) 2. Microsoft (US) 3. SAP (Germany) 4. Alteryx (US) 5. Appian (US) 6. Juniper Networks (US) 7. NICE (Israel) 8. Zendesk (US) 9. Pegasystems (US) 10. Automation Anywhere (US) 11. UiPath (US) 12. ProcessMaker (US) 13. SolveXia (Australia) 14. PagerDuty (US)

Frequently Asked Questions:

1. What is the forecast period considered for the RPA & hyper Automation Market report? Ans. The forecast period for the RPA hyper automation market is 2025-2032. 2. Which key factors are hindering the growth of the RPA & hyper automation? Ans. Unemployment due to hyper automation and RPA is the major factor which is hindering the growth. 3. What is the compound annual growth rate (CAGR) of the RPA & hyper automation market for the forecast period? Ans. The compound growth rate of 23.4% of the RPA hyper automation market for the forecast period. 4. What are the key factors driving the growth of the market? Ans. RPA and Hyper automation helps to increase efficiency to automate the process, and reduce cost by using technology to make tasks easier. 5. Which are the worldwide major key players covered for the RPA & hyper automation market report? Ans. IBM, Microsoft (US), SAP (Germany), Alteryx (US), Appian (US), and Juniper Networks this is the top five key players in the market.
1. Rpa & Hyper Automation Market Introduction 1.1. Study Assumption and Market Definition 1.2. Scope of the Study 1.3. Executive Summary 2. Global Rpa & Hyper Automation Market: Competitive Landscape 2.1. MMR Competition Matrix 2.2. Competitive Landscape 2.3. Key Players Benchmarking 2.3.1. Company Name 2.3.2. Business Segment 2.3.3. End-user Segment 2.3.4. Revenue (2024) 2.3.5. Company Locations 2.4. Leading Rpa & Hyper Automation Market Companies, by market capitalization 2.5. Market Structure 2.5.1. Market Leaders 2.5.2. Market Followers 2.5.3. Emerging Players 2.6. Mergers and Acquisitions Details 3. Rpa & Hyper Automation Market: Dynamics 3.1. Rpa & Hyper Automation Market Trends by Region 3.1.1. North America Rpa & Hyper Automation Market Trends 3.1.2. Europe Rpa & Hyper Automation Market Trends 3.1.3. Asia Pacific Rpa & Hyper Automation Market Trends 3.1.4. Middle East and Africa Rpa & Hyper Automation Market Trends 3.1.5. South America Rpa & Hyper Automation Market Trends 3.2. Rpa & Hyper Automation Market Dynamics by Region 3.2.1. North America 3.2.1.1. North America Rpa & Hyper Automation Market Drivers 3.2.1.2. North America Rpa & Hyper Automation Market Restraints 3.2.1.3. North America Rpa & Hyper Automation Market Opportunities 3.2.1.4. North America Rpa & Hyper Automation Market Challenges 3.2.2. Europe 3.2.2.1. Europe Rpa & Hyper Automation Market Drivers 3.2.2.2. Europe Rpa & Hyper Automation Market Restraints 3.2.2.3. Europe Rpa & Hyper Automation Market Opportunities 3.2.2.4. Europe Rpa & Hyper Automation Market Challenges 3.2.3. Asia Pacific 3.2.3.1. Asia Pacific Rpa & Hyper Automation Market Drivers 3.2.3.2. Asia Pacific Rpa & Hyper Automation Market Restraints 3.2.3.3. Asia Pacific Rpa & Hyper Automation Market Opportunities 3.2.3.4. Asia Pacific Rpa & Hyper Automation Market Challenges 3.2.4. Middle East and Africa 3.2.4.1. Middle East and Africa Rpa & Hyper Automation Market Drivers 3.2.4.2. Middle East and Africa Rpa & Hyper Automation Market Restraints 3.2.4.3. Middle East and Africa Rpa & Hyper Automation Market Opportunities 3.2.4.4. Middle East and Africa Rpa & Hyper Automation Market Challenges 3.2.5. South America 3.2.5.1. South America Rpa & Hyper Automation Market Drivers 3.2.5.2. South America Rpa & Hyper Automation Market Restraints 3.2.5.3. South America Rpa & Hyper Automation Market Opportunities 3.2.5.4. South America Rpa & Hyper Automation Market Challenges 3.3. PORTER’s Five Forces Analysis 3.4. PESTLE Analysis 3.5. Technology Roadmap 3.6. Regulatory Landscape by Region 3.6.1. North America 3.6.2. Europe 3.6.3. Asia Pacific 3.6.4. Middle East and Africa 3.6.5. South America 3.7. Key Opinion Leader Analysis For Rpa & Hyper Automation Industry 3.8. Analysis of Government Schemes and Initiatives For Rpa & Hyper Automation Industry 3.9. Rpa & Hyper Automation Market Trade Analysis 3.10. The Global Pandemic Impact on Rpa & Hyper Automation Market 4. Rpa & Hyper Automation Market: Global Market Size and Forecast by Segmentation by Demand and Supply Side (by Value in USD Million) 2024-2032 4.1. Rpa & Hyper Automation Market Size and Forecast, by Deployment Mode (2024-2032) 4.1.1. Cloud-Based 4.1.2. On-Premises 4.2. Rpa & Hyper Automation Market Size and Forecast, by Organizations (2024-2032) 4.2.1. Large enterprises 4.2.2. Small and medium enterprises 4.3. Rpa & Hyper Automation Market Size and Forecast, by Business (2024-2032) 4.3.1. Sales & marketing 4.3.2. Finance & accounting 4.3.3. Human resources 4.3.4. Operation and supply chain 4.3.5. Information technology 4.3.6. Services 4.4. Rpa & Hyper Automation Market Size and Forecast, by End User (2024-2032) 4.4.1. BFSI (Banking, Financial Services & Insurance) 4.4.2. Healthcare & Pharmaceuticals 4.4.3. Manufacturing 4.4.4. IT & Telecom 4.4.5. Retail 4.4.6. Others 4.5. Rpa & Hyper Automation Market Size and Forecast, by Region (2024-2032) 4.5.1. North America 4.5.2. Europe 4.5.3. Asia Pacific 4.5.4. Middle East and Africa 4.5.5. South America 5. North America Rpa & Hyper Automation Market Size and Forecast by Segmentation (by Value in USD Million) 2024-2032 5.1. North America Rpa & Hyper Automation Market Size and Forecast, by Deployment Mode (2024-2032) 5.1.1. Cloud-Based 5.1.2. On-Premises 5.2. North America Rpa & Hyper Automation Market Size and Forecast, by Organizations (2024-2032) 5.2.1. Large enterprises 5.2.2. Small and medium enterprises 5.3. North America Rpa & Hyper Automation Market Size and Forecast, by Business (2024-2032) 5.3.1. Sales & marketing 5.3.2. Finance & accounting 5.3.3. Human resources 5.3.4. Operation and supply chain 5.3.5. Information technology 5.3.6. Services 5.4. North America Rpa & Hyper Automation Market Size and Forecast, by End User (2024-2032) 5.4.1. BFSI (Banking, Financial Services & Insurance) 5.4.2. Healthcare & Pharmaceuticals 5.4.3. Manufacturing 5.4.4. IT & Telecom 5.4.5. Retail 5.4.6. Others 5.5. North America Rpa & Hyper Automation Market Size and Forecast, by Country (2024-2032) 5.5.1. United States 5.5.1.1. United States Rpa & Hyper Automation Market Size and Forecast, by Deployment Mode (2024-2032) 5.5.1.1.1. Cloud-Based 5.5.1.1.2. On-Premises 5.5.1.2. United States Rpa & Hyper Automation Market Size and Forecast, by Organizations (2024-2032) 5.5.1.2.1. Large enterprises 5.5.1.2.2. Small and medium enterprises 5.5.1.3. United States Rpa & Hyper Automation Market Size and Forecast, by Business (2024-2032) 5.5.1.3.1. Sales & marketing 5.5.1.3.2. Finance & accounting 5.5.1.3.3. Human resources 5.5.1.3.4. Operation and supply chain 5.5.1.3.5. Information technology 5.5.1.3.6. Services 5.5.1.4. United States Rpa & Hyper Automation Market Size and Forecast, by End User (2024-2032) 5.5.1.4.1. BFSI (Banking, Financial Services & Insurance) 5.5.1.4.2. Healthcare & Pharmaceuticals 5.5.1.4.3. Manufacturing 5.5.1.4.4. IT & Telecom 5.5.1.4.5. Retail 5.5.1.4.6. Others 5.5.2. Canada 5.5.2.1. Canada Rpa & Hyper Automation Market Size and Forecast, by Deployment Mode (2024-2032) 5.5.2.1.1. Cloud-Based 5.5.2.1.2. On-Premises 5.5.2.2. Canada Rpa & Hyper Automation Market Size and Forecast, by Organizations (2024-2032) 5.5.2.2.1. Large enterprises 5.5.2.2.2. Small and medium enterprises 5.5.2.3. Canada Rpa & Hyper Automation Market Size and Forecast, by Business (2024-2032) 5.5.2.3.1. Sales & marketing 5.5.2.3.2. Finance & accounting 5.5.2.3.3. Human resources 5.5.2.3.4. Operation and supply chain 5.5.2.3.5. Information technology 5.5.2.3.6. Services 5.5.2.4. Canada Rpa & Hyper Automation Market Size and Forecast, by End User (2024-2032) 5.5.2.4.1. BFSI (Banking, Financial Services & Insurance) 5.5.2.4.2. Healthcare & Pharmaceuticals 5.5.2.4.3. Manufacturing 5.5.2.4.4. IT & Telecom 5.5.2.4.5. Retail 5.5.2.4.6. Others 5.5.3. Mexico 5.5.3.1. Mexico Rpa & Hyper Automation Market Size and Forecast, by Deployment Mode (2024-2032) 5.5.3.1.1. Cloud-Based 5.5.3.1.2. On-Premises 5.5.3.2. Mexico Rpa & Hyper Automation Market Size and Forecast, by Organizations (2024-2032) 5.5.3.2.1. Large enterprises 5.5.3.2.2. Small and medium enterprises 5.5.3.3. Mexico Rpa & Hyper Automation Market Size and Forecast, by Business (2024-2032) 5.5.3.3.1. Sales & marketing 5.5.3.3.2. Finance & accounting 5.5.3.3.3. Human resources 5.5.3.3.4. Operation and supply chain 5.5.3.3.5. Information technology 5.5.3.3.6. Services 5.5.3.4. Mexico Rpa & Hyper Automation Market Size and Forecast, by End User (2024-2032) 5.5.3.4.1. BFSI (Banking, Financial Services & Insurance) 5.5.3.4.2. Healthcare & Pharmaceuticals 5.5.3.4.3. Manufacturing 5.5.3.4.4. IT & Telecom 5.5.3.4.5. Retail 5.5.3.4.6. Others 6. Europe Rpa & Hyper Automation Market Size and Forecast by Segmentation (by Value in USD Million) 2024-2032 6.1. Europe Rpa & Hyper Automation Market Size and Forecast, by Deployment Mode (2024-2032) 6.2. Europe Rpa & Hyper Automation Market Size and Forecast, by Organizations (2024-2032) 6.3. Europe Rpa & Hyper Automation Market Size and Forecast, by Business (2024-2032) 6.4. Europe Rpa & Hyper Automation Market Size and Forecast, by End User (2024-2032) 6.5. Europe Rpa & Hyper Automation Market Size and Forecast, by Country (2024-2032) 6.5.1. United Kingdom 6.5.1.1. United Kingdom Rpa & Hyper Automation Market Size and Forecast, by Deployment Mode (2024-2032) 6.5.1.2. United Kingdom Rpa & Hyper Automation Market Size and Forecast, by Organizations (2024-2032) 6.5.1.3. United Kingdom Rpa & Hyper Automation Market Size and Forecast, by Business (2024-2032) 6.5.1.4. United Kingdom Rpa & Hyper Automation Market Size and Forecast, by End User (2024-2032) 6.5.2. France 6.5.2.1. France Rpa & Hyper Automation Market Size and Forecast, by Deployment Mode (2024-2032) 6.5.2.2. France Rpa & Hyper Automation Market Size and Forecast, by Organizations (2024-2032) 6.5.2.3. France Rpa & Hyper Automation Market Size and Forecast, by Business (2024-2032) 6.5.2.4. France Rpa & Hyper Automation Market Size and Forecast, by End User (2024-2032) 6.5.3. Germany 6.5.3.1. Germany Rpa & Hyper Automation Market Size and Forecast, by Deployment Mode (2024-2032) 6.5.3.2. Germany Rpa & Hyper Automation Market Size and Forecast, by Organizations (2024-2032) 6.5.3.3. Germany Rpa & Hyper Automation Market Size and Forecast, by Business (2024-2032) 6.5.3.4. Germany Rpa & Hyper Automation Market Size and Forecast, by End User (2024-2032) 6.5.4. Italy 6.5.4.1. Italy Rpa & Hyper Automation Market Size and Forecast, by Deployment Mode (2024-2032) 6.5.4.2. Italy Rpa & Hyper Automation Market Size and Forecast, by Organizations (2024-2032) 6.5.4.3. Italy Rpa & Hyper Automation Market Size and Forecast, by Business (2024-2032) 6.5.4.4. Italy Rpa & Hyper Automation Market Size and Forecast, by End User (2024-2032) 6.5.5. Spain 6.5.5.1. Spain Rpa & Hyper Automation Market Size and Forecast, by Deployment Mode (2024-2032) 6.5.5.2. Spain Rpa & Hyper Automation Market Size and Forecast, by Organizations (2024-2032) 6.5.5.3. Spain Rpa & Hyper Automation Market Size and Forecast, by Business (2024-2032) 6.5.5.4. Spain Rpa & Hyper Automation Market Size and Forecast, by End User (2024-2032) 6.5.6. Sweden 6.5.6.1. Sweden Rpa & Hyper Automation Market Size and Forecast, by Deployment Mode (2024-2032) 6.5.6.2. Sweden Rpa & Hyper Automation Market Size and Forecast, by Organizations (2024-2032) 6.5.6.3. Sweden Rpa & Hyper Automation Market Size and Forecast, by Business (2024-2032) 6.5.6.4. Sweden Rpa & Hyper Automation Market Size and Forecast, by End User (2024-2032) 6.5.7. Austria 6.5.7.1. Austria Rpa & Hyper Automation Market Size and Forecast, by Deployment Mode (2024-2032) 6.5.7.2. Austria Rpa & Hyper Automation Market Size and Forecast, by Organizations (2024-2032) 6.5.7.3. Austria Rpa & Hyper Automation Market Size and Forecast, by Business (2024-2032) 6.5.7.4. Austria Rpa & Hyper Automation Market Size and Forecast, by End User (2024-2032) 6.5.8. Rest of Europe 6.5.8.1. Rest of Europe Rpa & Hyper Automation Market Size and Forecast, by Deployment Mode (2024-2032) 6.5.8.2. Rest of Europe Rpa & Hyper Automation Market Size and Forecast, by Organizations (2024-2032) 6.5.8.3. Rest of Europe Rpa & Hyper Automation Market Size and Forecast, by Business (2024-2032) 6.5.8.4. Rest of Europe Rpa & Hyper Automation Market Size and Forecast, by End User (2024-2032) 7. Asia Pacific Rpa & Hyper Automation Market Size and Forecast by Segmentation (by Value in USD Million) 2024-2032 7.1. Asia Pacific Rpa & Hyper Automation Market Size and Forecast, by Deployment Mode (2024-2032) 7.2. Asia Pacific Rpa & Hyper Automation Market Size and Forecast, by Organizations (2024-2032) 7.3. Asia Pacific Rpa & Hyper Automation Market Size and Forecast, by Business (2024-2032) 7.4. Asia Pacific Rpa & Hyper Automation Market Size and Forecast, by End User (2024-2032) 7.5. Asia Pacific Rpa & Hyper Automation Market Size and Forecast, by Country (2024-2032) 7.5.1. China 7.5.1.1. China Rpa & Hyper Automation Market Size and Forecast, by Deployment Mode (2024-2032) 7.5.1.2. China Rpa & Hyper Automation Market Size and Forecast, by Organizations (2024-2032) 7.5.1.3. China Rpa & Hyper Automation Market Size and Forecast, by Business (2024-2032) 7.5.1.4. China Rpa & Hyper Automation Market Size and Forecast, by End User (2024-2032) 7.5.2. S Korea 7.5.2.1. S Korea Rpa & Hyper Automation Market Size and Forecast, by Deployment Mode (2024-2032) 7.5.2.2. S Korea Rpa & Hyper Automation Market Size and Forecast, by Organizations (2024-2032) 7.5.2.3. S Korea Rpa & Hyper Automation Market Size and Forecast, by Business (2024-2032) 7.5.2.4. S Korea Rpa & Hyper Automation Market Size and Forecast, by End User (2024-2032) 7.5.3. Japan 7.5.3.1. Japan Rpa & Hyper Automation Market Size and Forecast, by Deployment Mode (2024-2032) 7.5.3.2. Japan Rpa & Hyper Automation Market Size and Forecast, by Organizations (2024-2032) 7.5.3.3. Japan Rpa & Hyper Automation Market Size and Forecast, by Business (2024-2032) 7.5.3.4. Japan Rpa & Hyper Automation Market Size and Forecast, by End User (2024-2032) 7.5.4. India 7.5.4.1. India Rpa & Hyper Automation Market Size and Forecast, by Deployment Mode (2024-2032) 7.5.4.2. India Rpa & Hyper Automation Market Size and Forecast, by Organizations (2024-2032) 7.5.4.3. India Rpa & Hyper Automation Market Size and Forecast, by Business (2024-2032) 7.5.4.4. India Rpa & Hyper Automation Market Size and Forecast, by End User (2024-2032) 7.5.5. Australia 7.5.5.1. Australia Rpa & Hyper Automation Market Size and Forecast, by Deployment Mode (2024-2032) 7.5.5.2. Australia Rpa & Hyper Automation Market Size and Forecast, by Organizations (2024-2032) 7.5.5.3. Australia Rpa & Hyper Automation Market Size and Forecast, by Business (2024-2032) 7.5.5.4. Australia Rpa & Hyper Automation Market Size and Forecast, by End User (2024-2032) 7.5.6. Indonesia 7.5.6.1. Indonesia Rpa & Hyper Automation Market Size and Forecast, by Deployment Mode (2024-2032) 7.5.6.2. Indonesia Rpa & Hyper Automation Market Size and Forecast, by Organizations (2024-2032) 7.5.6.3. Indonesia Rpa & Hyper Automation Market Size and Forecast, by Business (2024-2032) 7.5.6.4. Indonesia Rpa & Hyper Automation Market Size and Forecast, by End User (2024-2032) 7.5.7. Malaysia 7.5.7.1. Malaysia Rpa & Hyper Automation Market Size and Forecast, by Deployment Mode (2024-2032) 7.5.7.2. Malaysia Rpa & Hyper Automation Market Size and Forecast, by Organizations (2024-2032) 7.5.7.3. Malaysia Rpa & Hyper Automation Market Size and Forecast, by Business (2024-2032) 7.5.7.4. Malaysia Rpa & Hyper Automation Market Size and Forecast, by End User (2024-2032) 7.5.8. Vietnam 7.5.8.1. Vietnam Rpa & Hyper Automation Market Size and Forecast, by Deployment Mode (2024-2032) 7.5.8.2. Vietnam Rpa & Hyper Automation Market Size and Forecast, by Organizations (2024-2032) 7.5.8.3. Vietnam Rpa & Hyper Automation Market Size and Forecast, by Business (2024-2032) 7.5.8.4. Vietnam Rpa & Hyper Automation Market Size and Forecast, by End User (2024-2032) 7.5.9. Taiwan 7.5.9.1. Taiwan Rpa & Hyper Automation Market Size and Forecast, by Deployment Mode (2024-2032) 7.5.9.2. Taiwan Rpa & Hyper Automation Market Size and Forecast, by Organizations (2024-2032) 7.5.9.3. Taiwan Rpa & Hyper Automation Market Size and Forecast, by Business (2024-2032) 7.5.9.4. Taiwan Rpa & Hyper Automation Market Size and Forecast, by End User (2024-2032) 7.5.10. Rest of Asia Pacific 7.5.10.1. Rest of Asia Pacific Rpa & Hyper Automation Market Size and Forecast, by Deployment Mode (2024-2032) 7.5.10.2. Rest of Asia Pacific Rpa & Hyper Automation Market Size and Forecast, by Organizations (2024-2032) 7.5.10.3. Rest of Asia Pacific Rpa & Hyper Automation Market Size and Forecast, by Business (2024-2032) 7.5.10.4. Rest of Asia Pacific Rpa & Hyper Automation Market Size and Forecast, by End User (2024-2032) 8. Middle East and Africa Rpa & Hyper Automation Market Size and Forecast by Segmentation (by Value in USD Million) 2024-2032 8.1. Middle East and Africa Rpa & Hyper Automation Market Size and Forecast, by Deployment Mode (2024-2032) 8.2. Middle East and Africa Rpa & Hyper Automation Market Size and Forecast, by Organizations (2024-2032) 8.3. Middle East and Africa Rpa & Hyper Automation Market Size and Forecast, by Business (2024-2032) 8.4. Middle East and Africa Rpa & Hyper Automation Market Size and Forecast, by End User (2024-2032) 8.5. Middle East and Africa Rpa & Hyper Automation Market Size and Forecast, by Country (2024-2032) 8.5.1. South Africa 8.5.1.1. South Africa Rpa & Hyper Automation Market Size and Forecast, by Deployment Mode (2024-2032) 8.5.1.2. South Africa Rpa & Hyper Automation Market Size and Forecast, by Organizations (2024-2032) 8.5.1.3. South Africa Rpa & Hyper Automation Market Size and Forecast, by Business (2024-2032) 8.5.1.4. South Africa Rpa & Hyper Automation Market Size and Forecast, by End User (2024-2032) 8.5.2. GCC 8.5.2.1. GCC Rpa & Hyper Automation Market Size and Forecast, by Deployment Mode (2024-2032) 8.5.2.2. GCC Rpa & Hyper Automation Market Size and Forecast, by Organizations (2024-2032) 8.5.2.3. GCC Rpa & Hyper Automation Market Size and Forecast, by Business (2024-2032) 8.5.2.4. GCC Rpa & Hyper Automation Market Size and Forecast, by End User (2024-2032) 8.5.3. Nigeria 8.5.3.1. Nigeria Rpa & Hyper Automation Market Size and Forecast, by Deployment Mode (2024-2032) 8.5.3.2. Nigeria Rpa & Hyper Automation Market Size and Forecast, by Organizations (2024-2032) 8.5.3.3. Nigeria Rpa & Hyper Automation Market Size and Forecast, by Business (2024-2032) 8.5.3.4. Nigeria Rpa & Hyper Automation Market Size and Forecast, by End User (2024-2032) 8.5.4. Rest of ME&A 8.5.4.1. Rest of ME&A Rpa & Hyper Automation Market Size and Forecast, by Deployment Mode (2024-2032) 8.5.4.2. Rest of ME&A Rpa & Hyper Automation Market Size and Forecast, by Organizations (2024-2032) 8.5.4.3. Rest of ME&A Rpa & Hyper Automation Market Size and Forecast, by Business (2024-2032) 8.5.4.4. Rest of ME&A Rpa & Hyper Automation Market Size and Forecast, by End User (2024-2032) 9. South America Rpa & Hyper Automation Market Size and Forecast by Segmentation (by Value in USD Million) 2024-2032 9.1. South America Rpa & Hyper Automation Market Size and Forecast, by Deployment Mode (2024-2032) 9.2. South America Rpa & Hyper Automation Market Size and Forecast, by Organizations (2024-2032) 9.3. South America Rpa & Hyper Automation Market Size and Forecast, by Business(2024-2032) 9.4. South America Rpa & Hyper Automation Market Size and Forecast, by End User (2024-2032) 9.5. South America Rpa & Hyper Automation Market Size and Forecast, by Country (2024-2032) 9.5.1. Brazil 9.5.1.1. Brazil Rpa & Hyper Automation Market Size and Forecast, by Deployment Mode (2024-2032) 9.5.1.2. Brazil Rpa & Hyper Automation Market Size and Forecast, by Organizations (2024-2032) 9.5.1.3. Brazil Rpa & Hyper Automation Market Size and Forecast, by Business (2024-2032) 9.5.1.4. Brazil Rpa & Hyper Automation Market Size and Forecast, by End User (2024-2032) 9.5.2. Argentina 9.5.2.1. Argentina Rpa & Hyper Automation Market Size and Forecast, by Deployment Mode (2024-2032) 9.5.2.2. Argentina Rpa & Hyper Automation Market Size and Forecast, by Organizations (2024-2032) 9.5.2.3. Argentina Rpa & Hyper Automation Market Size and Forecast, by Business (2024-2032) 9.5.2.4. Argentina Rpa & Hyper Automation Market Size and Forecast, by End User (2024-2032) 9.5.3. Rest Of South America 9.5.3.1. Rest Of South America Rpa & Hyper Automation Market Size and Forecast, by Deployment Mode (2024-2032) 9.5.3.2. Rest Of South America Rpa & Hyper Automation Market Size and Forecast, by Organizations (2024-2032) 9.5.3.3. Rest Of South America Rpa & Hyper Automation Market Size and Forecast, by Business (2024-2032) 9.5.3.4. Rest Of South America Rpa & Hyper Automation Market Size and Forecast, by End User (2024-2032) 10. Company Profile: Key Players 10.1. IBM (US) 10.1.1. Company Overview 10.1.2. Business Portfolio 10.1.3. Financial Overview 10.1.4. SWOT Analysis 10.1.5. Strategic Analysis 10.1.6. Scale of Operation (small, medium, and large) 10.1.7. Details on Partnership 10.1.8. Regulatory Accreditations and Certifications Received by Them 10.1.9. Awards Received by the Firm 10.1.10. Recent Developments 10.2. Microsoft (US) 10.3. SAP (Germany) 10.4. Alteryx (US) 10.5. Appian (US) 10.6. Juniper Networks (US) 10.7. NICE (Israel) 10.8. Zendesk (US) 10.9. Pegasystems (US) 10.10. Automation Anywhere (US) 10.11. UiPath (US) 10.12. ProcessMaker (US) 10.13. SolveXia (Australia) 10.14. PagerDuty (US) 11. Key Findings 12. Industry Recommendations 13. Rpa & Hyper Automation Market: Research Methodology 14. Terms and Glossary
  • INQUIRE BEFORE BUYING
MMRLogo
America's Fastest Growing Market Research Firm