
North America Multi-Touchscreen Market Size – Industry Structure Evaluation, Demand Drivers Analysis, Country-wise Growth Analysis and Identification, Competitive Positioning Review & Market Size Forecast to 2017
Overview
North America MultiTouchscreen Market size is expected to reach by 2027, at a CAGR of 5.6% during the forecast period.
The report includes the analysis of impact of COVID-19 lock-down on the revenue of market leaders, followers, and disrupters. Since lock down was implemented differently in different regions and countries, impact of same is also different by regions and segments. The report has covered the current short term and long term impact on the market, same will help decision makers to prepare the outline for short term and long term strategies for companies by region.
To know about the Research Methodology:-Request Free Sample Report
Multi-touch, in a computing context, is referred to an interface technology that enables input through pressure and gestures across multiple points on the surface of a device. Although these are most commonly used with touch screens on handheld devices, like smartphones and tablets, yet the multi-touch has been adapted for other surfaces as well. These include touchpads and mice, whiteboards, tables and walls. Gestures for multi-touch interfaces are often been carefully selected to be similar in the real-life movements, so as to maintain that the actions are intuitive and easily learned.
Multi-touch screens have become increasingly popular in North America as well as globally. It brings up the desire to add greater functionality to the already present user interface. Normal button pressing has evolved into a more sophisticated interaction such as two-finger pinch-to-zoom along with other complex gestures. Adding to this new trend toward larger touchscreens applied in collaboration, the multi-user applications and the requirement for touch sensors are capable of a better performance.
Some touch sensors have now made it possible to utilize an infinite number of touch points. But there are some applications that require robust touch interactivity as well. Being able to track a greater number of touch points further enables software developers to create increasingly complex applications thereby acting as a driver for the market growth, with a broader variety of gestures recognized. Smartphone and tablets have become some of the largest segment for the multi-touchscreen application globally.
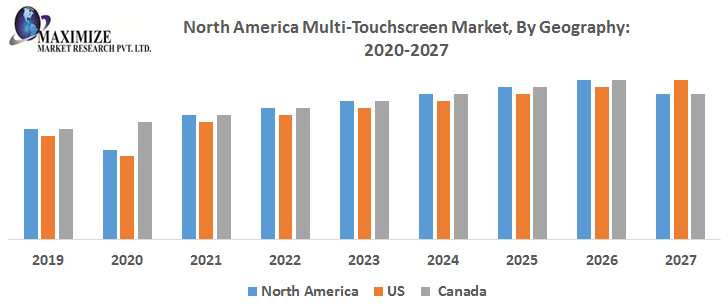
North America is one of the major markets for Multi-Touchscreen North America with U.S. and Canada forming the two major regions profiled under the scope of this report. Touch sensor manufacturers in North America are engaged in an arms race, each striving to achieve a greater capacity of touch points. This competitive escalation is instrumental in pushing the industry forward, but focusing on specs alone obscures the more important issue of understanding the touch requirements related to each unique application thereby becoming a hindrance to market growth.
North America Multi-Touchscreen Market, Key Highlights:
• North America Multi-Touchscreen market size analysis and forecast
• Comprehensive study and analysis of market drivers, restraints, and opportunities influencing the growth of the North America Multi-Touchscreen market
• North America Multi-Touchscreen Market segmentation on the basis of product, application, and geography
• North America Multi-Touchscreen Market strategic analysis with respect to individual growth trends, future prospects along with a contribution of various sub-market stakeholders have been considered under the scope of study
• North America Multi-Touchscreen Market analysis and forecast for major countries has been provided.
• Profiling of key industry players, their strategic perspective, market positioning and analysis of core competencies
• Competitive landscape of the key players operating in the North America Multi-Touchscreen Market including competitive developments, investments, and strategic expansion.
Key players of the North America Multi-Touchscreen Market:
Apple Inc.
Hp Development Company, L.P.
3M
Gesturetek
Displax
Immersion Corporation
Fujitsu
Panasonic Corporation
Samsung Electronics Co. Ltd.
Tpk Holding Co., Ltd.
Microsoft Corporation
Freescale Gigabyte
LG Display
Corning Inc.
Atmel Corporation
Cypress Semiconductor Corporation
Synaptics Incorporated
Wintek Corporation
Sharp Corporation
Stantum
The scope of the North America Multi-Touchscreen Market: Inquire before buying
The research report segments North America Multi-Touchscreen Market based on product, application, and geography.
North America Multi-Touchscreen Market, by Product:
• Smart phones
• Tablets
• Laptops
• Televisions/LCD
• Tables
• Floors
North America Multi-Touchscreen Market, by Application:
• Entertainment
• Infotainment
• Enterprises
• Others
North America Multi-Touchscreen Market, By Geography:
• North America
o US
o Canada
North America Multi-Touchscreen Market, Geographic Analysis
• Breakdown of US Multi-Touchscreen market
• Breakdown of Canada Multi-Touchscreen market
Available Customization
Maximize Market Research offers customizations of reports according to the specific requirement of our clients.