Neon Gas Market Size, Share, Trends, Demand & Growth Forecast (2025–2032)

Global Neon Gas Market size was valued at USD 289.6 Mn. in 2024 and the total Neon Gas Market revenue is expected to grow by 7.9% from 2025 to 2032, reaching nearly USD 532.07 Mn. By 2032.

Neon Gas Market Overview:

Neon gas is a rare, inert noble gas obtained primarily through cryogenic air separation and valued for its high ionization potential, thermal stability, and unique luminescence. It plays a vital role in industries such as semiconductors, lasers, cryogenics, imaging, and specialty lighting. Over the years, neon has become indispensable to extreme ultraviolet (EUV) lithography machines, excimer lasers, and medical imaging systems. Historically dependent on Eastern European suppliers, particularly Ukraine and Russia, the market has shifted toward diversified global production and neon recycling technologies to reduce geopolitical risks and ensure supply security. Semiconductor manufacturing remains the key growth driver, with fabs in North America and East Asia stockpiling neon and investing in localized supply chains to safeguard operations from disruptions such as those caused by the 2022 Russia-Ukraine conflict. In addition, the growing adoption of laser-based medical treatments and the revival of neon lighting in luxury branding and retro designs are expanding demand. Regional investments in air separation units (ASUs) further reinforce supply stability. Sustainability initiatives and technological innovations are boosting the future of the neon gas market. Companies are increasingly focusing on recycling captured neon from semiconductor processes and adopting advanced gas purification techniques to minimize waste and costs. Strategic partnerships among gas producers, semiconductor manufacturers, and healthcare technology firms are also accelerating innovation and securing long-term contracts. This integration of efficiency, sustainability, and collaboration positions neon gas as a critical enabler in next-generation electronics, healthcare, and specialty lighting applications.Neon Gas Market Snapshot
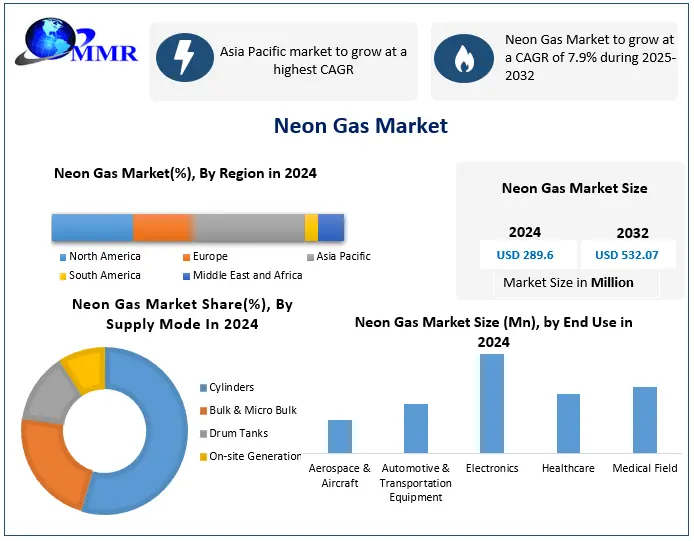
To know about the Research Methodology :- Request Free Sample Report

Neon Gas Market Dynamics

Increased use of Cryogenic Applications to drive the Neon Gas Market growth High-energy particle colliders, rocket propulsion systems, and wave meter tubes all use neon for cryogenic applications. Due to their low boiling point, neon and other noble gases are suitable for cryogenic applications. As a result, even at low temperatures, they are gaseous. In nuclear physics, high-energy particle colliders are utilized in the investigation of particles. The Higgs Boson particles were studied using the Large Hadron Collider which is the world's greatest high-energy collider.For most cutting-edge energy and scientific research which does not require severe cooling, neon is generally preferred over helium as a cryogenic coolant. This increased use of Neon in the Cryogenic application is driving the Neon Gas Market. Growth of Consumer Electronics and Semiconductors Sectors: Neon gas is widely used in the production of LCD screens, which have a wide range of applications in consumer electronics. Apart from that, it has several applications in the production of semiconductors, which are essential to the operation of any electronic device. As a result, the increasing growth of the consumer electronics sector is driving the growth of the Market.Rising demand for barcode scanners and laser sensors: Neon gas is used in the production of barcode scanners and laser sensors. Nowadays, because of increased industrialization and consumer demand, the demand for these barcode scanners and laser sensors is increased which increased the demand for Neon gas as well. This increased demand for Neon gas because it’s used in scanners and lasers drives the Neon Gas industry . Variations in Neon production costs Linits the Market Growth Neon gas is an extremely rare inert gas present at only about 18 parts per million (ppm) in the Earth’s atmosphere, making it far less abundant than other industrial gases. It is primarily obtained through the fractional distillation of liquid air, a process that also involves the separation of helium from the mixture. This highly complex and energy-intensive extraction method results in elevated production costs, contributing to the scarcity and premium pricing of neon gas in the global market.The high and volatile cost of neon gas has emerged as one of the major restraining factors impacting market growth. Its limited natural availability and dependence on specialized production facilities often lead to supply-demand imbalances, particularly during geopolitical disruptions or surges in industrial demand, as witnessed during the global semiconductor supply chain crisis. Consequently, the unpredictability of pricing poses a challenge for industries that rely heavily on neon, such as semiconductors, lasers, and specialty lighting. Many consumers and end-user industries are increasingly shifting toward alternative gases and technologies that partially substitute neon’s role. This trend is gradually reducing the growth potential of the neon gas market, despite its critical importance in high-tech applications.

Global Neon Gas Market Segment Analysis

Based on the Type, the Neon Gas market is segmented into Low purity, High purity and Ultra- high purity. High Purity neon gas dominated the the Type Segment in 2024. This dominance is primarily driven by its widespread application in the semiconductor industry, where it is used in lithography processes, excimer lasers, and chip manufacturing. High purity neon ensures stable performance, precision, and reliability, which are critical for semiconductor fabrication, an industry witnessing exponential growth due to rising global demand for electronics, AI technologies, and electric vehicles. Also, high purity neon is preferred in medical lasers, imaging systems, and advanced research applications, where contamination-free performance is essential. While ultra-high purity neon is also used in highly specialized fields, its demand remains niche and limited compared to the broader applications of high purity neon. The expansion of semiconductor fabs in Asia-Pacific and North America, coupled with neon recycling initiatives, further reinforced the strong market position of high purity neon gas in 2024.Neon Gas Market by Type
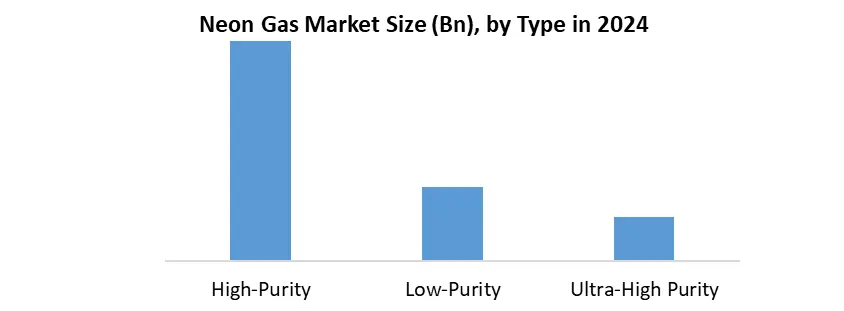
Based on Application, the Neon Gas market is segmented into Semiconductor,LCD, Imaging and Lighting and Others.The Semiconductor industry dominated the Application segment of Neon Gas market in 2024. The largest share of global consumption. This dominance is primarily attributed to the increasing demand for neon in semiconductor lithography and laser-based etching processes, particularly in extreme ultraviolet (EUV) lithography used for advanced microchip production. Neon provides the stability and high-energy discharge properties necessary for excimer lasers, which are critical in fabricating high-performance integrated circuits. The rapid expansion of the global electronics sector, boosted by surging demand for smartphones, cloud computing, electric vehicles, and AI-driven technologies, significantly boosted semiconductor manufacturing. To support this demand, major semiconductor fabs in Asia-Pacific (China, Taiwan, South Korea, Japan) and North America ramped up production capacity, thereby increasing neon gas consumption. Moreover, the geopolitical disruptions caused by the Russia-Ukraine conflict in 2022 highlighted vulnerabilities in neon supply chains, prompting fabs to secure long-term contracts, build local supply bases, and invest in neon recycling systems to stabilize availability. While other applications such as LCD displays, medical imaging, and specialty lighting also rely on neon, their scale of consumption remains relatively small compared to semiconductors. The strategic importance of neon in semiconductor fabrication, coupled with the ongoing digital transformation and global chip demand, firmly established the semiconductor sector as the largest consumer of neon gas in 2024.Neon Gas Market by application

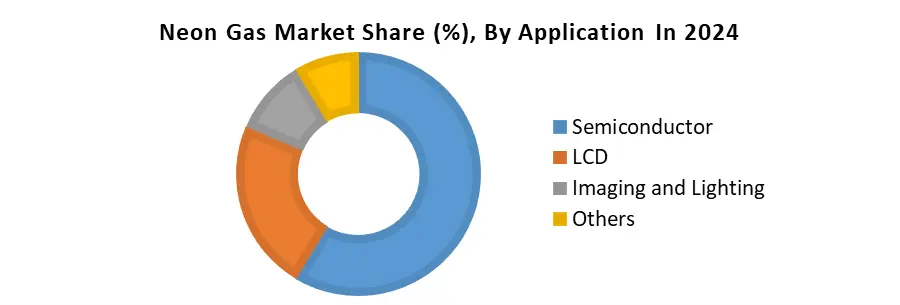
Neon Gas Market Regional Insights

The Asia Pacific dominated the Neon Gas Market in 2024. Driven by its position as the hub of semiconductor and electronics manufacturing. Countries such as China, Taiwan, South Korea, and Japan collectively account for over 70% of global semiconductor production, making the region the largest consumer of neon gas. Neon is critical for excimer lasers used in chip lithography, and the rising demand for smartphones, electric vehicles, and AI-enabled devices has directly fueled neon consumption. China has invested heavily in building new air separation units (ASUs) and neon recycling facilities to reduce reliance on imported supplies, especially after the supply disruptions caused by the Russia-Ukraine conflict in 2022, when Ukraine supplied nearly 50% of the world’s neon. For example, Chinese chipmakers such as SMIC significantly increased local neon procurement to support advanced chip production. Similarly, South Korea’s Samsung Electronics and SK Hynix expanded neon stockpiles to secure uninterrupted production of memory chips. Japan has also strengthened its neon supply chains by supporting domestic producers and partnering with global gas suppliers like Air Liquide and Linde, ensuring stable delivery for semiconductor fabs. Taiwan, home to TSMC, the world’s largest contract chipmaker, has accelerated neon recycling adoption to safeguard production. Although neon is also consumed in imaging and specialty lighting, its application in semiconductors remains the key growth driver. With Asia-Pacific leading global chip manufacturing and investing in resilient neon supply chains, the region firmly maintained its dominance in the neon gas market in 2024. A number of large-scale oxygen production facilities are now under construction in the Asia-Pacific area, with sustained growth expected, particularly in China. Through the forecast period, demand for neon gas in Asia Pacific is expected to rise, owing to robust consumption in fast-growing Asian economies. Japan's electronic goods sector is the world's third biggest, driven mostly by demand for semiconductors sold in the country.

Neon Gas Market Competitive Landscape

The Neon Gas Market is highly competitive and dominated by global industrial gas players (IGPs) serving essential applications in high-tech sectors (e.g. semiconductors), medical lasers, and specialty lighting. Companies such as Air Liquide (France) and Air Products and Chemicals Inc. (USA) have invested substantial resources expanding and securing their neon supply chains. Air Liquide (France) has commissioning a USD 250 million ASU and related processing facility in Idaho in 2025 to supply ultra-pure gases (including Neon) to semiconductor fabs (e.g. Micron) to support the resilience of the chip industry and reduce their reliance on Eastern European sources. Air Products (USA) has recycling-based neon recovery plants in Texas and Arizona that will produce neon equivalent to ~40% of current USA neon demand. Further, Air Products continues to sell multiple blends of high-purity neon-fluorine based gases for excimer lasers used in lithography and LASIK for specialty lighting. These firms are strategically aligned around securing their supply chains, sustainability, and specialty gas innovation to remain active in a strategic environment sensitive to supply.

Neon Gas Market Recent Development

• February 04, 2025, Air Liquide will invest in a large-scale Air Separation Unit (ASU) on Japan’s Naoshima Island, set to begin operations in 2027. The plant will supply oxygen, nitrogen, argon, and neon, supporting Mitsubishi Materials’ copper production and strengthening Japan’s semiconductor supply chain. Backed by a grant from METI, the project boosts domestic neon production and rare gas security. • May 22, 2025, Messer has inaugurated a new electronics and specialty gases facility in Coolbaugh Township, Pennsylvania, to meet rising industry demand. The plant will produce krypton, neon, and xenon for the merchant market,

Neon Gas Market Recent Trends

Category Key Trend Example Product Market Impact
Semiconductor Demand Surge in demand for ultra-high purity neon for chip manufacturing Air Liquide and Linde supplying neon for EUV lithography at ASML and Micron fabs Drives global neon price volatility and incentivizes capacity expansion and stockpiling
Supply Chain Resilience Diversification of neon production away from Eastern Europe Air Products and Messer investing in new ASUs in U.S. and Japan with rare gas recovery units Reduces geopolitical risk and stabilizes availability for critical industries
Medical & Laser Use Growing use of neon in lasers for eye surgery, diagnostics, and precision tools Matheson Tri-Gas offering He-Ne laser gas mixtures for ophthalmology Expands neon’s role in healthcare and scientific instrumentation

Neon Gas Market Scope: Inquiry Before Buying

Neon Gas Market
Report Coverage Details
Base Year: 2024 Forecast Period: 2025-2032
Historical Data: 2019 to 2024 Market Size in 2024: USD 289.6 Mn.
Forecast Period 2025 to 2032 CAGR: 7.9% Market Size in 2032: USD 532.07 Mn.
Segments Covered: by Type Low purity High purity Ultra- high purity
by Supply Mode Cylinders Bulk and micro Bulk Drum tank On-site
by Application Semiconductor LCD Imaging and Lighting Others
by End Use Industry Aerospace and Aircraft Automotive and Transportation Equipment Electronics Healthcare Medical Field

Neon Gas Market by Region

North America (United States, Canada, Mexico) Europe (United Kingdom, France, Germany, Italy, Spain, Sweden, Russia, Rest of Europe) Asia Pacific (China, South Korea, Japan, India, Australia, Indonesia, Malaysia, Philippines, Thailand, Vietnam, Rest of Asia Pacific) Middle East and Africa (MEA) (South Africa, GCC, Nigeria, Rest of MEA) South America (Brazil, Argentina, Colombia, Chile, Rest of South America)

Neon Gas Market Key Players

1. Air Liquide (France) 2. Linde plc (Ireland/UK) 3. Air Products and Chemicals, Inc. (USA) 4. Messer Group GmbH (Germany) 5. Air Water Inc. (Japan) 6. Iceblick Ltd. (Ukraine) 7. Taiyo Nippon Sanso Corporation (Japan) 8. Praxair (USA, now part of Linde plc) 9. Showa Denko K.K. (Japan) 10. Iwatani Corporation (Japan) 11. Coregas Pty Ltd. (Australia, part of Wesfarmers) 12. Matheson Tri-Gas, Inc. (USA) 13. Proton Gases (India) 14. Universal Industrial Gases, Inc. (USA) 15. Ingas (Ukraine) 16. Cryoin Engineering Ltd. (Ukraine) 17. Gulf Cryo (Kuwait) 18. Hangzhou Hangyang Co., Ltd. (China) 19. Sichuan Tianhong Rare Gas (China) 20. Shanghai GenTech Gases Co., Ltd. (China) 21. Shenandoah Industrial Gases (USA) 22. PGNIG (Poland) 23. Dakota Gasification Company (USA) 24. Yingde Gases Group (China) 25. China National Offshore Oil Corporation (CNOOC) – Gas Division (China) 26. Baosteel Gases (China) 27. Buzwair Industrial Gases Factories (Qatar) 28. SIAD Group (Italy) 29. SOL Group (Italy) 30. Southern Gas Ltd. (India)

Frequently Asked Questions:

1] What segments are covered in the Global Neon Gas Market report? Ans. The segments covered in the Neon Gas Market report are based on Type ,Supply Mode ,Application ,End Use Industry and Region . 2] Which region is expected to hold the highest share in the Global Neon Gas Market? Ans. The Asia Pacific region is expected to hold the highest share in the Neon Gas Market. 3] What is the market size of the Global Neon Gas Market by 2030? Ans. The market size of the Neon Gas Market by 2032 is expected to reach US$ 532.07 Mn. 4] What is the forecast period for the Global Neon Gas Market? Ans. The forecast period for the Neon Gas Market is 2025-2032. 5] What was the market size of the Global Neon Gas Market in 2023? Ans. The market size of the Neon Gas Market in 2024 was valued at US$ 289.6 Mn.
1. Neon Gas Market Introduction 1.1. Study Assumption and Market Definition 1.2. Scope of the Study 1.3. Executive Summary 2. Global Neon Gas Market: Competitive Landscape 2.1. MMR Competition Matrix 2.2. Competitive Landscape 2.3. Key Players Benchmarking 2.3.1. Company Name 2.3.2. Business Segment 2.3.3. End-user Segment 2.3.4. Revenue (2024) 2.3.5. Company Locations 2.4. Leading Neon Gas Market Companies, by market capitalization 2.5. Market Structure 2.5.1. Market Leaders 2.5.2. Market Followers 2.5.3. Emerging Players 2.6. Mergers and Acquisitions Details 3. Neon Gas Market: Dynamics 3.1. Neon Gas Market Trends by Region 3.1.1. North America Neon Gas Market Trends 3.1.2. Europe Neon Gas Market Trends 3.1.3. Asia Pacific Neon Gas Market Trends 3.1.4. Middle East and Africa Neon Gas Market Trends 3.1.5. South America Neon Gas Market Trends 3.2. Neon Gas Market Dynamics by Region 3.2.1. North America 3.2.1.1. North America Neon Gas Market Drivers 3.2.1.2. North America Neon Gas Market Restraints 3.2.1.3. North America Neon Gas Market Opportunities 3.2.1.4. North America Neon Gas Market Challenges 3.2.2. Europe 3.2.2.1. Europe Neon Gas Market Drivers 3.2.2.2. Europe Neon Gas Market Restraints 3.2.2.3. Europe Neon Gas Market Opportunities 3.2.2.4. Europe Neon Gas Market Challenges 3.2.3. Asia Pacific 3.2.3.1. Asia Pacific Neon Gas Market Drivers 3.2.3.2. Asia Pacific Neon Gas Market Restraints 3.2.3.3. Asia Pacific Neon Gas Market Opportunities 3.2.3.4. Asia Pacific Neon Gas Market Challenges 3.2.4. Middle East and Africa 3.2.4.1. Middle East and Africa Neon Gas Market Drivers 3.2.4.2. Middle East and Africa Neon Gas Market Restraints 3.2.4.3. Middle East and Africa Neon Gas Market Opportunities 3.2.4.4. Middle East and Africa Neon Gas Market Challenges 3.2.5. South America 3.2.5.1. South America Neon Gas Market Drivers 3.2.5.2. South America Neon Gas Market Restraints 3.2.5.3. South America Neon Gas Market Opportunities 3.2.5.4. South America Neon Gas Market Challenges 3.3. PORTER’s Five Forces Analysis 3.4. PESTLE Analysis 3.5. Technology Roadmap 3.6. Regulatory Landscape by Region 3.6.1. North America 3.6.2. Europe 3.6.3. Asia Pacific 3.6.4. Middle East and Africa 3.6.5. South America 3.7. Key Opinion Leader Analysis For Neon Gas Industry 3.8. Analysis of Government Schemes and Initiatives For Neon Gas Industry 3.9. Neon Gas Market Trade Analysis 3.10. The Global Pandemic Impact on Neon Gas Market 4. Neon Gas Market: Global Market Size and Forecast by Segmentation by Demand and Supply Side (by Value in USD Million) 2024-2032 4.1. Neon Gas Market Size and Forecast, by Type (2024-2032) 4.1.1. Low purity 4.1.2. High purity 4.1.3. Ultra- high purity 4.2. Neon Gas Market Size and Forecast, by Supply Mode (2024-2032) 4.2.1. Cylinders 4.2.2. Bulk and micro Bulk 4.2.3. Drum tank 4.2.4. On-site 4.3. Neon Gas Market Size and Forecast, by Application (2024-2032) 4.3.1. Semiconductor 4.3.2. LCD 4.3.3. Imaging and Lighting 4.3.4. Others 4.4. Neon Gas Market Size and Forecast, by End Use Industry (2024-2032) 4.4.1. Aerospace and Aircraft 4.4.2. Automotive and Transportation Equipment 4.4.3. Electronics 4.4.4. Healthcare 4.4.5. Medical Field 4.5. Neon Gas Market Size and Forecast, by Region (2024-2032) 4.5.1. North America 4.5.2. Europe 4.5.3. Asia Pacific 4.5.4. Middle East and Africa 4.5.5. South America 5. North America Neon Gas Market Size and Forecast by Segmentation (by Value in USD Million) 2024-2032 5.1. North America Neon Gas Market Size and Forecast, by Type (2024-2032) 5.1.1. Low purity 5.1.2. High purity 5.1.3. Ultra- high purity 5.2. North America Neon Gas Market Size and Forecast, by Supply Mode (2024-2032) 5.2.1. Cylinders 5.2.2. Bulk and micro Bulk 5.2.3. Drum tank 5.2.4. On-site 5.3. North America Neon Gas Market Size and Forecast, by Application (2024-2032) 5.3.1. Semiconductor 5.3.2. LCD 5.3.3. Imaging and Lighting 5.3.4. Others 5.4. North America Neon Gas Market Size and Forecast, by End Use Industry (2024-2032) 5.4.1. Aerospace and Aircraft 5.4.2. Automotive and Transportation Equipment 5.4.3. Electronics 5.4.4. Healthcare 5.4.5. Medical Field 5.5. North America Neon Gas Market Size and Forecast, by Country (2024-2032) 5.5.1. United States 5.5.1.1. United States Neon Gas Market Size and Forecast, by Type (2024-2032) 5.5.1.1.1. Low purity 5.5.1.1.2. High purity 5.5.1.1.3. Ultra- high purity 5.5.1.2. United States Neon Gas Market Size and Forecast, by Supply Mode (2024-2032) 5.5.1.2.1. Cylinders 5.5.1.2.2. Bulk and micro Bulk 5.5.1.2.3. Drum tank 5.5.1.2.4. On-site 5.5.1.3. United States Neon Gas Market Size and Forecast, by Application (2024-2032) 5.5.1.3.1. Semiconductor 5.5.1.3.2. LCD 5.5.1.3.3. Imaging and Lighting 5.5.1.3.4. Others 5.5.1.4. United States Neon Gas Market Size and Forecast, by End Use Industry (2024-2032) 5.5.1.4.1. Aerospace and Aircraft 5.5.1.4.2. Automotive and Transportation Equipment 5.5.1.4.3. Electronics 5.5.1.4.4. Healthcare 5.5.1.4.5. Medical Field 5.5.2. Canada 5.5.2.1. Canada Neon Gas Market Size and Forecast, by Type (2024-2032) 5.5.2.1.1. Low purity 5.5.2.1.2. High purity 5.5.2.1.3. Ultra- high purity 5.5.2.2. Canada Neon Gas Market Size and Forecast, by Supply Mode (2024-2032) 5.5.2.2.1. Cylinders 5.5.2.2.2. Bulk and micro Bulk 5.5.2.2.3. Drum tank 5.5.2.2.4. On-site 5.5.2.3. Canada Neon Gas Market Size and Forecast, by Application (2024-2032) 5.5.2.3.1. Semiconductor 5.5.2.3.2. LCD 5.5.2.3.3. Imaging and Lighting 5.5.2.3.4. Others 5.5.2.4. Canada Neon Gas Market Size and Forecast, by End Use Industry (2024-2032) 5.5.2.4.1. Aerospace and Aircraft 5.5.2.4.2. Automotive and Transportation Equipment 5.5.2.4.3. Electronics 5.5.2.4.4. Healthcare 5.5.2.4.5. Medical Field 5.5.3. Mexico 5.5.3.1. Mexico Neon Gas Market Size and Forecast, by Type (2024-2032) 5.5.3.1.1. Low purity 5.5.3.1.2. High purity 5.5.3.1.3. Ultra- high purity 5.5.3.2. Mexico Neon Gas Market Size and Forecast, by Supply Mode (2024-2032) 5.5.3.2.1. Cylinders 5.5.3.2.2. Bulk and micro Bulk 5.5.3.2.3. Drum tank 5.5.3.2.4. On-site 5.5.3.3. Mexico Neon Gas Market Size and Forecast, by Application (2024-2032) 5.5.3.3.1. Semiconductor 5.5.3.3.2. LCD 5.5.3.3.3. Imaging and Lighting 5.5.3.3.4. Others 5.5.3.4. Mexico Neon Gas Market Size and Forecast, by End Use Industry (2024-2032) 5.5.3.4.1. Aerospace and Aircraft 5.5.3.4.2. Automotive and Transportation Equipment 5.5.3.4.3. Electronics 5.5.3.4.4. Healthcare 5.5.3.4.5. Medical Field 6. Europe Neon Gas Market Size and Forecast by Segmentation (by Value in USD Million) 2024-2032 6.1. Europe Neon Gas Market Size and Forecast, by Type (2024-2032) 6.2. Europe Neon Gas Market Size and Forecast, by Supply Mode (2024-2032) 6.3. Europe Neon Gas Market Size and Forecast, by Application (2024-2032) 6.4. Europe Neon Gas Market Size and Forecast, by End Use Industry (2024-2032) 6.5. Europe Neon Gas Market Size and Forecast, by Country (2024-2032) 6.5.1. United Kingdom 6.5.1.1. United Kingdom Neon Gas Market Size and Forecast, by Type (2024-2032) 6.5.1.2. United Kingdom Neon Gas Market Size and Forecast, by Supply Mode (2024-2032) 6.5.1.3. United Kingdom Neon Gas Market Size and Forecast, by Application (2024-2032) 6.5.1.4. United Kingdom Neon Gas Market Size and Forecast, by End Use Industry (2024-2032) 6.5.2. France 6.5.2.1. France Neon Gas Market Size and Forecast, by Type (2024-2032) 6.5.2.2. France Neon Gas Market Size and Forecast, by Supply Mode (2024-2032) 6.5.2.3. France Neon Gas Market Size and Forecast, by Application (2024-2032) 6.5.2.4. France Neon Gas Market Size and Forecast, by End Use Industry (2024-2032) 6.5.3. Germany 6.5.3.1. Germany Neon Gas Market Size and Forecast, by Type (2024-2032) 6.5.3.2. Germany Neon Gas Market Size and Forecast, by Supply Mode (2024-2032) 6.5.3.3. Germany Neon Gas Market Size and Forecast, by Application (2024-2032) 6.5.3.4. Germany Neon Gas Market Size and Forecast, by End Use Industry (2024-2032) 6.5.4. Italy 6.5.4.1. Italy Neon Gas Market Size and Forecast, by Type (2024-2032) 6.5.4.2. Italy Neon Gas Market Size and Forecast, by Supply Mode (2024-2032) 6.5.4.3. Italy Neon Gas Market Size and Forecast, by Application (2024-2032) 6.5.4.4. Italy Neon Gas Market Size and Forecast, by End Use Industry (2024-2032) 6.5.5. Spain 6.5.5.1. Spain Neon Gas Market Size and Forecast, by Type (2024-2032) 6.5.5.2. Spain Neon Gas Market Size and Forecast, by Supply Mode (2024-2032) 6.5.5.3. Spain Neon Gas Market Size and Forecast, by Application (2024-2032) 6.5.5.4. Spain Neon Gas Market Size and Forecast, by End Use Industry (2024-2032) 6.5.6. Sweden 6.5.6.1. Sweden Neon Gas Market Size and Forecast, by Type (2024-2032) 6.5.6.2. Sweden Neon Gas Market Size and Forecast, by Supply Mode (2024-2032) 6.5.6.3. Sweden Neon Gas Market Size and Forecast, by Application (2024-2032) 6.5.6.4. Sweden Neon Gas Market Size and Forecast, by End Use Industry (2024-2032) 6.5.7. Austria 6.5.7.1. Austria Neon Gas Market Size and Forecast, by Type (2024-2032) 6.5.7.2. Austria Neon Gas Market Size and Forecast, by Supply Mode (2024-2032) 6.5.7.3. Austria Neon Gas Market Size and Forecast, by Application (2024-2032) 6.5.7.4. Austria Neon Gas Market Size and Forecast, by End Use Industry (2024-2032) 6.5.8. Rest of Europe 6.5.8.1. Rest of Europe Neon Gas Market Size and Forecast, by Type (2024-2032) 6.5.8.2. Rest of Europe Neon Gas Market Size and Forecast, by Supply Mode (2024-2032) 6.5.8.3. Rest of Europe Neon Gas Market Size and Forecast, by Application (2024-2032) 6.5.8.4. Rest of Europe Neon Gas Market Size and Forecast, by End Use Industry (2024-2032) 7. Asia Pacific Neon Gas Market Size and Forecast by Segmentation (by Value in USD Million) 2024-2032 7.1. Asia Pacific Neon Gas Market Size and Forecast, by Type (2024-2032) 7.2. Asia Pacific Neon Gas Market Size and Forecast, by Supply Mode (2024-2032) 7.3. Asia Pacific Neon Gas Market Size and Forecast, by Application (2024-2032) 7.4. Asia Pacific Neon Gas Market Size and Forecast, by End Use Industry (2024-2032) 7.5. Asia Pacific Neon Gas Market Size and Forecast, by Country (2024-2032) 7.5.1. China 7.5.1.1. China Neon Gas Market Size and Forecast, by Type (2024-2032) 7.5.1.2. China Neon Gas Market Size and Forecast, by Supply Mode (2024-2032) 7.5.1.3. China Neon Gas Market Size and Forecast, by Application (2024-2032) 7.5.1.4. China Neon Gas Market Size and Forecast, by End Use Industry (2024-2032) 7.5.2. S Korea 7.5.2.1. S Korea Neon Gas Market Size and Forecast, by Type (2024-2032) 7.5.2.2. S Korea Neon Gas Market Size and Forecast, by Supply Mode (2024-2032) 7.5.2.3. S Korea Neon Gas Market Size and Forecast, by Application (2024-2032) 7.5.2.4. S Korea Neon Gas Market Size and Forecast, by End Use Industry (2024-2032) 7.5.3. Japan 7.5.3.1. Japan Neon Gas Market Size and Forecast, by Type (2024-2032) 7.5.3.2. Japan Neon Gas Market Size and Forecast, by Supply Mode (2024-2032) 7.5.3.3. Japan Neon Gas Market Size and Forecast, by Application (2024-2032) 7.5.3.4. Japan Neon Gas Market Size and Forecast, by End Use Industry (2024-2032) 7.5.4. India 7.5.4.1. India Neon Gas Market Size and Forecast, by Type (2024-2032) 7.5.4.2. India Neon Gas Market Size and Forecast, by Supply Mode (2024-2032) 7.5.4.3. India Neon Gas Market Size and Forecast, by Application (2024-2032) 7.5.4.4. India Neon Gas Market Size and Forecast, by End Use Industry (2024-2032) 7.5.5. Australia 7.5.5.1. Australia Neon Gas Market Size and Forecast, by Type (2024-2032) 7.5.5.2. Australia Neon Gas Market Size and Forecast, by Supply Mode (2024-2032) 7.5.5.3. Australia Neon Gas Market Size and Forecast, by Application (2024-2032) 7.5.5.4. Australia Neon Gas Market Size and Forecast, by End Use Industry (2024-2032) 7.5.6. Indonesia 7.5.6.1. Indonesia Neon Gas Market Size and Forecast, by Type (2024-2032) 7.5.6.2. Indonesia Neon Gas Market Size and Forecast, by Supply Mode (2024-2032) 7.5.6.3. Indonesia Neon Gas Market Size and Forecast, by Application (2024-2032) 7.5.6.4. Indonesia Neon Gas Market Size and Forecast, by End Use Industry (2024-2032) 7.5.7. Malaysia 7.5.7.1. Malaysia Neon Gas Market Size and Forecast, by Type (2024-2032) 7.5.7.2. Malaysia Neon Gas Market Size and Forecast, by Supply Mode (2024-2032) 7.5.7.3. Malaysia Neon Gas Market Size and Forecast, by Application (2024-2032) 7.5.7.4. Malaysia Neon Gas Market Size and Forecast, by End Use Industry (2024-2032) 7.5.8. Vietnam 7.5.8.1. Vietnam Neon Gas Market Size and Forecast, by Type (2024-2032) 7.5.8.2. Vietnam Neon Gas Market Size and Forecast, by Supply Mode (2024-2032) 7.5.8.3. Vietnam Neon Gas Market Size and Forecast, by Application (2024-2032) 7.5.8.4. Vietnam Neon Gas Market Size and Forecast, by End Use Industry (2024-2032) 7.5.9. Taiwan 7.5.9.1. Taiwan Neon Gas Market Size and Forecast, by Type (2024-2032) 7.5.9.2. Taiwan Neon Gas Market Size and Forecast, by Supply Mode (2024-2032) 7.5.9.3. Taiwan Neon Gas Market Size and Forecast, by Application (2024-2032) 7.5.9.4. Taiwan Neon Gas Market Size and Forecast, by End Use Industry (2024-2032) 7.5.10. Rest of Asia Pacific 7.5.10.1. Rest of Asia Pacific Neon Gas Market Size and Forecast, by Type (2024-2032) 7.5.10.2. Rest of Asia Pacific Neon Gas Market Size and Forecast, by Supply Mode (2024-2032) 7.5.10.3. Rest of Asia Pacific Neon Gas Market Size and Forecast, by Application (2024-2032) 7.5.10.4. Rest of Asia Pacific Neon Gas Market Size and Forecast, by End Use Industry (2024-2032) 8. Middle East and Africa Neon Gas Market Size and Forecast by Segmentation (by Value in USD Million) 2024-2032 8.1. Middle East and Africa Neon Gas Market Size and Forecast, by Type (2024-2032) 8.2. Middle East and Africa Neon Gas Market Size and Forecast, by Supply Mode (2024-2032) 8.3. Middle East and Africa Neon Gas Market Size and Forecast, by Application (2024-2032) 8.4. Middle East and Africa Neon Gas Market Size and Forecast, by End Use Industry (2024-2032) 8.5. Middle East and Africa Neon Gas Market Size and Forecast, by Country (2024-2032) 8.5.1. South Africa 8.5.1.1. South Africa Neon Gas Market Size and Forecast, by Type (2024-2032) 8.5.1.2. South Africa Neon Gas Market Size and Forecast, by Supply Mode (2024-2032) 8.5.1.3. South Africa Neon Gas Market Size and Forecast, by Application (2024-2032) 8.5.1.4. South Africa Neon Gas Market Size and Forecast, by End Use Industry (2024-2032) 8.5.2. GCC 8.5.2.1. GCC Neon Gas Market Size and Forecast, by Type (2024-2032) 8.5.2.2. GCC Neon Gas Market Size and Forecast, by Supply Mode (2024-2032) 8.5.2.3. GCC Neon Gas Market Size and Forecast, by Application (2024-2032) 8.5.2.4. GCC Neon Gas Market Size and Forecast, by End Use Industry (2024-2032) 8.5.3. Nigeria 8.5.3.1. Nigeria Neon Gas Market Size and Forecast, by Type (2024-2032) 8.5.3.2. Nigeria Neon Gas Market Size and Forecast, by Supply Mode (2024-2032) 8.5.3.3. Nigeria Neon Gas Market Size and Forecast, by Application (2024-2032) 8.5.3.4. Nigeria Neon Gas Market Size and Forecast, by End Use Industry (2024-2032) 8.5.4. Rest of ME&A 8.5.4.1. Rest of ME&A Neon Gas Market Size and Forecast, by Type (2024-2032) 8.5.4.2. Rest of ME&A Neon Gas Market Size and Forecast, by Supply Mode (2024-2032) 8.5.4.3. Rest of ME&A Neon Gas Market Size and Forecast, by Application (2024-2032) 8.5.4.4. Rest of ME&A Neon Gas Market Size and Forecast, by End Use Industry (2024-2032) 9. South America Neon Gas Market Size and Forecast by Segmentation (by Value in USD Million) 2024-2032 9.1. South America Neon Gas Market Size and Forecast, by Type (2024-2032) 9.2. South America Neon Gas Market Size and Forecast, by Supply Mode (2024-2032) 9.3. South America Neon Gas Market Size and Forecast, by Application(2024-2032) 9.4. South America Neon Gas Market Size and Forecast, by End Use Industry (2024-2032) 9.5. South America Neon Gas Market Size and Forecast, by Country (2024-2032) 9.5.1. Brazil 9.5.1.1. Brazil Neon Gas Market Size and Forecast, by Type (2024-2032) 9.5.1.2. Brazil Neon Gas Market Size and Forecast, by Supply Mode (2024-2032) 9.5.1.3. Brazil Neon Gas Market Size and Forecast, by Application (2024-2032) 9.5.1.4. Brazil Neon Gas Market Size and Forecast, by End Use Industry (2024-2032) 9.5.2. Argentina 9.5.2.1. Argentina Neon Gas Market Size and Forecast, by Type (2024-2032) 9.5.2.2. Argentina Neon Gas Market Size and Forecast, by Supply Mode (2024-2032) 9.5.2.3. Argentina Neon Gas Market Size and Forecast, by Application (2024-2032) 9.5.2.4. Argentina Neon Gas Market Size and Forecast, by End Use Industry (2024-2032) 9.5.3. Rest Of South America 9.5.3.1. Rest Of South America Neon Gas Market Size and Forecast, by Type (2024-2032) 9.5.3.2. Rest Of South America Neon Gas Market Size and Forecast, by Supply Mode (2024-2032) 9.5.3.3. Rest Of South America Neon Gas Market Size and Forecast, by Application (2024-2032) 9.5.3.4. Rest Of South America Neon Gas Market Size and Forecast, by End Use Industry (2024-2032) 10. Company Profile: Key Players 10.1. Air Liquide (France) 10.1.1. Company Overview 10.1.2. Business Portfolio 10.1.3. Financial Overview 10.1.4. SWOT Analysis 10.1.5. Strategic Analysis 10.1.6. Scale of Operation (small, medium, and large) 10.1.7. Details on Partnership 10.1.8. Regulatory Accreditations and Certifications Received by Them 10.1.9. Awards Received by the Firm 10.1.10. Recent Developments 10.2. Linde plc (Ireland/UK) 10.3. Air Products and Chemicals, Inc. (USA) 10.4. Messer Group GmbH (Germany) 10.5. Air Water Inc. (Japan) 10.6. Iceblick Ltd. (Ukraine) 10.7. Taiyo Nippon Sanso Corporation (Japan) 10.8. Praxair (USA, now part of Linde plc) 10.9. Showa Denko K.K. (Japan) 10.10. Iwatani Corporation (Japan) 10.11. Coregas Pty Ltd. (Australia, part of Wesfarmers) 10.12. Matheson Tri-Gas, Inc. (USA) 10.13. Proton Gases (India) 10.14. Universal Industrial Gases, Inc. (USA) 10.15. Ingas (Ukraine) 10.16. Cryoin Engineering Ltd. (Ukraine) 10.17. Gulf Cryo (Kuwait) 10.18. Hangzhou Hangyang Co., Ltd. (China) 10.19. Sichuan Tianhong Rare Gas (China) 10.20. Shanghai GenTech Gases Co., Ltd. (China) 10.21. Shenandoah Industrial Gases (USA) 10.22. PGNIG (Poland) 10.23. Dakota Gasification Company (USA) 10.24. Yingde Gases Group (China) 10.25. China National Offshore Oil Corporation (CNOOC) – Gas Division (China) 10.26. Baosteel Gases (China) 10.27. Buzwair Industrial Gases Factories (Qatar) 10.28. SIAD Group (Italy) 10.29. SOL Group (Italy) 10.30. Southern Gas Ltd. (India) 11. Key Findings 12. Industry Recommendations 13. Neon Gas Market: Research Methodology 14. Terms and Glossary
  • INQUIRE BEFORE BUYING
MMRLogo
America's Fastest Growing Market Research Firm