The Hotels Market size was valued at USD 1071.49 Billion in 2024 and the total Hotels revenue is expected to grow at a CAGR of 9.2% from 2025 to 2032, reaching nearly USD 2166.55 Billion.Hotels Market Executive Summary
The hotel business is entering its most consequential cycle in decades. Between 2025 and 2032, the industry’s value will be defined less by inventory and more by understanding—how precisely a brand can recognize a guest, anticipate needs, and price experiences in real time. Occupancy and ADR still matter—but loyalty economics, distribution control, and experience design now decide margin. India, Southeast Asia, and the Gulf are scaling demand engines; the U.S. and Europe are pivoting to conversion-led growth and asset-light expansion. Meanwhile, wellness and spiritual travel are becoming structural demand pillars rather than fads. Winners will look like tech companies with beds: cloud-native ops, AI-driven revenue labs, and zero-leakage distribution. Losers will overpay for keys and underinvest in guest data. Why this RD matters: it gives you a complete playbook—from RevPAR drivers and cost structure to licensing, pipeline strategy, risk, and financial modeling—so your brand can grow faster with tighter control of unit economics and a clear route to premium multiples.Hotels Market Objective & Scope
This RD arms developers, operators, investors, and policy makers with decision-ready insight for 2025–2032. It covers global and India with attention to metro vs Tier-2, chain vs independent, business vs leisure, OTA vs direct vs B2B, and ownership formats (managed, franchised, leased, owner-operator). You get historical context (2021–2024), modeled forecasts, CapEx/Opex benchmarks per key, pricing and booking-mix intelligence, regulatory pathways, technology roadmaps, competitive positioning, SWOT + risk mitigation, methodology, and assumptions—all written as flowing analysis with bolded takeaways (no sterile boilerplate).Hotels Market Definition & Segment Analysis
Hotels are no longer just shelters with rate fences; they’re multi-format experience platforms. The market spans budget and midscale (efficiency, location, reliability), upper-mid and upscale (service depth, F&B, meetings), and luxury (identity, design, discretion). Chain affiliation brings rate integrity, loyalty, and financing benefits; independents trade on neighborhood authenticity and owner agility. Demand splits across business, “bleisure”, leisure/resort, MICE, wellness, spiritual/heritage, and extended stay. Distribution is the battlefield: OTAs for reach, direct for lifetime value, B2B/TMCs for a predictable base.Global Hotel Market Size
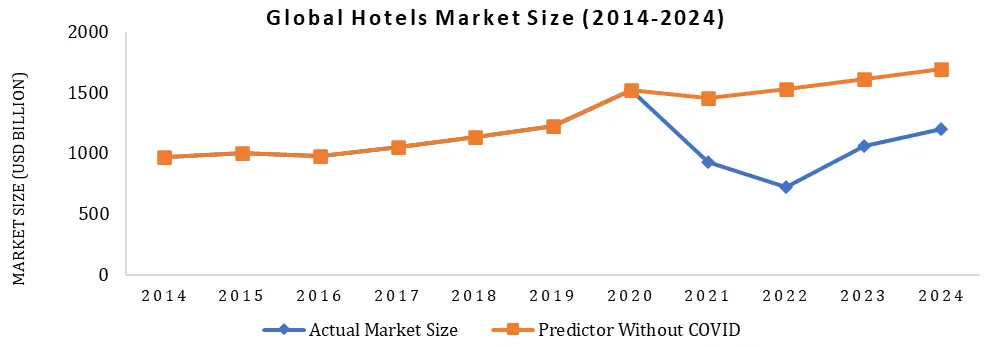
To know about the Research Methodology :- Request Free Sample ReportMarket Dynamics & Growth Drivers
The next leg of growth is powered by five structural forces. First, bleisure: corporate trips stretch into weekends, so weekend ADR strength and length-of-stay (LOS) rise. Second, personalization becomes table stakes—brands that stitch loyalty, CRM/CDP, and pricing win both rate and retention; anonymous guests equal margin leakage. Third, wellness and spiritual tourism harden into year-round demand, lifting shoulder months and stabilizing cash flows. Fourth, asset-light expansion scales faster at lower capital intensity; conversion and soft-brand plays monetize existing buildings with brand and system strength. Fifth, ESG discipline is now revenue-positive: certified green hotels win RFPs, command rate premiums, and cheapen energy cost via smart systems.Market Challenges
Headwinds are real—and predictable. Fixed-cost weight is unforgiving: manpower, utilities, and maintenance compress EBITDA when occupancy dips. OTA commission “tax” of 12–20% erodes contribution when direct engines are weak. Talent churn—especially in housekeeping and F&B—forces wage inflation and service inconsistency. Licensing drag slows new supply (fire NOCs, FSSAI, local clearances, CRZ in coastal zones), pushing pre-opening costs higher. Rate parity battles and excessive discounting train guests away from direct. Climate volatility and macro shocks whiplash demand unless portfolios are geographically and segment-diversified.![]()
Hotels Market Scope: Inquire before buying
Hotels Market Report Coverage Details Base Year: 2024 Forecast Period: 2025-2032 Historical Data: 2019 to 2024 Market Size in 2024: USD 1071.49 Bn. Forecast Period 2025 to 2032 CAGR: 9.2% Market Size in 2032: USD 2166.55 Bn. Segments Covered: by Hotel Type Business/ Commercial Hotels Boutique Hotels Resort Hotels Casino Hotels Transit Hotels Bed & Breakfast Hotels Others by Price Level Luxury Upscale Midscale Economy by Room Capacity Small Medium Large Mega by Business Model Individual Chain Regional & Segment Intelligence (Global + India)
India is the most exciting multi-segment canvas: metros drive ADR and corporate base, while Tier-2/Tier-3 cities and spiritual corridors (Ayodhya, Varanasi, Haridwar, Rishikesh) inject secular growth through events, pilgrimage, education, and medical travel. Leisure hills and coastal belts remain supply-constrained due to land and environmental approvals—a pricing opportunity for branded, compliant assets.
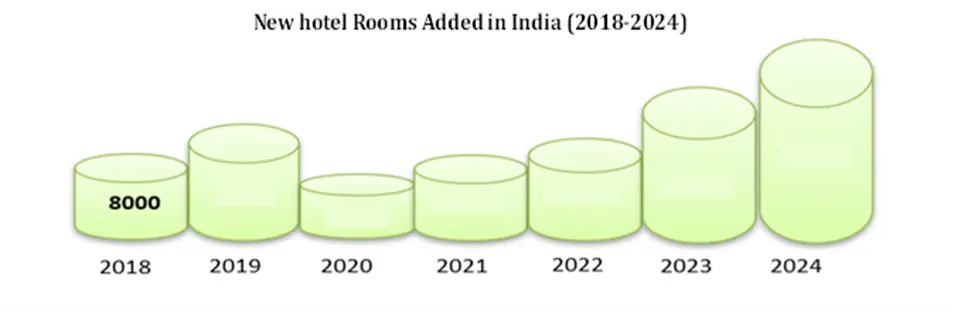
Globally, APAC continues to outgrow other regions on volume and new wealth, GCC invests in giga-destinations (improving year-round seasonality), and the U.S. and Europe are in a conversion cycle—flag swaps and soft brands unlocking rate via loyalty platforms, without new ground-up CapEx. Extended stay and select-service out-earn full-service peers on flow-through and stability.
![]()
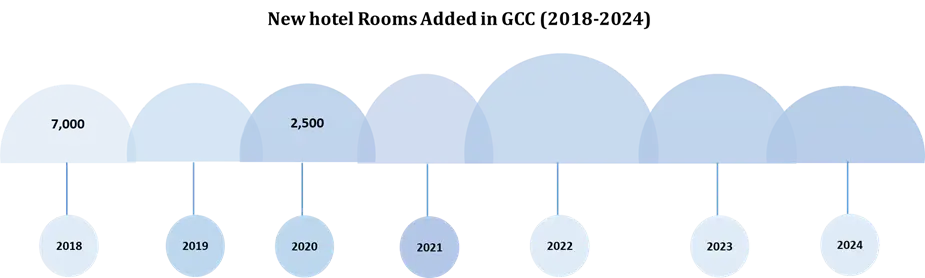
RevPAR, ADR, Occupancy: What Really Moves the P&L
The story executives need is simple: ADR is the lever; occupancy is the cushion; mix is the multiplier. Post-pandemic, global occupancy re-normalized in the low-60s with ADR stepping higher due to mix upgrades (more leisure, more suites, more experiential pricing). As corporate and MICE fill back in, expect weekday rates to firm, with weekend premiums held by leisure. India’s spiritual/leisure nodes smooth seasonality and extend LOS, while metro weekday strength protects base. Where revenue labs run real-time price fences (length-of-stay, mobile-only, loyalty-tiered), we see superior RevPAR uplift without self-cannibalization.Cost Structure (CapEx/Opex per Key)
Build and run for unit economics—not vanity. Indicative CapEx per key trends around USD xx–xxk (budget), USD xx–xxk (midscale), and USD xx–xxk+ (luxury) depending on land, brand standards, and fit-out. Opex stacks with manpower XX%, utilities/maintenance xx–xx%, OTA commission xx%, and F&B xx% (with banquet-led hotels achieving outsize GOP during event cycles). Smart energy systems (heat pumps, BMS, sensors) pay back sub-36 months in high-tariff cities. Renovation cadence (soft goods 5–7 years, case goods 10–12) must be funded through FF&E reserves—under-fund and you will lose ADR power.Pricing & Booking-Channel Mix
Distribution is strategy, not a toggle. OTAs deliver reach, but direct delivers lifetime value. Loyalty-driven direct share rises when brands bundle rate + early check-in + F&B credit and reward app-only behavior. Corporate/B2B returns as procurement seeks duty-of-care + ESG. Metasearch is the new battleground—own your brand bid or pay the leakage tax. Invest in rate-integrity tools; deploy mobile-only fences, geo-targeting, and length-of-stay ladders to lift ADR without billboard effect.
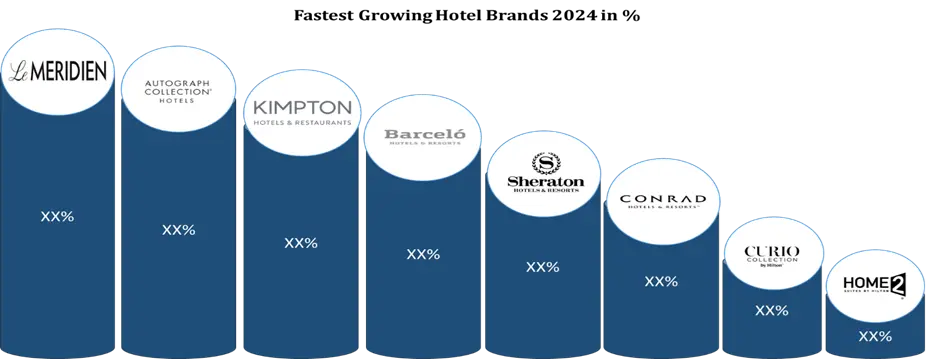
The % shown in the image represents the year-on-year brand value growth rate of each hotel brand in 2023
Entry Barriers & Regulatory Landscape (India focus, globally relevant)
Expect 8–12 approvals for a compliant opening in India: fire, police, trade license, FSSAI, pollution control/environment, sometimes heritage/coastal clearances. Liquor licensing and signage guidelines vary by state and municipality. Building codes and life-safety require early alignment to avoid rework. Globally, accessibility, ESG reporting, and labor laws shape timelines and opex; GCC provides incentives but needs local-partner fluency. Regulatory mastery is a moat—build it once, monetize for years.Business Strategy & Expansion Roadmap
Phase 1: Speed to market with asset-light conversions and select-service builds in Tier-2 growth corridors (corporate satellites, medical/education hubs, pilgrimage belts). Phase 2: Cluster strategy—one hub full-service + three to five spokes (select-service/extended stay) sharing sales, procurement, and HR; funnel everything into a central revenue lab. Phase 3: Experience moat—codify a loyalty-first, mobile-native journey (pre-stay offers, in-stay personalization, post-stay reactivation), then scale via franchising with non-negotiable brand standards and owner education on revenue and capex discipline.Pipeline Analysis (What to Build, What to Convert)
The cheapest key is the one you convert. Globally and in India, conversion/soft-brand pipelines are swelling: owners want system revenue and ADR lift without the time and risk of ground-up. Pilgrimage and wellness clusters are under-branded; select-service with strong housekeeping and breakfast CX outperforms on flow-through. Mixed-use (co-working + retail + F&B streets) around hotels thickens demand and diversifies NOI.Financial Modeling & Sensitivity (What your CFO really needs)
Underwrite on stabilized RevPAR and flow-through, not just pro-forma occupancy. Break-even occupancy for midscale typically sits in the mid-50s, but pricing power and distribution mandcontrol decide how fast you get there. +10% ADR often yields +XX% RevPAR when fences hold, while –XX% occupancy can compress margins XX% if fixed cost is undisciplined. Interest-rate and currency sensitivity matter for cross-border debt and FF&E imports; hedge where exposure is real. Pre-opening costs and ramp curves (12–24 months) must be in the model—rosy curves kill equity.Technology & Innovation (From PMS to Profit OS)
Tomorrow’s leaders run cloud PMS + RMS + channel manager + CDP/CRM as a single nervous system. AI concierges lift satisfaction and upsell; digital keys reduce friction; smart housekeeping cuts idle time and energy. First-party data powers next-stay offers and ancillary attach (spa, dining, transport). In luxury, biometric access, digital-twin guest profiles, and in-room sustainability dashboards drive both rate and reputation. Tech without adoption is capex waste—tie every feature to RevPAR, GOPPAR, or NPS.Hotels Market Competitive Intelligence (How the brands actually win)
IHCL (Taj) is leaning into India’s spiritual and heritage circuits while sharpening luxury wellness; Marriott compounds with Bonvoy flywheel and conversion-friendly playbooks; Hilton and Hyatt double down on select-service and extended-stay for predictable flow-through; Accor scales lifestyle/experiential with strong ESG narrative; ITC weaponizes responsible luxury with LEED leadership; Radisson/IHG dominate owner-friendly mid-upscale; Lemon Tree and Sarovar own value-centric urban. OYO/Fab keep the budget/long-tail aggregated and price-transparent. Translation: brand systems that protect ADR and fill base demand will keep taking share; badge-only plays will be squeezed.SWOT & Risk Mitigation (Truth on one page)
Strengths: hospitality demand is multipolar and multi-seasonal; loyalty ecosystems and ESG credentials command corporate preference. Weaknesses: fixed-cost drag, OTA leakage, and talent churn. Opportunities: Tier-2 growth corridors, spiritual/wellness permanence, conversion-led pipelines, ancillary monetization. Threats: macro shocks, extreme weather, rate wars, regulatory stalls. Mitigate with intent: balanced portfolios, owner CAPEX education, direct-first marketing, energy savings that drop to EBITDA, multi-source staffing, scenario-tested revenue plans. If it’s not measured, it won’t move—tie every mitigation to KPIs and incentives.Strategic Recommendations (Do this next)
Own Tier-2 and spiritual nodes now while land is still rational. Go asset-light where speed and scale beat control; own flagship assets where brand theater drives pricing power. Build a central revenue lab and treat distribution as a P&L. Design for loyalty, not just for OTA conversion: mobile-only rates, instant benefits, and human service recovery. Make ESG a revenue center, not a report—audit utilities, monetize green in RFPs, tell the story. Codify brand standards and train owners to protect ADR. Finally, fund the renovation cycle—because shiny rooms sell, tired rooms discount.Methodology & Frameworks (Why you can trust the view)
This RD blends primary conversations with owners, operators, and distribution partners; secondary sources (industry databases/brand filings); and bottom-up market builds for key nodes. We apply PESTEL for macro, Porter’s for structure, and SVOR to prioritize Supply-Demand-Value-Opportunity-Risk. Forecasts are scenario-tested (demand and price bands) and cross-checked to unit economics (CapEx/Opex, flow-through, renovation).Glossary & Assumptions (So teams speak one language)
ADR (Average Daily Rate), RevPAR (Revenue per Available Room), GOPPAR (Gross Operating Profit per Available Room), LOS (Length of Stay), PMS (Property Management System), RMS (Revenue Management System), CDP/CRM (Customer Data Platform/Relationship Management), OTA (Online Travel Agency), TMC (Travel Management Company), MICE (Meetings, Incentives, Conferences, Exhibitions), FF&E (Furniture, Fixtures & Equipment). Assumptions: base year 2024, USD currency, inflation-adjusted modeling, and scenario bands for demand/pricing; where explicit datasets are absent, figures are indicative ranges judged against market norms.Why Buy This Report (The executive promise)
Because it speaks the language of owners and operators, not just analysts. You get clear levers to grow RevPAR, discipline to protect EBITDA, a route to lower CAC via direct, and a credible plan to finance, staff, and scale.![]()
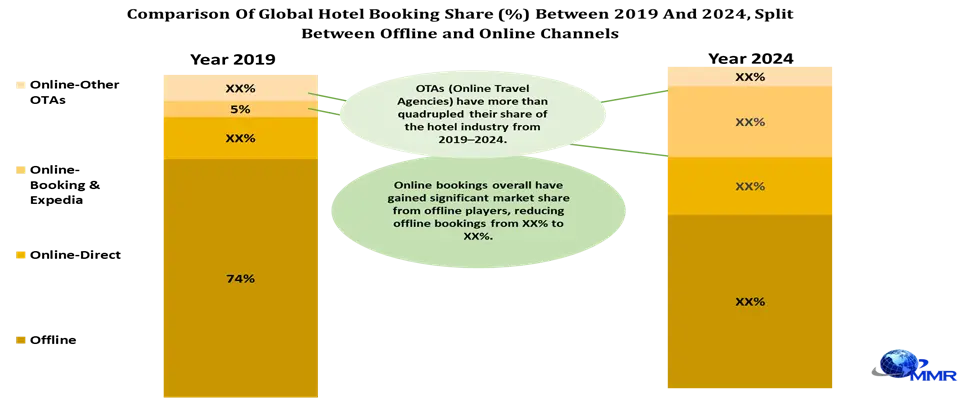
Hotels Market Regional Scope
North America (United States, Canada, and Mexico) Europe (UK, France, Germany, Italy, Spain, Sweden, Austria, and the Rest of Europe) Asia Pacific (China, South Korea, Japan, India, Australia, ASEAN, Indonesia, Philippines, Malaysia, Vietnam, Thailand, ASEAN, Rest of Asia Pacific) Middle East & Africa (South Africa, GCC, Nigeria, Rest of ME&A) South America (Brazil, Argentina, Rest of South America)Hotels Market, Key Players are:
1. Accor SA / Accor 2. Marriott International 3. Hyatt Hotels Corporation 4. Hilton Worldwide Holdings Inc. 5. InterContinental Hotels Group PLC (IHG) 6. Best Western International, Inc. 7. Choice Hotels International, Inc. 8. Wyndham Destinations, Inc. 9. Radisson Hospitality A.B. / Radisson Hotel Group 10. Indian Hotels Company Limited / Taj Hotels 11. Oravel Stays Private Limited 12. TC Limited 13. EIH Limited / Oberoi Hotels & Resorts 14. Bharat Hotels Limited / ITC Hotels 15. Lemon Tree Hotels 16. The Leela Palaces 17. Four Seasons Hotels and Resorts 18. Huazhu Hotels Group 19. Ryman Hotel Properties 20. GF Hotels & Resorts 21. HOTEL THE MITSUI KYOTO 22. The Hoxton 23. The Muraka at Conrad Maldives Rangali Island 24. Motel One 25. Eccleston Square 26. W Singapore Sentosa Cove 27. YOTEL Singapore Orchard Road Hotel 28. Hotel Clark Budapest 29. Hotel Chinzanso Tokyo
1. Hotels Market Introduction 1.1. Study Assumption and Market Definition 1.2. Scope of the Study 1.3. Executive Summary 2. Hotels Market: Dynamics 2.1. Hotels Market Trends by Region 2.1.1. North America Hotels Market Trends 2.1.2. Europe Hotels Market Trends 2.1.3. Asia Pacific Hotels Market Trends 2.1.4. Middle East and Africa Hotels Market Trends 2.1.5. South America Hotels Market Trends 2.2. Hotels Market Dynamics by Region 2.2.1. North America 2.2.1.1. North America Hotels Market Drivers 2.2.1.2. North America Hotels Market Restraints 2.2.1.3. North America Hotels Market Opportunities 2.2.1.4. North America Hotels Market Challenges 2.2.2. Europe 2.2.2.1. Europe Hotels Market Drivers 2.2.2.2. Europe Hotels Market Restraints 2.2.2.3. Europe Hotels Market Opportunities 2.2.2.4. Europe Hotels Market Challenges 2.2.3. Asia Pacific 2.2.3.1. Asia Pacific Hotels Market Drivers 2.2.3.2. Asia Pacific Hotels Market Restraints 2.2.3.3. Asia Pacific Hotels Market Opportunities 2.2.3.4. Asia Pacific Hotels Market Challenges 2.2.4. Middle East and Africa 2.2.4.1. Middle East and Africa Hotels Market Drivers 2.2.4.2. Middle East and Africa Hotels Market Restraints 2.2.4.3. Middle East and Africa Hotels Market Opportunities 2.2.4.4. Middle East and Africa Hotels Market Challenges 2.2.5. South America 2.2.5.1. South America Hotels Market Drivers 2.2.5.2. South America Hotels Market Restraints 2.2.5.3. South America Hotels Market Opportunities 2.2.5.4. South America Hotels Market Challenges 2.3. PORTER’s Five Forces Analysis 2.4. PESTLE Analysis 2.5. Technology Roadmap 2.6. Regulatory Landscape by Region 2.6.1. North America 2.6.2. Europe 2.6.3. Asia Pacific 2.6.4. Middle East and Africa 2.6.5. South America 2.7. Key Opinion Leader Analysis For Hotels Industry 2.8. Analysis of Government Schemes and Initiatives For Hotels Industry 2.9. Hotels Market price trend Analysis (2021-22) 2.10. Hotels Market Trade Analysis 2.10.1. Global Import Analysis 2.10.1.1. Top Importer of Hotels 2.10.2. Global Export Analysis 2.10.2.1. Top Exporter of Hotels 2.11. Hotels Production Analysis 2.12. The Global Pandemic Impact on Hotels Market 3. Hotels Market: Global Market Size and Forecast by Segmentation by Demand and Supply Side (by Value and Volume) 2024-2032 3.1. Hotels Market Size and Forecast, by Hotel Type (2024-2032) 3.1.1. Business/ Commercial Hotels 3.1.2. Boutique Hotels 3.1.3. Resort Hotels 3.1.4. Casino Hotels 3.1.5. Transit Hotels 3.1.6. Bed & Breakfast Hotels 3.1.7. Others 3.2. Hotels Market Size and Forecast, by Price Level (2024-2032) 3.2.1. Luxury 3.2.2. Upscale 3.2.3. Midscale 3.2.4. Economy 3.3. Hotels Market Size and Forecast, by Room Capacity (2024-2032) 3.3.1. Small 3.3.2. Medium 3.3.3. Large 3.3.4. Mega 3.4. Hotels Market Size and Forecast, by Business Model (2024-2032) 3.4.1. Individual 3.4.2. Chain 3.5. Hotels Market Size and Forecast, by Region (2024-2032) 3.5.1. North America 3.5.2. Europe 3.5.3. Asia Pacific 3.5.4. Middle East and Africa 3.5.5. South America 4. North America Hotels Market Size and Forecast by Segmentation (by Value and Volume) 2024-2032 4.1. North America Hotels Market Size and Forecast, by Hotel Type (2024-2032) 4.1.1. Business/ Commercial Hotels 4.1.2. Boutique Hotels 4.1.3. Resort Hotels 4.1.4. Casino Hotels 4.1.5. Transit Hotels 4.1.6. Bed & Breakfast Hotels 4.1.7. Others 4.2. North America Hotels Market Size and Forecast, by Price Level (2024-2032) 4.2.1. Luxury 4.2.2. Upscale 4.2.3. Midscale 4.2.4. Economy 4.3. North America Hotels Market Size and Forecast, by Room Capacity (2024-2032) 4.3.1. Small 4.3.2. Medium 4.3.3. Large 4.3.4. Mega 4.4. North America Hotels Market Size and Forecast, by Business Model (2024-2032) 4.4.1. Individual 4.4.2. Chain 4.5. North America Hotels Market Size and Forecast, by Country (2024-2032) 4.5.1. United States 4.5.1.1. United States Hotels Market Size and Forecast, by Hotel Type (2024-2032) 4.5.1.1.1. Business/ Commercial Hotels 4.5.1.1.2. Boutique Hotels 4.5.1.1.3. Resort Hotels 4.5.1.1.4. Casino Hotels 4.5.1.1.5. Transit Hotels 4.5.1.1.6. Bed & Breakfast Hotels 4.5.1.1.7. Others 4.5.1.2. United States Hotels Market Size and Forecast, by Price Level (2024-2032) 4.5.1.2.1. Luxury 4.5.1.2.2. Upscale 4.5.1.2.3. Midscale 4.5.1.2.4. Economy 4.5.1.3. United States Hotels Market Size and Forecast, by Room Capacity (2024-2032) 4.5.1.3.1. Small 4.5.1.3.2. Medium 4.5.1.3.3. Large 4.5.1.3.4. Mega 4.5.1.4. United States Hotels Market Size and Forecast, by Business Model (2024-2032) 4.5.1.4.1. Individual 4.5.1.4.2. Chain 4.5.2. Canada 4.5.2.1. Canada Hotels Market Size and Forecast, by Hotel Type (2024-2032) 4.5.2.1.1. Business/ Commercial Hotels 4.5.2.1.2. Boutique Hotels 4.5.2.1.3. Resort Hotels 4.5.2.1.4. Casino Hotels 4.5.2.1.5. Transit Hotels 4.5.2.1.6. Bed & Breakfast Hotels 4.5.2.1.7. Others 4.5.2.2. Canada Hotels Market Size and Forecast, by Price Level (2024-2032) 4.5.2.2.1. Luxury 4.5.2.2.2. Upscale 4.5.2.2.3. Midscale 4.5.2.2.4. Economy 4.5.2.3. Canada Hotels Market Size and Forecast, by Room Capacity (2024-2032) 4.5.2.3.1. Small 4.5.2.3.2. Medium 4.5.2.3.3. Large 4.5.2.3.4. Mega 4.5.2.4. Canada Hotels Market Size and Forecast, by Business Model (2024-2032) 4.5.2.4.1. Individual 4.5.2.4.2. Chain 4.5.3. Mexico 4.5.3.1. Mexico Hotels Market Size and Forecast, by Hotel Type (2024-2032) 4.5.3.1.1. Business/ Commercial Hotels 4.5.3.1.2. Boutique Hotels 4.5.3.1.3. Resort Hotels 4.5.3.1.4. Casino Hotels 4.5.3.1.5. Transit Hotels 4.5.3.1.6. Bed & Breakfast Hotels 4.5.3.1.7. Others 4.5.3.2. Mexico Hotels Market Size and Forecast, by Price Level (2024-2032) 4.5.3.2.1. Luxury 4.5.3.2.2. Upscale 4.5.3.2.3. Midscale 4.5.3.2.4. Economy 4.5.3.3. Mexico Hotels Market Size and Forecast, by Room Capacity (2024-2032) 4.5.3.3.1. Small 4.5.3.3.2. Medium 4.5.3.3.3. Large 4.5.3.3.4. Mega 4.5.3.4. Mexico Hotels Market Size and Forecast, by Business Model (2024-2032) 4.5.3.4.1. Individual 4.5.3.4.2. Chain 5. Europe Hotels Market Size and Forecast by Segmentation (by Value and Volume) 2024-2032 5.1. Europe Hotels Market Size and Forecast, by Hotel Type (2024-2032) 5.2. Europe Hotels Market Size and Forecast, by Price Level (2024-2032) 5.3. Europe Hotels Market Size and Forecast, by Room Capacity (2024-2032) 5.4. Europe Hotels Market Size and Forecast, by Business Model (2024-2032) 5.5. Europe Hotels Market Size and Forecast, by Country (2024-2032) 5.5.1. United Kingdom 5.5.1.1. United Kingdom Hotels Market Size and Forecast, by Hotel Type (2024-2032) 5.5.1.2. United Kingdom Hotels Market Size and Forecast, by Price Level (2024-2032) 5.5.1.3. United Kingdom Hotels Market Size and Forecast, by Room Capacity (2024-2032) 5.5.1.4. United Kingdom Hotels Market Size and Forecast, by Business Model (2024-2032) 5.5.2. France 5.5.2.1. France Hotels Market Size and Forecast, by Hotel Type (2024-2032) 5.5.2.2. France Hotels Market Size and Forecast, by Price Level (2024-2032) 5.5.2.3. France Hotels Market Size and Forecast, by Room Capacity (2024-2032) 5.5.2.4. France Hotels Market Size and Forecast, by Business Model (2024-2032) 5.5.3. Germany 5.5.3.1. Germany Hotels Market Size and Forecast, by Hotel Type (2024-2032) 5.5.3.2. Germany Hotels Market Size and Forecast, by Price Level (2024-2032) 5.5.3.3. Germany Hotels Market Size and Forecast, by Room Capacity (2024-2032) 5.5.3.4. Germany Hotels Market Size and Forecast, by Business Model (2024-2032) 5.5.4. Italy 5.5.4.1. Italy Hotels Market Size and Forecast, by Hotel Type (2024-2032) 5.5.4.2. Italy Hotels Market Size and Forecast, by Price Level (2024-2032) 5.5.4.3. Italy Hotels Market Size and Forecast, by Room Capacity (2024-2032) 5.5.4.4. Italy Hotels Market Size and Forecast, by Business Model (2024-2032) 5.5.5. Spain 5.5.5.1. Spain Hotels Market Size and Forecast, by Hotel Type (2024-2032) 5.5.5.2. Spain Hotels Market Size and Forecast, by Price Level (2024-2032) 5.5.5.3. Spain Hotels Market Size and Forecast, by Room Capacity (2024-2032) 5.5.5.4. Spain Hotels Market Size and Forecast, by Business Model (2024-2032) 5.5.6. Sweden 5.5.6.1. Sweden Hotels Market Size and Forecast, by Hotel Type (2024-2032) 5.5.6.2. Sweden Hotels Market Size and Forecast, by Price Level (2024-2032) 5.5.6.3. Sweden Hotels Market Size and Forecast, by Room Capacity (2024-2032) 5.5.6.4. Sweden Hotels Market Size and Forecast, by Business Model (2024-2032) 5.5.7. Austria 5.5.7.1. Austria Hotels Market Size and Forecast, by Hotel Type (2024-2032) 5.5.7.2. Austria Hotels Market Size and Forecast, by Price Level (2024-2032) 5.5.7.3. Austria Hotels Market Size and Forecast, by Room Capacity (2024-2032) 5.5.7.4. Austria Hotels Market Size and Forecast, by Business Model (2024-2032) 5.5.8. Rest of Europe 5.5.8.1. Rest of Europe Hotels Market Size and Forecast, by Hotel Type (2024-2032) 5.5.8.2. Rest of Europe Hotels Market Size and Forecast, by Price Level (2024-2032) 5.5.8.3. Rest of Europe Hotels Market Size and Forecast, by Room Capacity (2024-2032) 5.5.8.4. Rest of Europe Hotels Market Size and Forecast, by Business Model (2024-2032) 6. Asia Pacific Hotels Market Size and Forecast by Segmentation (by Value and Volume) 2024-2032 6.1. Asia Pacific Hotels Market Size and Forecast, by Hotel Type (2024-2032) 6.2. Asia Pacific Hotels Market Size and Forecast, by Price Level (2024-2032) 6.3. Asia Pacific Hotels Market Size and Forecast, by Room Capacity (2024-2032) 6.4. Asia Pacific Hotels Market Size and Forecast, by Business Model (2024-2032) 6.5. Asia Pacific Hotels Market Size and Forecast, by Country (2024-2032) 6.5.1. China 6.5.1.1. China Hotels Market Size and Forecast, by Hotel Type (2024-2032) 6.5.1.2. China Hotels Market Size and Forecast, by Price Level (2024-2032) 6.5.1.3. China Hotels Market Size and Forecast, by Room Capacity (2024-2032) 6.5.1.4. China Hotels Market Size and Forecast, by Business Model (2024-2032) 6.5.2. S Korea 6.5.2.1. S Korea Hotels Market Size and Forecast, by Hotel Type (2024-2032) 6.5.2.2. S Korea Hotels Market Size and Forecast, by Price Level (2024-2032) 6.5.2.3. S Korea Hotels Market Size and Forecast, by Room Capacity (2024-2032) 6.5.2.4. S Korea Hotels Market Size and Forecast, by Business Model (2024-2032) 6.5.3. Japan 6.5.3.1. Japan Hotels Market Size and Forecast, by Hotel Type (2024-2032) 6.5.3.2. Japan Hotels Market Size and Forecast, by Price Level (2024-2032) 6.5.3.3. Japan Hotels Market Size and Forecast, by Room Capacity (2024-2032) 6.5.3.4. Japan Hotels Market Size and Forecast, by Business Model (2024-2032) 6.5.4. India 6.5.4.1. India Hotels Market Size and Forecast, by Hotel Type (2024-2032) 6.5.4.2. India Hotels Market Size and Forecast, by Price Level (2024-2032) 6.5.4.3. India Hotels Market Size and Forecast, by Room Capacity (2024-2032) 6.5.4.4. India Hotels Market Size and Forecast, by Business Model (2024-2032) 6.5.5. Australia 6.5.5.1. Australia Hotels Market Size and Forecast, by Hotel Type (2024-2032) 6.5.5.2. Australia Hotels Market Size and Forecast, by Price Level (2024-2032) 6.5.5.3. Australia Hotels Market Size and Forecast, by Room Capacity (2024-2032) 6.5.5.4. Australia Hotels Market Size and Forecast, by Business Model (2024-2032) 6.5.6. Indonesia 6.5.6.1. Indonesia Hotels Market Size and Forecast, by Hotel Type (2024-2032) 6.5.6.2. Indonesia Hotels Market Size and Forecast, by Price Level (2024-2032) 6.5.6.3. Indonesia Hotels Market Size and Forecast, by Room Capacity (2024-2032) 6.5.6.4. Indonesia Hotels Market Size and Forecast, by Business Model (2024-2032) 6.5.7. Malaysia 6.5.7.1. Malaysia Hotels Market Size and Forecast, by Hotel Type (2024-2032) 6.5.7.2. Malaysia Hotels Market Size and Forecast, by Price Level (2024-2032) 6.5.7.3. Malaysia Hotels Market Size and Forecast, by Room Capacity (2024-2032) 6.5.7.4. Malaysia Hotels Market Size and Forecast, by Business Model (2024-2032) 6.5.8. Vietnam 6.5.8.1. Vietnam Hotels Market Size and Forecast, by Hotel Type (2024-2032) 6.5.8.2. Vietnam Hotels Market Size and Forecast, by Price Level (2024-2032) 6.5.8.3. Vietnam Hotels Market Size and Forecast, by Room Capacity (2024-2032) 6.5.8.4. Vietnam Hotels Market Size and Forecast, by Business Model (2024-2032) 6.5.9. Taiwan 6.5.9.1. Taiwan Hotels Market Size and Forecast, by Hotel Type (2024-2032) 6.5.9.2. Taiwan Hotels Market Size and Forecast, by Price Level (2024-2032) 6.5.9.3. Taiwan Hotels Market Size and Forecast, by Room Capacity (2024-2032) 6.5.9.4. Taiwan Hotels Market Size and Forecast, by Business Model (2024-2032) 6.5.10. Rest of Asia Pacific 6.5.10.1. Rest of Asia Pacific Hotels Market Size and Forecast, by Hotel Type (2024-2032) 6.5.10.2. Rest of Asia Pacific Hotels Market Size and Forecast, by Price Level (2024-2032) 6.5.10.3. Rest of Asia Pacific Hotels Market Size and Forecast, by Room Capacity (2024-2032) 6.5.10.4. Rest of Asia Pacific Hotels Market Size and Forecast, by Business Model (2024-2032) 7. Middle East and Africa Hotels Market Size and Forecast by Segmentation (by Value and Volume) 2024-2032 7.1. Middle East and Africa Hotels Market Size and Forecast, by Hotel Type (2024-2032) 7.2. Middle East and Africa Hotels Market Size and Forecast, by Price Level (2024-2032) 7.3. Middle East and Africa Hotels Market Size and Forecast, by Room Capacity (2024-2032) 7.4. Middle East and Africa Hotels Market Size and Forecast, by Business Model (2024-2032) 7.5. Middle East and Africa Hotels Market Size and Forecast, by Country (2024-2032) 7.5.1. South Africa 7.5.1.1. South Africa Hotels Market Size and Forecast, by Hotel Type (2024-2032) 7.5.1.2. South Africa Hotels Market Size and Forecast, by Price Level (2024-2032) 7.5.1.3. South Africa Hotels Market Size and Forecast, by Room Capacity (2024-2032) 7.5.1.4. South Africa Hotels Market Size and Forecast, by Business Model (2024-2032) 7.5.2. GCC 7.5.2.1. GCC Hotels Market Size and Forecast, by Hotel Type (2024-2032) 7.5.2.2. GCC Hotels Market Size and Forecast, by Price Level (2024-2032) 7.5.2.3. GCC Hotels Market Size and Forecast, by Room Capacity (2024-2032) 7.5.2.4. GCC Hotels Market Size and Forecast, by Business Model (2024-2032) 7.5.3. Nigeria 7.5.3.1. Nigeria Hotels Market Size and Forecast, by Hotel Type (2024-2032) 7.5.3.2. Nigeria Hotels Market Size and Forecast, by Price Level (2024-2032) 7.5.3.3. Nigeria Hotels Market Size and Forecast, by Room Capacity (2024-2032) 7.5.3.4. Nigeria Hotels Market Size and Forecast, by Business Model (2024-2032) 7.5.4. Rest of ME&A 7.5.4.1. Rest of ME&A Hotels Market Size and Forecast, by Hotel Type (2024-2032) 7.5.4.2. Rest of ME&A Hotels Market Size and Forecast, by Price Level (2024-2032) 7.5.4.3. Rest of ME&A Hotels Market Size and Forecast, by Room Capacity (2024-2032) 7.5.4.4. Rest of ME&A Hotels Market Size and Forecast, by Business Model (2024-2032) 8. South America Hotels Market Size and Forecast by Segmentation (by Value and Volume) 2024-2032 8.1. South America Hotels Market Size and Forecast, by Hotel Type (2024-2032) 8.2. South America Hotels Market Size and Forecast, by Price Level (2024-2032) 8.3. South America Hotels Market Size and Forecast, by Room Capacity(2024-2032) 8.4. South America Hotels Market Size and Forecast, by Business Model (2024-2032) 8.5. South America Hotels Market Size and Forecast, by Country (2024-2032) 8.5.1. Brazil 8.5.1.1. Brazil Hotels Market Size and Forecast, by Hotel Type (2024-2032) 8.5.1.2. Brazil Hotels Market Size and Forecast, by Price Level (2024-2032) 8.5.1.3. Brazil Hotels Market Size and Forecast, by Room Capacity (2024-2032) 8.5.1.4. Brazil Hotels Market Size and Forecast, by Business Model (2024-2032) 8.5.2. Argentina 8.5.2.1. Argentina Hotels Market Size and Forecast, by Hotel Type (2024-2032) 8.5.2.2. Argentina Hotels Market Size and Forecast, by Price Level (2024-2032) 8.5.2.3. Argentina Hotels Market Size and Forecast, by Room Capacity (2024-2032) 8.5.2.4. Argentina Hotels Market Size and Forecast, by Business Model (2024-2032) 8.5.3. Rest Of South America 8.5.3.1. Rest Of South America Hotels Market Size and Forecast, by Hotel Type (2024-2032) 8.5.3.2. Rest Of South America Hotels Market Size and Forecast, by Price Level (2024-2032) 8.5.3.3. Rest Of South America Hotels Market Size and Forecast, by Room Capacity (2024-2032) 8.5.3.4. Rest Of South America Hotels Market Size and Forecast, by Business Model (2024-2032) 9. Global Hotels Market: Competitive Landscape 9.1. MMR Competition Matrix 9.2. Competitive Landscape 9.3. Key Players Benchmarking 9.3.1. Company Name 9.3.2. Business Segment 9.3.3. End-user Segment 9.3.4. Revenue (2022) 9.3.5. Production of 2022 9.3.6. Company Locations 9.4. Leading Hotels Market Companies, by market capitalization 9.5. Analysis of Organized and Unorganized Key Players in Hotels Industry 9.6. Market Structure 9.6.1. Market Leaders 9.6.2. Market Followers 9.6.3. Emerging Players 9.7. Mergers and Acquisitions Details 10. Company Profile: Key Players 10.1. Accor SA / Accor 10.1.1. Company Overview 10.1.2. Business Portfolio 10.1.3. Financial Overview 10.1.4. SWOT Analysis 10.1.5. Strategic Analysis 10.1.6. Scale of Operation (small, medium, and large) 10.1.7. Details on Partnership 10.1.8. Regulatory Accreditations and Certifications Received by Them 10.1.9. Awards Received by the Firm 10.1.10. Recent Developments 10.2. Marriott International 10.3. Hyatt Hotels Corporation 10.4. Hilton Worldwide Holdings Inc. 10.5. InterContinental Hotels Group PLC (IHG) 10.6. Best Western International, Inc. 10.7. Choice Hotels International, Inc. 10.8. Wyndham Destinations, Inc. 10.9. Radisson Hospitality A.B. / Radisson Hotel Group 10.10. Indian Hotels Company Limited / Taj Hotels 10.11. Oravel Stays Private Limited 10.12. TC Limited 10.13. EIH Limited / Oberoi Hotels & Resorts 10.14. Bharat Hotels Limited / ITC Hotels 10.15. Lemon Tree Hotels 10.16. The Leela Palaces 10.17. Four Seasons Hotels and Resorts 10.18. Huazhu Hotels Group 10.19. Ryman Hotel Properties 10.20. GF Hotels & Resorts 10.21. HOTEL THE MITSUI KYOTO 10.22. The Hoxton 10.23. The Muraka at Conrad Maldives Rangali Island 10.24. Motel One 10.25. Eccleston Square 10.26. W Singapore Sentosa Cove 10.27. YOTEL Singapore Orchard Road Hotel 10.28. Hotel Clark Budapest 10.29. Hotel Chinzanso Tokyo 11. Key Findings 12. Industry Recommendations 13. Hotels Market: Research Methodology 14. Terms and Glossary