
Transportation for Smart Cities Market Size by Service, Region – Segment-Level Market Assessment, Growth Opportunity Analysis & Competitive Mapping
Overview
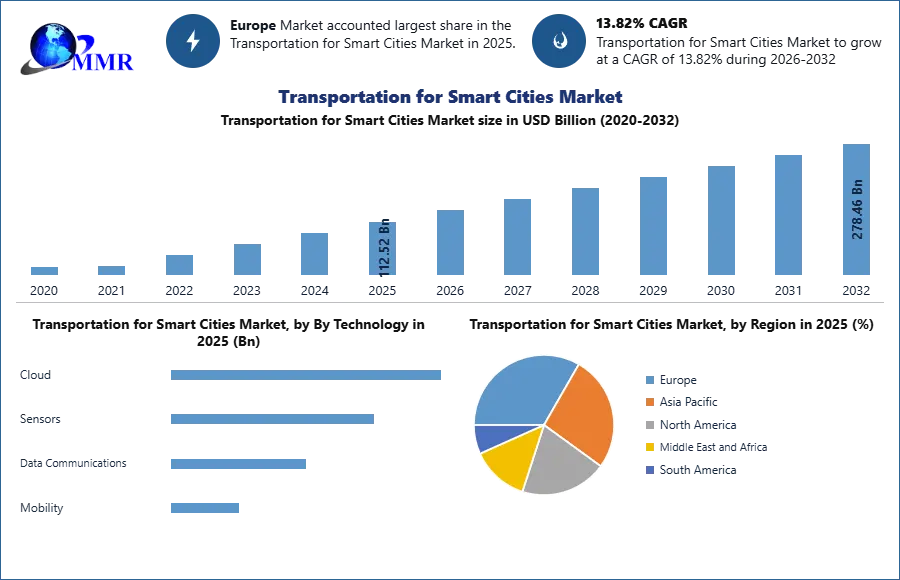
Global Transportation for Smart Cities Market size was valued at USD 112.52 Bn. in 2025, and the is expected to grow at a CAGR of 13.82% from 2026 to 2032, reaching nearly USD 278.46Bn. by 2032.
To know about the Research Methodology :- Request Free Sample Report
Global Transportation for Smart Cities Market: Market Overview
The smart city is well-connected city that uses information and communication technology to increase operational efficiency, share information among public of city to improve the quality of government services and citizen welfare. This technology is widely adopted to improve mass transportation across the cities through the implementation of more advanced projects. The smart transportation system combines several information and technology that includes Internet of Things (IoT), GPS and fiber optics to advance the transportation infrastructure.
Global Transportation for Smart Cities Market: Market Dynamics
The major factors which drives the transportation for smart cities include rising need among transport authorities to create a system to manage traffic and improve safety of road and passengers. The development of advanced technology such as Internet of things (IoT), also rapid advancement in Information and communication including the cloud, development in data communication, sensors, and fibers is anticipated to drive the transportation for smart cities market throughout the forecast period. Growing urbanization and industrialization and rising the need of better-quality life are driving the market growth. In addition, by the support and initiative taken by the government of several nations across the globe in order to improve the transportation and infrastructure in smart cities is expected to fuel the growth of the market.
The project requires a high capital investment which is not done without the support of government and other transport organization hinder the growth of the market. This system deploys large number of software and sensors which tend to share a large amount of personal information, so the fear of leak of personal information hinder the growth of the market. Low rate of adoption of advanced technology in developing nations are the restrain for the global transportation for smart cities market during the forecast period.
Global Transportation for Smart Cities Market: Market Segmentation
The cloud segment of technology is expected to have a significant growth rate, owing to the rising advancement of technologies, the usage of cloud technology in order to improve transportation services and facilities. The bus rapid transit system (BRTS) is dominating the transportation for smart cities market during the forecast period as this system avoid the traffic congestion. Based on service, the software segment holds the major share of the global transportation for smart cities market. Various software are used in this system such as traffic management, parking management, ticket management, and passenger information management. This software provide the safety to the passengers.
Global Transportation for Smart Cities Market: Regional Analysis
Europe is dominating the global transportation for smart cities market during the forecast period. A large number of end project being undertaken in this region. Government support and investment of a large amount of revenue for improving the infrastructure for the transportation is contributing to market growth in this region. Large amount of revenue is invested in IT and telecommunication sector in this region. High adoption rate of advanced technology such as IoT, implementation of AI technology in smart cities for improving the transportation service is also contributing to market growth.
Europe is followed by Asia Pacific due to rising working population, growing investment by government of several countries in the region in major projects to improve the transportation for smart cities facilities. Presence of a large number of premium car manufacturers in this region. Most of the consumers prefer semi-automatic transmission in their vehicle. The auto manufacturers are spending a large part of their revenue on research and development to provide more comfortable driving experience to their customers anticipated to drive the Transportation for Smart Cities market in this region. Europe held substantial share of this market due to high adoption rate of advanced technology.
Global Transportation for Smart Cities Market Recent Developments:
| Exact Date | Company | Development | Impact |
| 13 March 2026 | Huawei | Huawei announced at MWC 2026 the world's first commercial deployment of a 1.4 GHz 5G Fixed Wireless Access (FWA) network for railways in Indonesia. | This provides a digital backbone for railway corridors, enabling real-time intermodal tracking and nationwide connectivity along rail lines for smart logistics. |
| 12 March 2026 | Kapsch TrafficCom | Kapsch President JB Kendrick was appointed to the ITS America Board of Directors, focusing on national policy for intelligent transportation deployment. | The appointment places Kapsch at the forefront of U.S. transportation policy, specifically regarding the shift toward V2X-enabled tolling and digital infrastructure standards. |
| 11 March 2026 | Kapsch TrafficCom / TomTom | Kapsch selected TomTom Traffic data to enhance its global Traffic Management Solutions, integrating real-time flow data into its command centers. | The partnership improves congestion management accuracy, allowing city operators to respond to incidents 20% faster through more precise, predictive traffic modeling. |
| 03 February 2026 | Siemens AG | At DTECH 2026, Siemens debuted the RUGGEDCOM RX1460P, a next-generation routing solution for fault-tolerant data acquisition in smart infrastructure. | This provides a resilient communications backbone for digital substations and traffic grids, ensuring continuous monitoring and faster fault detection in autonomous city systems. |
| 23 July 2025 | Cubic Corporation | Cubic Transportation Systems launched a strategic alliance with UrbanLogiq to integrate AI-driven analytics into its Intelligent Transportation Systems (ITS) software. | The collaboration enables city agencies to simulate future traffic scenarios and automate congestion management, transitioning from reactive to predictive urban mobility planning. |
| 01 April 2025 | Hitachi Ltd. | Hitachi launched its "Inspire 2027" management plan, prioritizing the integration of Generative AI (GenAI) into its Green Energy & Mobility sectors. | The plan targets "harmonized society" outcomes, using AI to optimize EV charging grids and autonomous public transit, aiming for a 15% improvement in urban energy efficiency. |
The objective of the report is to present a comprehensive analysis of the Global Transportation for Smart Cities Marketincluding all the stakeholders of the industry. The past and current status of the industry with forecasted market size and trends are presented in the report with the analysis of complicated data in simple language. The report covers all the aspects of the industry with a dedicated study of key players that includes market leaders, followers, and new entrants. PORTER, SVOR, PESTEL analysis with the potential impact of micro-economic factors of the market has been presented in the report. External as well as internal factors that are supposed to affect the business positively or negatively have been analysed, which will give a clear futuristic view of the industry to the decision-makers.
The report also helps in understanding the Global Transportation for Smart Cities Market dynamics, structure by analysing the market segments and projects the Global Transportation for Smart Cities Market size. Clear representation of competitive analysis of key players by Service, price, financial position, Product portfolio, growth strategies, and regional presence in the Global Transportation for Smart Cities Market make the report investor’s guide.
Scope of the Global Transportation for Smart Cities Market :Inquire before buying
| Transportation for Smart Cities Market | |||
|---|---|---|---|
| Report Coverage | Details | ||
| Base Year: | 2025 | Forecast Period: | 2026-2032 |
| Historical Data: | 2020 to 2025 | Market Size in 2025: | 112.52 USD Billion |
| Forecast Period 2026-2032 CAGR: | 13.82% | Market Size in 2032: | 278.46 USD Billion |
| Segments Covered: | By Technology | Cloud Sensors Data Communications Mobility |
|
| by Transportation Mode | Metro Bus Rapid Transit System (BRTS) Monorail |
||
| by Service | Hardware Software |
||
Global Transportation for Smart Cities Market, by Region
• Asia Pacific
• North America
• Europe
• South America
• MEA
Global Transportation for Smart Cities Market, Key Players
- Siemens AG
- Huawei Holding Co. Ltd.
- Cisco Systems Inc.
- Avail Technologies Inc.
- IBM Corporation
- Microsoft Corporation
- Thales Group
- Oracle Corporation
- TomTom International Inc.
- Schneider Electric
- WS Atkins PLC
- Ericsson
- Agero Inc.
- Hitachi Ltd.
- Toshiba Corporation
- Accenture Plc
- Kapsch TrafficCom
- Cubic Corporation
- Xerox Corporation
- Iteris Inc.
- LG CNS Co. Ltd.
- Indra Sistemas
- Trapeze Software
- TransCore Inc.
Others