Revenue Cycle Management Market: Global Analysis and Forecast (2024-2030)

The Revenue Cycle Management Market size was valued at USD 150.02 Billion in 2023 and the total Revenue Cycle Management revenue is expected to grow at a CAGR of 10.8% from 2024 to 2030, reaching nearly USD 307.56 Billion by 2030.

Revenue Cycle Management Market Overview:

The Revenue cycle management, which encompasses all clinical and administrative activities related to generating and collecting patient revenue, has grown in importance in today's competitive environment, as hospitals face stricter regulations and invoicing requirements, underpayments, and longer payment delays. Notwithstanding practitioners continuous interest, revenue cycle management has gained little attention in health care finance research. All clinical and administrative operations connected to the development, management, and collection of patient care revenue are included in hospital revenue cycle management. Although previously focused on back-end tasks such as payments and collections, clinic financial managers have recently shifted their focus to the front end of the revenue cycle, such as patient registration and filing, insurance verification, and prior authorization, as well as core revenue cycle tasks such as medical documentation and coding.Revenue Cycle Management Market
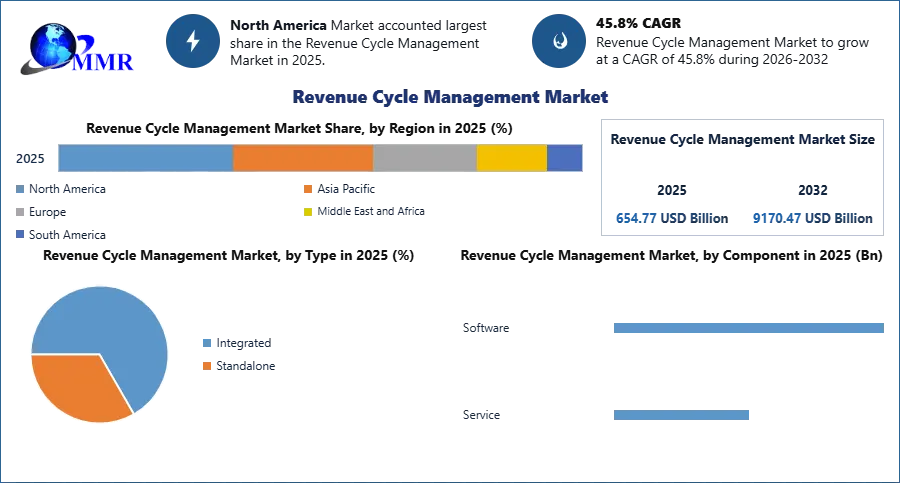
To know about the Research Methodology :- Request Free Sample Report The bottom-up approach has been used to estimate the market size. Key Players in the Revenue Cycle Management market are identified through secondary research and their market revenues are determined through primary and secondary research. Secondary research included a review of annual and financial reports of leading manufacturers, while primary research included interviews with important opinion leaders and industry experts such as skilled front-line personnel, entrepreneurs, and marketing professionals. Some of the leading key players in the global Revenue Cycle Management market include Epic Systems Corporation, NXGN Management, LLC, CareCloud Corporation, and Quest Diagnostics, Inc.

Revenue Cycle Management Market Dynamics

The implementation of the R1 Professional revenue cycle management solution offers healthcare facilities and various stakeholders the capability to establish a standardized strategy for reimbursement and operations models within the Revenue Cycle Management (RCM) framework. Innovations in RCM solutions have been instrumental in advancing provider-patient relations, notably through the implementation of ICD-10 for classifying, coding, and reporting data on disease diagnosis and treatment procedures. This strategic integration directly contributes to healthcare systems enhancing care delivery. Recognizing the multiple advantages associated with outsourcing RCM software solutions, healthcare facilities are increasingly leveraging this approach. The benefits include easy access to trained professionals, compliance with required regulations, heightened efficiency, and cost-effectiveness. The appeal of outsourcing RCM solutions and services is evident in the healthcare sector, where over 61% of providers express interest in this external approach, as indicated by a survey conducted by CWH Advisors and sponsored by CareCredit. This growing adoption trend is poised to drive Revenue Cycle Management Market growth during the forecast period. However, challenges persist in the adoption and implementation of RCM software solutions, particularly concerning the lack of proper reimbursement regulations related to insurance and other formalities. Existing policy gaps between public and private insurers present a notable constraint, impeding the growth potential of the Revenue Cycle Management Market. The enduring Covid-19 pandemic has introduced unprecedented and unforeseen disruptions across the majority of healthcare sectors, prompting significant transformations in the normal functioning of healthcare systems. Healthcare providers and payers have grappled with numerous challenges, including the impact on revenue earnings and inpatient volume. The complexity of medical billing and the escalation of healthcare costs have led to a substantial increase in the global demand for outsourcing Revenue Cycle Management (RCM) solutions. This surge in demand for advanced and innovative RCM solutions has compelled key participants to develop value-added features, such as payer connect, remote coding services, reporting, analytics, and audit and compliance, aimed at enhancing revenue generation and productivity. The proliferation of hospitals is exerting a positive influence on the Revenue Cycle Management (RCM) Market in multiple ways. The growing number of healthcare facilities results in an expanded volume of healthcare services, generating a higher frequency of transactions and billing processes. This increased activity creates a favorable environment for the growth of the RCM market. The expanding hospital landscape also brings forth heightened regulatory and compliance challenges, driving the demand for robust RCM solutions to ensure adherence to evolving healthcare policies. The increasing presence of hospitals contributes to the expansion and innovation within the RCM market, enhancing its capabilities to meet the evolving needs of the healthcare industry.

Revenue Cycle Management Market1Revenue Cycle Management Market Segment Analysis

The Software segment is estimated to grab larger market attention in the Revenue Cycle Management Market. In 2022, the software category dominated the revenue cycle management market, accounting for 61.1% of total revenue. In recent years, as a result of the digitalization of processes and streamlining for improved patient care, an increasing volume of data has led to the adoption of solutions; as a result, healthcare analytical software solutions are being used more frequently and are gaining traction. According to MMR, 90 percent of healthcare businesses employ data and analytical software to improve quality and revenue cycle management. The service segment, on the other hand, is likely to grow at the quickest rate during the forecast period, owing to an increase in the number of market participants Product outsourced services to healthcare facilities, which is expected to promote market growth during the forecast period. Furthermore, strategic initiatives done by players are expected to support the revenue cycle management market's growth over the forecast period. Cerner, for example, announced the sale of Cerner RevWorks, its revenue cycle management outsourcing company, to R1 RCM, Inc. in 2022. This will aid in the integration of both firms' technology platforms and expand R1's RCM capabilities.Revenue Cycle Management Market2The physician back-office segment is enhancing the growth of the Revenue Cycle Management Market. The physician back-office sector dominated the worldwide revenue cycle management market in 2022, accounting for 34.8% of total revenue. The increased focus of various healthcare institutions and organizations on implementing these systems and increasing the number of physicians is expected to drive market growth. The Association of American Medical Colleges, for example, is one such organization working to increase the number of physicians in the region. Such occurrences are advantageous to the market's growth. The Web-based segment is fueling the growth of the Revenue Cycle Management Market. In 2022, the web-based segment asserted its dominance in the revenue cycle management market, commanding a significant revenue share of 46.7%. This segment is expected to maintain a steady growth trajectory during the forecast period. The future outlook suggests that the increasing adoption of web-based solutions will be a key driver for the overall market expansion. Notable web-based practice management options currently available include Advanced HIMS, Simplex HIMES, e-Hospital Systems, and Athena One. As the reliance on web-based solutions continues to rise, the market is poised for sustained growth in the coming years. The integrated segment emerged as the market leader, capturing a substantial share of 70.1% in 2022, primarily driven by the escalating preference for volume-based payments over value-based payments. Integrated solutions present a unified and harmonized framework for diverse financial activities through a single platform, facilitating a standardized process for data collection and analysis. Integrated revenue cycle management brings forth numerous advantages, ranging from bolstering collections to strategizing alternative payment and reimbursement methodologies. Effective integration initiatives empower healthcare professionals to enhance productivity, reduce costs, augment collections, and improve net operating margins. The integrated service category is poised to experience rapid growth, fueled by the increasing demand to enhance the efficiency of healthcare systems, the expansion of healthcare facilities, and the upward trajectory of healthcare costs. Additionally, the rising imperative to minimize or eliminate human errors and expedite administrative functions is expected to further propel the growth of integrated services in the market.

Revenue Cycle Management Market Regional Analysis

In 2022, North America commanded the Revenue Cycle Management Market with a robust share of 55.6%, primarily driven by the expanding presence of physician's offices in the United States. Regulatory reforms, exemplified by amendments in ICD-10, instigated a profound digital transformation in healthcare systems, leading to a substantial surge in the demand for healthcare IT solutions, including Revenue Cycle Management (RCM) systems. This surge is propelled by the collective aim to enhance efficiency and elevate care delivery standards. The region's landscape is further characterized by the prominence of large, renowned hospitals and well-established healthcare facilities, along with a growing imperative to minimize healthcare costs. Favorable regulations further contribute to the region's attractiveness, presenting lucrative growth opportunities for the Revenue Cycle Management Market. On other hand, in the Asia Pacific, the market is poised to register the fastest growth rate in the coming years. This estimate is underpinned by favorable government initiatives and support, a growing emphasis on enhancing the quality of care delivery, increasing digital literacy, a rising adoption of healthcare IT solutions, advancing healthcare infrastructure, escalating healthcare IT spending, and the mounting unmet healthcare needs of emerging economies. Additionally, the Asia Pacific market offers the advantages of low manufacturing costs and the availability of a cost-effective workforce, thereby enhancing the ease of doing business in the region. Key Players Overview Market leaders are implementing diverse strategic measures to broaden their business reach and secure a competitive advantage. Key participants are strategically engaged in activities such as mergers and acquisitions, technological collaborations, partnerships, funding and investments, and the introduction of innovative products to enhance their capabilities and expand their product portfolios. As an illustration, in January 2020, R1 RCM, Inc. forged a strategic partnership with Rush University System for Health (RUSH) intending to achieve excellence in revenue cycle performance and foster innovation in the healthcare sector.

Revenue Cycle Management Market Scope: Inquire before buying

Global Revenue Cycle Management Market
Report Coverage Details
Base Year: 2023 Forecast Period: 2024-2030
Historical Data: 2018 to 2023 Market Size in 2023: US $ 150.02 Bn.
Forecast Period 2024 to 2030 CAGR: 10.8% Market Size in 2030: US $ 307.56 Bn.
Segments Covered: By Product Software Service
By  Delivery Mode Cloud On-premise
By  End-User Physician Offices Hospitals Diagnostic Laboratories Others

Revenue Cycle Management Market by Region:

North America (United States, Canada, and Mexico) Europe (UK, France, Germany, Italy, Spain, Sweden, Austria, and the Rest of Europe) Asia Pacific (China, South Korea, Japan, India, Australia, Indonesia, Malaysia, Vietnam, Taiwan, Bangladesh, Pakistan, and the Rest of APAC) Middle East and Africa (South Africa, GCC, Egypt, Nigeria, and the Rest of ME&A) South America (Brazil, Argentina Rest of South America)

Revenue Cycle Management Market Key Players:

North America: 1. Cerner Corporation(Missouri, USA) 2. Epic Systems Corporation (Wisconsin, USA) 3. McKesson Corporation(Texas, USA) 4. Allscripts Healthcare Softwares (Illinois, USA) 5. eClinicalWorks (Massachusetts, USA) 6. GE Healthcare (Illinois, USA) 7. Athenahealth (Massachusetts, USA) 8. Quest Diagnostics (New Jersey, USA) 9. Change Healthcare (Tennessee, USA) 10. Conifer Health Softwares (Texas, USA) Europe: 1. Siemens Healthineers (Germany) 2. Agfa-Gevaert Group (Belgium) 3. Dräger (Germany) 4. Medtronic (Ireland) 5. Sectra AB (Sweden) 6. Nexus AG (Germany) 7. CompuGroup Medical AG (Germany) 8. Dedalus Group (Italy) 9. Orion Health Group Limited (New Zealand) 10. Philips Healthcare (Netherlands) Asia Pacific: 1. Huawei Technologies Co., Ltd.( China) 2. Infosys Limited (India) 3. TCS (Tata Consultancy Services)( India) 4. Fujifilm Holdings Corporation (Japan) 5. Wipro Limited(India)

FAQs:

1. Which region has the largest share in Global Revenue Cycle Management Market? Ans: North America region holds the highest share in 2023. 2. What is the growth rate of Global Revenue Cycle Management Market? Ans: The Global Revenue Cycle Management Market is growing at a CAGR of 10.8% during forecasting period 2024-2030. 3. What segments are covered in Global Revenue Cycle Management market? Ans: Global Revenue Cycle Management Market is segmented into Product, Delivery Mode, End-User and region. 4. Who are the key players in Global Revenue Cycle Management market? Ans: The important key players in the Global Revenue Cycle Management Market are Cerner Corporation, Epic Systems Corporation, McKesson Corporation, Allscripts Healthcare Softwares, eClinicalWorks, GE Healthcare, Athenahealth, Quest Diagnostics, Change Healthcare, Conifer Health Softwares. 5. What is the study period of this market? Ans: The Global Revenue Cycle Management Market is studied from 2023 to 2030.
1. Revenue Cycle Management Market: Research Methodology 2. Revenue Cycle Management Market Introduction 2.1. Study Assumption and Market Definition 2.2. Scope of the Study 2.3. Executive Summary 3. Revenue Cycle Management Market: Dynamics 3.1. Revenue Cycle Management Market Trends by Region 3.1.1. North America Revenue Cycle Management Market Trends 3.1.2. Europe Revenue Cycle Management Market Trends 3.1.3. Asia Pacific Revenue Cycle Management Market Trends 3.1.4. Middle East and Africa Revenue Cycle Management Market Trends 3.1.5. South America Revenue Cycle Management Market Trends 3.2. Revenue Cycle Management Market Dynamics by Region 3.2.1. North America 3.2.1.1. North America Revenue Cycle Management Market Drivers 3.2.1.2. North America Revenue Cycle Management Market Restraints 3.2.1.3. North America Revenue Cycle Management Market Opportunities 3.2.1.4. North America Revenue Cycle Management Market Challenges 3.2.2. Europe 3.2.2.1. Europe Revenue Cycle Management Market Drivers 3.2.2.2. Europe Revenue Cycle Management Market Restraints 3.2.2.3. Europe Revenue Cycle Management Market Opportunities 3.2.2.4. Europe Revenue Cycle Management Market Challenges 3.2.3. Asia Pacific 3.2.3.1. Asia Pacific Revenue Cycle Management Market Drivers 3.2.3.2. Asia Pacific Revenue Cycle Management Market Restraints 3.2.3.3. Asia Pacific Revenue Cycle Management Market Opportunities 3.2.3.4. Asia Pacific Revenue Cycle Management Market Challenges 3.2.4. Middle East and Africa 3.2.4.1. Middle East and Africa Revenue Cycle Management Market Drivers 3.2.4.2. Middle East and Africa Revenue Cycle Management Market Restraints 3.2.4.3. Middle East and Africa Revenue Cycle Management Market Opportunities 3.2.4.4. Middle East and Africa Revenue Cycle Management Market Challenges 3.2.5. South America 3.2.5.1. South America Revenue Cycle Management Market Drivers 3.2.5.2. South America Revenue Cycle Management Market Restraints 3.2.5.3. South America Revenue Cycle Management Market Opportunities 3.2.5.4. South America Revenue Cycle Management Market Challenges 3.3. PORTER’s Five Forces Analysis 3.4. PESTLE Analysis 3.5. Regulatory Landscape by Region 3.5.1. North America 3.5.2. Europe 3.5.3. Asia Pacific 3.5.4. Middle East and Africa 3.5.5. South America 3.6. Key Opinion Leader Analysis For Revenue Cycle Management Market 3.7. Analysis of Government Schemes and Initiatives For Revenue Cycle Management Market 3.8. The Global Pandemic Impact on Revenue Cycle Management Market 4. Revenue Cycle Management Market: Global Market Size and Forecast by Segmentation (by Value in USD Million) (2023-2030) 4.1. Revenue Cycle Management Market Size and Forecast, by Product (2023-2030) 4.1.1. Software 4.1.2. Services 4.2. Revenue Cycle Management Market Size and Forecast, by Delivery Mode (2023-2030) 4.2.1. Cloud 4.2.2. On-premise 4.3. Revenue Cycle Management Market Size and Forecast, by End-User (2023-2030) 4.3.1. Physician Offices 4.3.2. Hospitals 4.3.3. Diagnostic Laboratories 4.3.4. Others 4.4. Revenue Cycle Management Market Size and Forecast, by Region (2023-2030) 4.4.1. North America 4.4.2. Europe 4.4.3. Asia Pacific 4.4.4. Middle East and Africa 4.4.5. South America 5. North America Revenue Cycle Management Market Size and Forecast by Segmentation (by Value in USD Million) (2023-2030) 5.1. North America Revenue Cycle Management Market Size and Forecast, by Product (2023-2030) 5.1.1. Software 5.1.2. Services 5.2. North America Revenue Cycle Management Market Size and Forecast, by Delivery Mode (2023-2030) 5.2.1. Cloud 5.2.2. On-premise 5.3. North America Revenue Cycle Management Market Size and Forecast, by End-User (2023-2030) 5.3.1. Physician Offices 5.3.2. Hospitals 5.3.3. Diagnostic Laboratories 5.3.4. Others 5.4. North America Revenue Cycle Management Market Size and Forecast, by Country (2023-2030) 5.4.1. United States 5.4.1.1. United States Revenue Cycle Management Market Size and Forecast, by Product (2023-2030) 5.4.1.1.1. Software 5.4.1.1.2. Services 5.4.1.2. United States Revenue Cycle Management Market Size and Forecast, by Delivery Mode (2023-2030) 5.4.1.2.1. Cloud 5.4.1.2.2. On-premise 5.4.1.3. United States Revenue Cycle Management Market Size and Forecast, by End-User (2023-2030) 5.4.1.3.1. Physician Offices 5.4.1.3.2. Hospitals 5.4.1.3.3. Diagnostic Laboratories 5.4.1.3.4. Others 5.4.2. Canada 5.4.2.1. Canada Revenue Cycle Management Market Size and Forecast, by Product (2023-2030) 5.4.2.1.1. Software 5.4.2.1.2. Services 5.4.2.2. Canada Revenue Cycle Management Market Size and Forecast, by Delivery Mode (2023-2030) 5.4.2.2.1. Cloud 5.4.2.2.2. On-premise 5.4.2.3. Canada Revenue Cycle Management Market Size and Forecast, by End-User (2023-2030) 5.4.2.3.1. Physician Offices 5.4.2.3.2. Hospitals 5.4.2.3.3. Diagnostic Laboratories 5.4.2.3.4. Others 5.4.3. Mexico 5.4.3.1. Mexico Revenue Cycle Management Market Size and Forecast, by Product (2023-2030) 5.4.3.1.1. Software 5.4.3.1.2. Services 5.4.3.2. Mexico Revenue Cycle Management Market Size and Forecast, by Delivery Mode (2023-2030) 5.4.3.2.1. Cloud 5.4.3.2.2. On-premise 5.4.3.3. Mexico Revenue Cycle Management Market Size and Forecast, by End-User (2023-2030) 5.4.3.3.1. Physician Offices 5.4.3.3.2. Hospitals 5.4.3.3.3. Diagnostic Laboratories 5.4.3.3.4. Others 6. Europe Revenue Cycle Management Market Size and Forecast by Segmentation (by Value in USD Million) (2023-2030) 6.1. Europe Revenue Cycle Management Market Size and Forecast, by Product (2023-2030) 6.2. Europe Revenue Cycle Management Market Size and Forecast, by Delivery Mode (2023-2030) 6.3. Europe Revenue Cycle Management Market Size and Forecast, by End-User (2023-2030) 6.4. Europe Revenue Cycle Management Market Size and Forecast, by Country (2023-2030) 6.4.1. United Kingdom 6.4.1.1. United Kingdom Revenue Cycle Management Market Size and Forecast, by Product (2023-2030) 6.4.1.2. United Kingdom Revenue Cycle Management Market Size and Forecast, by Delivery Mode (2023-2030) 6.4.1.3. United Kingdom Revenue Cycle Management Market Size and Forecast, by End-User (2023-2030) 6.4.2. France 6.4.2.1. France Revenue Cycle Management Market Size and Forecast, by Product (2023-2030) 6.4.2.2. France Revenue Cycle Management Market Size and Forecast, by Delivery Mode (2023-2030) 6.4.2.3. France Revenue Cycle Management Market Size and Forecast, by End-User (2023-2030) 6.4.3. Germany 6.4.3.1. Germany Revenue Cycle Management Market Size and Forecast, by Product (2023-2030) 6.4.3.2. Germany Revenue Cycle Management Market Size and Forecast, by Delivery Mode (2023-2030) 6.4.3.3. Germany Revenue Cycle Management Market Size and Forecast, by End-User (2023-2030) 6.4.4. Italy 6.4.4.1. Italy Revenue Cycle Management Market Size and Forecast, by Product (2023-2030) 6.4.4.2. Italy Revenue Cycle Management Market Size and Forecast, by Delivery Mode (2023-2030) 6.4.4.3. Italy Revenue Cycle Management Market Size and Forecast, by End-User (2023-2030) 6.4.5. Spain 6.4.5.1. Spain Revenue Cycle Management Market Size and Forecast, by Product (2023-2030) 6.4.5.2. Spain Revenue Cycle Management Market Size and Forecast, by Delivery Mode (2023-2030) 6.4.5.3. Spain Revenue Cycle Management Market Size and Forecast, by End-User (2023-2030) 6.4.6. Sweden 6.4.6.1. Sweden Revenue Cycle Management Market Size and Forecast, by Product (2023-2030) 6.4.6.2. Sweden Revenue Cycle Management Market Size and Forecast, by Delivery Mode (2023-2030) 6.4.6.3. Sweden Revenue Cycle Management Market Size and Forecast, by End-User (2023-2030) 6.4.7. Austria 6.4.7.1. Austria Revenue Cycle Management Market Size and Forecast, by Product (2023-2030) 6.4.7.2. Austria Revenue Cycle Management Market Size and Forecast, by Delivery Mode (2023-2030) 6.4.7.3. Austria Revenue Cycle Management Market Size and Forecast, by End-User (2023-2030) 6.4.8. Rest of Europe 6.4.8.1. Rest of Europe Revenue Cycle Management Market Size and Forecast, by Product (2023-2030) 6.4.8.2. Rest of Europe Revenue Cycle Management Market Size and Forecast, by Delivery Mode (2023-2030) 6.4.8.3. Rest of Europe Revenue Cycle Management Market Size and Forecast, by End-User (2023-2030) 7. Asia Pacific Revenue Cycle Management Market Size and Forecast by Segmentation (by Value in USD Million) (2023-2030) 7.1. Asia Pacific Revenue Cycle Management Market Size and Forecast, by Product (2023-2030) 7.2. Asia Pacific Revenue Cycle Management Market Size and Forecast, by Delivery Mode (2023-2030) 7.3. Asia Pacific Revenue Cycle Management Market Size and Forecast, by End-User (2023-2030) 7.4. Asia Pacific Revenue Cycle Management Market Size and Forecast, by Country (2023-2030) 7.4.1. China 7.4.1.1. China Revenue Cycle Management Market Size and Forecast, by Product (2023-2030) 7.4.1.2. China Revenue Cycle Management Market Size and Forecast, by Delivery Mode (2023-2030) 7.4.1.3. China Revenue Cycle Management Market Size and Forecast, by End-User (2023-2030) 7.4.2. S Korea 7.4.2.1. S Korea Revenue Cycle Management Market Size and Forecast, by Product (2023-2030) 7.4.2.2. S Korea Revenue Cycle Management Market Size and Forecast, by Delivery Mode (2023-2030) 7.4.2.3. S Korea Revenue Cycle Management Market Size and Forecast, by End-User (2023-2030) 7.4.3. Japan 7.4.3.1. Japan Revenue Cycle Management Market Size and Forecast, by Product (2023-2030) 7.4.3.2. Japan Revenue Cycle Management Market Size and Forecast, by Delivery Mode (2023-2030) 7.4.3.3. Japan Revenue Cycle Management Market Size and Forecast, by End-User (2023-2030) 7.4.4. India 7.4.4.1. India Revenue Cycle Management Market Size and Forecast, by Product (2023-2030) 7.4.4.2. India Revenue Cycle Management Market Size and Forecast, by Delivery Mode (2023-2030) 7.4.4.3. India Revenue Cycle Management Market Size and Forecast, by End-User (2023-2030) 7.4.5. Australia 7.4.5.1. Australia Revenue Cycle Management Market Size and Forecast, by Product (2023-2030) 7.4.5.2. Australia Revenue Cycle Management Market Size and Forecast, by Delivery Mode (2023-2030) 7.4.5.3. Australia Revenue Cycle Management Market Size and Forecast, by End-User (2023-2030) 7.4.6. Indonesia 7.4.6.1. Indonesia Revenue Cycle Management Market Size and Forecast, by Product (2023-2030) 7.4.6.2. Indonesia Revenue Cycle Management Market Size and Forecast, by Delivery Mode (2023-2030) 7.4.6.3. Indonesia Revenue Cycle Management Market Size and Forecast, by End-User (2023-2030) 7.4.7. Malaysia 7.4.7.1. Malaysia Revenue Cycle Management Market Size and Forecast, by Product (2023-2030) 7.4.7.2. Malaysia Revenue Cycle Management Market Size and Forecast, by Delivery Mode (2023-2030) 7.4.7.3. Malaysia Revenue Cycle Management Market Size and Forecast, by End-User (2023-2030) 7.4.8. Vietnam 7.4.8.1. Vietnam Revenue Cycle Management Market Size and Forecast, by Product (2023-2030) 7.4.8.2. Vietnam Revenue Cycle Management Market Size and Forecast, by Delivery Mode (2023-2030) 7.4.8.3. Vietnam Revenue Cycle Management Market Size and Forecast, by End-User (2023-2030) 7.4.9. Taiwan 7.4.9.1. Taiwan Revenue Cycle Management Market Size and Forecast, by Product (2023-2030) 7.4.9.2. Taiwan Revenue Cycle Management Market Size and Forecast, by Delivery Mode (2023-2030) 7.4.9.3. Taiwan Revenue Cycle Management Market Size and Forecast, by End-User (2023-2030) 7.4.10. Rest of Asia Pacific 7.4.10.1. Rest of Asia Pacific Revenue Cycle Management Market Size and Forecast, by Product (2023-2030) 7.4.10.2. Rest of Asia Pacific Revenue Cycle Management Market Size and Forecast, by Delivery Mode (2023-2030) 7.4.10.3. Rest of Asia Pacific Revenue Cycle Management Market Size and Forecast, by End-User (2023-2030) 8. Middle East and Africa Revenue Cycle Management Market Size and Forecast by Segmentation (by Value in USD Million) (2023-2030 8.1. Middle East and Africa Revenue Cycle Management Market Size and Forecast, by Product (2023-2030) 8.2. Middle East and Africa Revenue Cycle Management Market Size and Forecast, by Delivery Mode (2023-2030) 8.3. Middle East and Africa Revenue Cycle Management Market Size and Forecast, by End-User (2023-2030) 8.4. Middle East and Africa Revenue Cycle Management Market Size and Forecast, by Country (2023-2030) 8.4.1. South Africa 8.4.1.1. South Africa Revenue Cycle Management Market Size and Forecast, by Product (2023-2030) 8.4.1.2. South Africa Revenue Cycle Management Market Size and Forecast, by Delivery Mode (2023-2030) 8.4.1.3. South Africa Revenue Cycle Management Market Size and Forecast, by End-User (2023-2030) 8.4.2. GCC 8.4.2.1. GCC Revenue Cycle Management Market Size and Forecast, by Product (2023-2030) 8.4.2.2. GCC Revenue Cycle Management Market Size and Forecast, by Delivery Mode (2023-2030) 8.4.2.3. GCC Revenue Cycle Management Market Size and Forecast, by End-User (2023-2030) 8.4.3. Nigeria 8.4.3.1. Nigeria Revenue Cycle Management Market Size and Forecast, by Product (2023-2030) 8.4.3.2. Nigeria Revenue Cycle Management Market Size and Forecast, by Delivery Mode (2023-2030) 8.4.3.3. Nigeria Revenue Cycle Management Market Size and Forecast, by End-User (2023-2030) 8.4.4. Rest of ME&A 8.4.4.1. Rest of ME&A Revenue Cycle Management Market Size and Forecast, by Product (2023-2030) 8.4.4.2. Rest of ME&A Revenue Cycle Management Market Size and Forecast, by Delivery Mode (2023-2030) 8.4.4.3. Rest of ME&A Revenue Cycle Management Market Size and Forecast, by End-User (2023-2030) 9. South America Revenue Cycle Management Market Size and Forecast by Segmentation (by Value in USD Million) (2023-2030 9.1. South America Revenue Cycle Management Market Size and Forecast, by Product (2023-2030) 9.2. South America Revenue Cycle Management Market Size and Forecast, by Delivery Mode (2023-2030) 9.3. South America Revenue Cycle Management Market Size and Forecast, by End-User (2023-2030) 9.4. South America Revenue Cycle Management Market Size and Forecast, by Country (2023-2030) 9.4.1. Brazil 9.4.1.1. Brazil Revenue Cycle Management Market Size and Forecast, by Product (2023-2030) 9.4.1.2. Brazil Revenue Cycle Management Market Size and Forecast, by Delivery Mode (2023-2030) 9.4.1.3. Brazil Revenue Cycle Management Market Size and Forecast, by End-User (2023-2030) 9.4.2. Argentina 9.4.2.1. Argentina Revenue Cycle Management Market Size and Forecast, by Product (2023-2030) 9.4.2.2. Argentina Revenue Cycle Management Market Size and Forecast, by Delivery Mode (2023-2030) 9.4.2.3. Argentina Revenue Cycle Management Market Size and Forecast, by End-User (2023-2030) 9.4.3. Rest Of South America 9.4.3.1. Rest Of South America Revenue Cycle Management Market Size and Forecast, by Product (2023-2030) 9.4.3.2. Rest Of South America Revenue Cycle Management Market Size and Forecast, by Delivery Mode (2023-2030) 9.4.3.3. Rest Of South America Revenue Cycle Management Market Size and Forecast, by End-User (2023-2030) 10. Global Revenue Cycle Management Market: Competitive Landscape 10.1. MMR Competition Matrix 10.2. Competitive Landscape 10.3. Key Players Benchmarking 10.3.1. Company Name 10.3.2. End-user Segment 10.3.3. Revenue (2022) 10.3.4. Company Locations 10.4. Leading Revenue Cycle Management Market Companies, by Market Capitalization 10.5. Market Structure 10.5.1. Market Leaders 10.5.2. Market Followers 10.5.3. Emerging Players 10.6. Mergers and Acquisitions Details 11. Company Profile: Key Players 11.1. Cerner Corporation. 11.1.1. Company Overview 11.1.2. Business Portfolio 11.1.3. Financial Overview 11.1.4. SWOT Analysis 11.1.5. Strategic Analysis 11.1.6. Scale of Operation (Small, Medium, and Large) 11.1.7. Details on Partnership 11.1.8. Regulatory Accreditations and Certifications Received by Them 11.1.9. Awards Received by the Firm 11.1.10. Recent Developments 11.2. Epic Systems Corporation 11.3. McKesson Corporation 11.4. Allscripts Healthcare Solutions 11.5. eClinicalWorks 11.6. GE Healthcare 11.7. Athenahealth 11.8. Quest Diagnostics 11.9. Change Healthcare 11.10. Conifer Health Solutions. 11.11. Siemens Healthineers 11.12. Agfa-Gevaert Group 11.13. Dräger 11.14. Medtronic 11.15. Wipro Limited 11.16. Sectra AB 11.17. Nexus AG 11.18. CompuGroup Medical AG 11.19. Dedalus Group 11.20. Orion Health Group Limited 11.21. Huawei Technologies Co., Ltd. 11.22. Infosys Limited 11.23. TCS (Tata Consultancy Services) 11.24. Philips Healthcare 11.25. Fujifilm Holdings Corporation 12. Key Findings 13. Industry Recommendations
  • INQUIRE BEFORE BUYING