
Global Precious Metals Market Size, Share & Industry Forecast (2026–2032) – Gold, Silver, and Platinum Group Metals Applications, Strategic Demand Shifts, Supply Constraints, and Digital Bullions Transformation
Overview
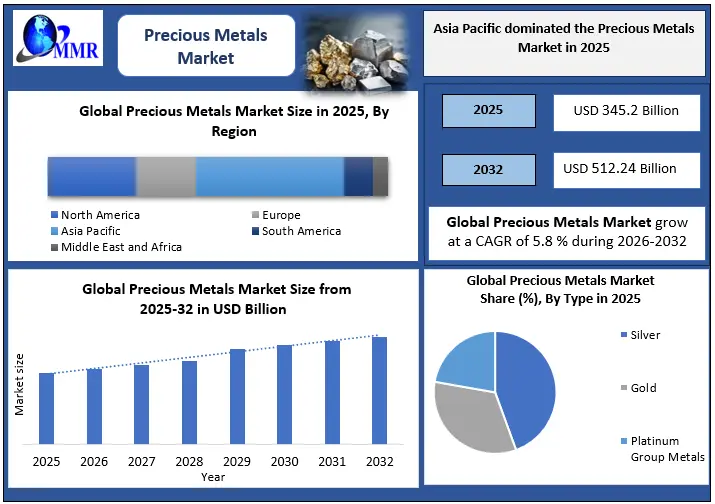
The Precious Metals Market Size was valued at USD 345.2 Billion in 2025, and the total revenue is expected to grow at a CAGR of 5.8 % from 2026 to 2032, reaching USD 512.24 Billion by 2032
Global Precious Metals Market Overview
The global precious metals market in 2025 is driven by record gold prices above USD 2,300 per ounce, strong central bank accumulation exceeding 1,050 metric tons, and rising demand for safe-haven assets amid geopolitical uncertainty and inflation concerns. Gold remains the dominant segment due to its role in reserve diversification, wealth preservation, and portfolio hedging. Meanwhile, silver demand continues to surge, with over 60% tied to solar PV panels, electric vehicles (EVs), semiconductors, and electronics, creating a structural supply deficit.
Mine production remains constrained by declining ore grades, higher ESG compliance costs, and limited new project development. Platinum and palladium markets remain tight due to autocatalyst demand and supply concentration risks. Growing ETF inflows, renewable energy expansion, digital gold tokenization, and modernization of clearing and settlement systems are further accelerating global precious metals market growth through 2032.
To know about the Research Methodology :- Request Free Sample Report
Precious Metals Market 2026 –Highlights
1. Central Bank Buying Remains Strong: Over 1,037 MT of gold purchased in 2025, with continued reserve diversification expected in 2026.
2. Record Silver Industrial Demand: Silver usage projected at 650M oz in 2026, driven by solar PV, EVs, and AI electronics.
3. Persistent Supply Deficits: Silver marks its fifth consecutive deficit (~67M oz), tightening physical availability.
4. ETF & Digital Inflows Surge: U.S. gold ETFs added $15B YTD, while tokenized gold AUM crossed $6.1B (+360% YoY).
5. Mine Supply Constraints: Gold output remains flat near 3,644 MT; silver production limited by byproduct dependency (70%).
6. Asia-Pacific Leads Demand: Region holds 45% market share, with strong imports and ETF inflows.
7. Bullish Price Outlook: Gold targets $5,000+, silver poised for ratio-driven outperformance.
8. Tokenization Expansion: Blockchain-based bullion trading unlocks 24/7 liquidity and fractional access.
9. ESG & Recycling Growth: European refiners scale sustainable sourcing and green vaulting.
10. Market Risks Persist: Fed policy shifts, export controls, and post-rally corrections add volatility.
Precious Metals Market Dynamics
Driver – Safe-Haven Demand & Strategic Reserve Diversification
Precious metals continue to serve as a hedge against inflation, geopolitical uncertainty, and currency volatility. In 2025, central banks intensified diversification strategies away from U.S. dollar-denominated reserves, with major accumulation by China, India, Turkey, and Middle Eastern economies.
Institutional investment demand through ETFs and sovereign allocations rose approximately 8% year-over-year, reinforcing price floors above USD 2,200/oz for gold. Retail demand for physical bullion and high-purity coins remained resilient across Asia and North America.
Silver benefits from dual demand streams: safe-haven investment flows and industrial growth. Solar installations exceeded 400 GW globally in 2025, significantly increasing silver intensity per panel. Meanwhile, hydrogen fuel cell advancements are driving platinum demand growth of approximately 12%.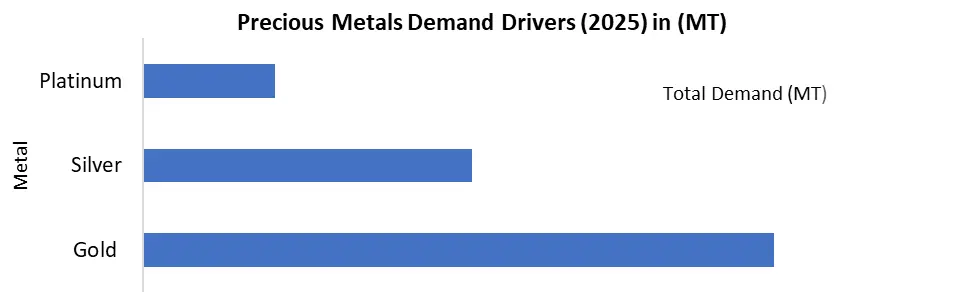 Market Restraint – Structural Supply Deficits & Low Elasticity in the Precious Metals Market
The global precious metals market 2025 faces a critical structural restraint driven by persistent supply deficits and low supply elasticity. Demand from industrial applications, investment inflows, jewelry consumption, and central bank accumulation continues to exceed mine production and recycling output. However, precious metals supply cannot respond quickly to price surges due to long mine development cycles (5–15 years), high capital expenditure requirements (USD 1–2 billion per project), geological limitations, and strict ESG regulations.
For instance, silver recorded a 95-million-ounce deficit in 2025, marking the fifth consecutive year of shortage, while platinum posted a 692,000-ounce deficit. Additionally, nearly 70% of silver production is byproduct-based, limiting responsiveness to silver price increases. As inventories decline, physical premiums rise, volatility intensifies, and industrial procurement becomes constrained ultimately capping sustainable long-term market expansion despite strong global demand growth.
Key Limiting Factors:
• Chronic supply-demand imbalance
• Low mine supply elasticity
• Byproduct dependency (silver 70%)
• High capex & regulatory delays
• Rising price volatility and inventory drawdowns
Market Opportunity – Tokenization & Clearing Modernization Transforming the Precious Metals Market
Tokenization and clearing modernization are creating high-margin, scalable growth opportunities in the global precious metals market 2026, by expanding liquidity, lowering entry barriers, and attracting new capital pools. Blockchain-backed gold and silver tokens (1 token = 1g vaulted metal) enable fractional ownership, 24/7 trading, and T+0 settlement—compared to legacy T+2/T+3 clearing cycles. This dramatically widens participation beyond banks and HNWIs to retail, DeFi, and cross-border investors.
By early 2026, tokenized commodities reached USD 6.1 billion (+360% YoY), with gold accounting for 95% share. Tokenized gold AUM rose from USD 4B (2025) to USD 6.1B supported by USD 2B YTD inflows amid gold prices above USD 4,500/oz. Trading volumes surged 900% year-on-year.
Growth Catalysts:
• Fractional access from $10 exposure
• 50–80% clearing cost reduction via blockchain rails
• Atomic settlement & reduced counterparty risk
• Institutional rotation into digital bullion
• Regulatory support (MiCA, GENIUS Act)
The market is projected to exceed USD 20B+ in tokenized metals by 2030, unlocking trillion-dollar retail potential.
Precious Metals Market: Segment Analysis
Based On Type: Precious Metals Market is segmented into Silver, Gold and Platinum Group Metals. The gold Segment dominated the market in year 2025. Due to its dual role as a safe-haven asset and a strategic reserve instrument. Global gold demand exceeded 4,800 metric tons, supported by record central bank purchases of over 1,000 MT and strong ETF inflows amid geopolitical tensions and inflation concerns.
Unlike silver and platinum group metals (PGMs), gold benefits from deep liquidity, large above-ground reserves, and strong retail and institutional participation. Jewelry demand in Asia and rising tokenized gold products further expanded access. Additionally, gold’s lower industrial dependency compared to silver and PGMs reduced cyclical volatility, strengthening its market leadership position.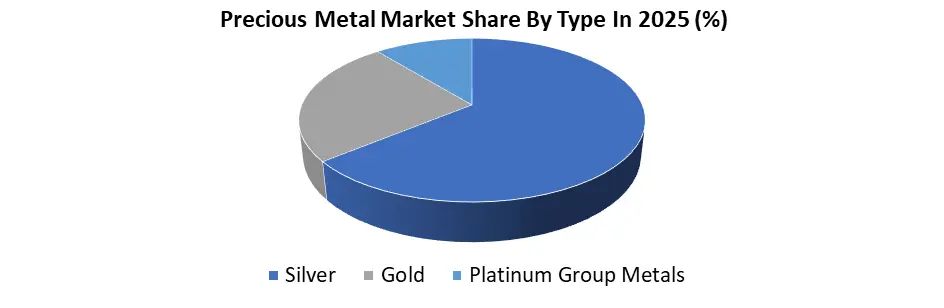
Precious Metals Market: Export–Import Trade Analysis
Global trade flows are highly concentrated in refining hubs and consumption centers.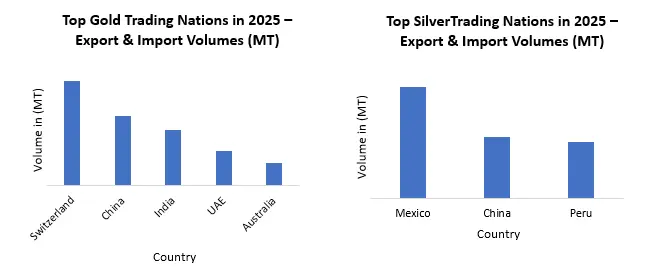 In 2025, global gold trade remains concentrated, with Switzerland leading exports at 1,500 MT, while China (1,000+ MT) and India (800 MT) dominate imports. The UAE strengthens its role as a major re-export hub. In silver, Mexico leads exports (6,300 MT), followed by China and Peru, while the U.S. and India drive imports. Jewelry trade (HS 7113) is led by Italy ($15.9B), with strong demand from Hong Kong, the U.S., and the Middle East, reinforcing Asia–Dubai trade corridors.
Precious Metals Market: Competitive Landscape
The global precious metals market is driven by integrated mining leaders, specialized PGM producers, and refining giants focused on operational efficiency, ESG compliance, and portfolio optimization. Newmont Corporation leads global gold production at nearly 6 million ounces annually, strengthening cost discipline and asset rationalization strategies. Barrick Gold Corporation prioritizes geographic diversification and high-margin projects to enhance free cash flow. Anglo American Platinum dominates platinum group metals (PGMs) and is expanding into hydrogen economy applications to capture clean-energy demand. Nornickel, the world’s largest palladium producer, is diversifying into battery metals, while Polyus leverages high-grade reserves and Arctic expansion to maintain global cost leadership and competitive advantage.
Key Companies & Strategies
• Newmont Corporation – World’s largest gold miner, producing ~6 million ounces annually, with reserves exceeding 90 million ounces. Focuses on portfolio optimization and lowering all-in sustaining costs (AISC ~$1,400/oz).
• Barrick Gold Corporation – Produces ~4 million ounces per year; emphasizes geographic diversification across 18 countries and targets $500M+ annual efficiency gains.
• Anglo American Platinum – Controls ~40% of global platinum supply; investing in hydrogen fuel cell and green mobility applications.
• Nornickel – Supplies ~40% of global palladium output; expanding battery metals capacity.
• Polyus – Produces ~2.8 million ounces annually; leverages high-grade Siberian reserves to maintain industry-low-cost leadership.
Regional Analysis – Global Precious Metals Market 2026
Asia-Pacific dominated the global precious metals market with nearly 45% demand share in year 2025, driven by jewelry consumption, central bank buying, industrial expansion, and rising digital gold adoption. Strong refinery ecosystems, policy reforms, and ETF inflows further reinforce regional liquidity and price discovery. Meanwhile, North America and Europe lead in financialized bullion markets and refining infrastructure, while the Middle East and Africa remain critical supply and trading hubs.
Key Regional Insights
• Asia-Pacific: China produced ~370 MT gold (12% global share) and imported 1,037 MT in 2025 for reserves and jewelry; India consumed 747 MT, supported by duty cuts and $2B ETF inflows (2026 YTD).
• North America: U.S. gold ETFs hold 3,100 MT ($250B AUM); Canada mined 200 MT gold in 2025.
• Europe: Switzerland refined 2,500 MT (70% global gold flows); Germany drives platinum demand for EV catalysts.
• Middle East & Africa: UAE traded $50B bullion; South Africa supplied 4.2M oz platinum (70% global share).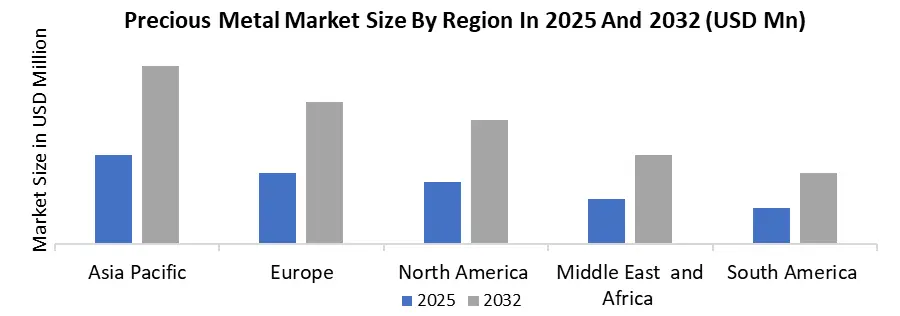
Precious Metals Market Scope: Inquire before buying
| Precious Metals Market | |||
|---|---|---|---|
| Report Coverage | Details | ||
| Base Year: | 2025 | Forecast Period: | 2026-2032 |
| Historical Data: | 2020 to 2025 | Market Size in 2025: | USD 345.2 Bn. |
| Forecast Period 2026 to 2032 CAGR: | 5.8% | Market Size in 2032: | USD 512.24 Bn. |
| Segments Covered: | by Type | Silver Gold Platinum Group Metals |
|
| by Application | Jewellery Investments Semiconductors Dentistry Computer parts Cutlery Photography Others |
||
| by End User | Electronics Medical Automotive Aerospace Oil and gas Others |
||
Precious Metals Market Key Players:
1. Newmont Corporation
2. AngloGold Ashanti Limited
3. Barrick Gold Corporation
4. Gold Fields Limited
5. Agnico Eagle Mines Limited
6. Pan American Silver Corp.
7. Fresnillo
8. Wheaton Precious Metals
9. Zijin Mining Group Co., Ltd.
10. Kinross Gold Corporation
11. Nornickel
12. Freeport-McMoRan
13. Anglo American plc
14. Harmony Gold Mining Co. Ltd
15. PJSC Polyus
16. Rio Tinto
17. Impala Platinum Holdings Ltd
18. Yamana Gold
19. Hecla Mining Company
20. Coeur Mining, Inc.
21. Eldorado Gold Corp
Frequently Asked Question
1. What are the growth drivers for the Precious Metals Market?
Answer: Rising inflationary pressures, increasing geopolitical uncertainties, strong investment demand for safe-haven assets, expanding industrial applications in electronics and renewable energy, and growing central bank gold reserves are key growth drivers of the Precious Metals Market.
2. What are the major restraints for the Precious Metals Market growth?
Answer: High price volatility, regulatory and environmental compliance costs, mining operational challenges, geopolitical risks in key producing regions, and substitution risks in industrial applications may restrain market growth.
3. Which region is expected to lead the global Precious Metals Market during the forecast period?
Answer: Asia-Pacific is expected to lead the global Precious Metals Market due to strong jewelry demand in China and India, expanding industrial usage, and increasing investment consumption, while North America remains strong in investment-driven demand.
4. What is the projected market size and growth rate of the Precious Metals Market?
Answer: The Precious Metals Market was valued at USD 345.2 Billion in 2025 and is projected to grow at a CAGR of 5.8 % reaching around USD 512.24 Billion by 2032, driven by investment and industrial demand expansion.