LNG Market by Application, Type and Region - Global Market Size Estimation, Industry-Wide Analysis, Competitive Landscape Assessment & Long-Term Forecast to 2034

5.1%
CAGR (2026-2034)
486.28 USD Mn.
Forecast Market Size
301
Report Pages
120
Market Tables

Overview

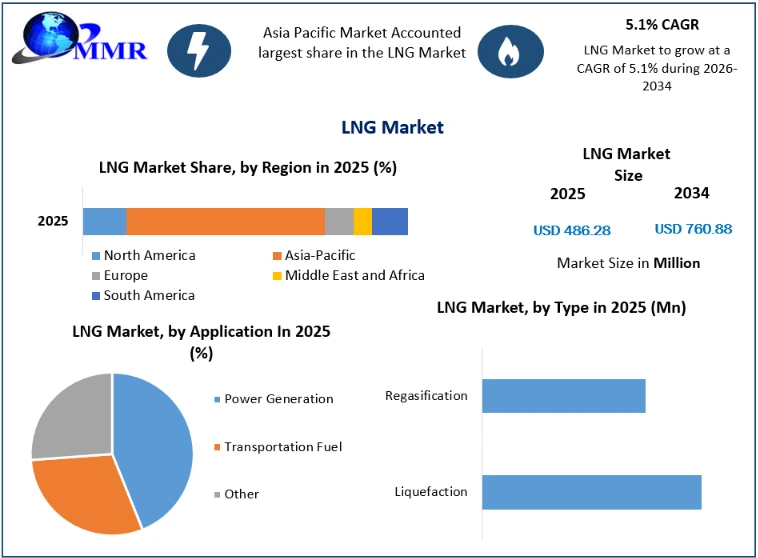
The LNG Market size was valued at USD 486.28 Million in 2025 and the total LNG revenue is expected to grow at a CAGR of 5.1% from 2026 to 2034, reaching nearly USD 760.88 Million.

LNG Market Overview:

LNG (Liquefied natural gas) is a kind of natural gas that is cooled to liquid form for non-pressurized storage or transportation purposes. The gas shrunk down 600 times after the cooling process which gets it easier to store and transport. One of the benefits of liquefying the gas is LNG does not ignite when it is in liquid form. After reaching to destination, LNG turned back into the gas form at regasification plants and further supply it to residential, commercial, and industrial use or to generate electricity. LNG is a transparent, non-hazardous, odorless, and non-corrosive gas that is cost-competitive and provides clean transport fuel.

LNG Market Growth and Share AnalysisLNG Market Growth
To know about the Research Methodology :- Request Free Sample Report

LNG Market Dynamics:

In 2025, a new Net Zero-emission announcement was issued globally. Natural gas helps reduce overall emissions, whether it works with renewable energies to enable reliable energy selection or power difficult sectors. 65% of natural gas consumption growth over the next 20 years is expected to come from the non-energy sector. LNG is expected to be the fastest-growing source of natural gas.

LNG demand was still rising, with trade reaching 360 million tonnes in 2025. The industry quickly responded to changing market conditions by diverting loads to a shifting center of demand and adjusting supplies. Prices remained volatile, hitting record lows before hitting record highs again in early 2025. The pandemic economic crisis has stalled new investment decisions for LNG supply.

LNG demand is anticipated to grow gradually with a supply-demand gap expected to develop by 2025. An increasing number of buyers and sellers pushed the industry at evolution to offer a wider choice of commercial structures to meet shifting needs. With the bigger picture of NZE targets globally, the LNG industry needs to further explore to offer clean energy supply globally.

Massive growth in inter-continental pipeline infrastructure projects pushed by favored government regulation has increased the demand for Natural gas from mainstream industries and oil price instability is the major factor driving the global LNG market. The LNG market is expected to see growth over the forecasted period by providing relevant infrastructure to developing countries.

LNG helps reduce industrial emission from coal to gas switching 36% CO2 emission saving through utilization of natural gas, hydrogen, and LNG for direct uses. The iron and steel sector benefits the most from switching coal to gas.

LNG Market Segment Analysis:

By Application, Power Generation is dominating segment in the global LNG market and held 47.10% of the market share, and is expected to grow at a CAGR of 4.7%. Currently, Power plants are shifting to liquefied natural gas to increase delivery and cost competitiveness and reduce pollution. Growth in usage of LNG into transportation fuel supported by Europe and China is expected to push the demand further. LNG helps reduce industrial emission from coal to gas switching 36% CO2 emission saving through utilization of natural gas, hydrogen, and LNG for direct uses. The iron and steel sector benefited the most from switching coal to gas.

LNG Market Regional Insights:

Asia Pacific is dominating region in the global LNG market and held the highest share 41.3%

The primary factors driving the market growth are mainly population increase, adequate resource availability, high demand for energy, and easy affordability provided by government subsidizations on LNG use. Nuclear power plant formations in Eastern Asia are expected to influence South Korea's and Japan's energy demand. India is expected to remain a desirable market for exporters and producers. Asia Pacific gas demand is growing steadily and Over 30% of the new LNG supply capacity is currently under construction and is expected to be functioning by 2025. Currently, global gas demand stood at 3900 billion cubic meters with Asia Pacific growing at a CAGR of 3%.

Australia, with its major projects in Queensland and Western Australia, is a global exporter of liquefied natural gas. In addition, the sharp drop in LNG prices has put some of these projects under planning pressure and significant costs, which poses a challenge for operators and developers.

The European Union is increasingly dependent on gas imports and is pursuing external markets for LNG and pipeline infrastructure with US providers. One of the Russian companies uses pipeline infrastructure and other means of transportation to export fuel to other countries from remote locations which makes it an exporter and major participants in the LNG market.

Global LNG imports increased by more than 12%. China's LNG imports increased by 15%. In several other countries, such as Mexico, Egypt, and China, significant restructuring has been achieved by increasing private sector involvement in supply, marketing, and transportation chains and becoming familiar with third-party access to LNG infrastructure.

The objective of the report is to present a comprehensive analysis of the Global LNG market to the stakeholders in the industry. The past and current status of the industry with the forecasted market size and trends are presented in the report with the analysis of complicated data in simple language. The report covers all the aspects of the industry with a dedicated study of key players that include market leaders, followers, and new entrants.

PORTER, PESTEL analysis with the potential impact of micro-economic factors of the market have been presented in the report. External as well as internal factors that are supposed to affect the business positively or negatively have been analyzed, which will give a clear futuristic view of the industry to the decision-makers.

The report also helps in understanding the Global LNG market dynamics, structure by analyzing the market segments and projecting the Global LNG market size. Clear representation of competitive analysis of key players by product, price, financial position, product portfolio, growth strategies, and regional presence in the Global LNG market make the report investor’s guide.

LNG Market Recent Development

Date Company Development Impact
11 November 2025 Tokyo Gas Signed a major 20-year LNG Sales and Purchase Agreement with Venture Global for long-term supply. Secures stable long-term clean energy procurement to support regional energy security and decarbonization goals.
12 November 2025 Mitsui Finalized a long-term 20-year LNG Sales and Purchase Agreement to import liquefied natural gas. Enhances import portfolio diversification and ensures reliable supply volumes for Asian industrial markets.
16 March 2026 Venture Global Announced the Final Investment Decision (FID) and financial close for Phase 2 of the CP2 LNG project. Accelerates large-scale infrastructure expansion, adding substantial liquefaction capacity to the global market.
10 February 2026 ConocoPhillips Entered into a strategic 20-year LNG Sales and Purchase Agreement with Venture Global. Expands global commercial reach and strengthens portfolio flexibility amid fluctuating market conditions.
11 February 2026 Shell PLC Published its comprehensive annual LNG Outlook 2026 charting global trade data and supply-demand trends. Provides vital market transparency, showing global trade reaching 437 million tonnes and guiding future investments.
03 November 2026 TotalEnergies Signed a new multi-year 5-year LNG supply deal with ADNOC Gas. Bolsters European and international gas availability, reinforcing supply chain resilience during regional shifts.

LNG Market Scope: Inquire before buying

Global LNG Market
Report Coverage Details
Base Year: 2025 Forecast Period: 2026-2034
Historical Data: 2020 to 2025 Market Size in 2025: USD 486.28Mn.
Forecast Period 2026 to 2034 CAGR: 5.1% Market Size in 2034: USD 760.88 Mn.
Segments Covered: by Application Power Generation
Transportation Fuel
Other
by Type Liquefaction
Regasification

LNG Market, by Region

North America (United States, Canada and Mexico)
Europe (UK, France, Germany, Italy, Spain, Sweden, Austria, Turkey, Russia and Rest of Europe)
Asia Pacific (China, India, Japan, South Korea, Australia, ASEAN and Rest of APAC)
Middle East and Africa (South Africa, GCC, Egypt, Nigeria and Rest of ME&A)
South America (Brazil, Argentina, Columbia and Rest of South America)

LNG Market, Key Players are

1. Saudi Aramco
2. Sinopec
3. ADNOC
4. CNPC
5. Exxon Mobil
6. Reliance Industries
7. KNPC
8. Phillips66
9. Bharat Petroleum Corporation Ltd.
10. Pemex
11. Total Corp.
12. Qatar Petroleum
13. Equinor
14. BP Corp.
15. Gazprom Corp.
16. Chevron
17. ConocoPhillips Company
18. SHV Energy (NL)
19. Valero Energy
20. UGI Corporation
21. Royal Dutch Shell PLC

Frequently Asked Questions:

1. Which region has the largest share in Global LNG Market?
Ans: Asia-Pacific region holds the highest share in 2025.

2. What was the Global LNG Market size in 2025?
Ans: The Global LNG Market size was USD 486.28 Million in 2025.

3. What is scope of the Global LNG market report?
Ans: Global LNG Market report helps with the PESTEL, PORTER,  Recommendations for Investors & Leaders, and market estimation of the forecast period.

4. Who are the key players in Global LNG market?
Ans: The important key players in the Global LNG Market are – Saudi Aramco, Sinopec, ADNOC, CNPC, Exxon Mobil, Reliance Industries, KNPC, Phillips66, Bharat Petroleum Corporation Ltd., Pemex, Total Corp., Qatar Petroleum, Equinor.

5. What is the study period of this market?
Ans: The Global LNG Market is studied from 2020 to 2034.

Table of Contents

1. LNG Market Introduction 1.1. Study Assumption and Market Definition 1.2. Scope of the Study 1.3. Executive Summary 2. Global LNG Market: Competitive Landscape 2.1. MMR Competition Matrix 2.2. Competitive Landscape 2.3. Key Players Benchmarking 2.3.1. Company Name 2.3.2. Business Segment 2.3.3. End-user Segment 2.3.4. Revenue (2025) 2.3.5. Company Locations 2.4. Leading LNG Market Companies, by market capitalization 2.5. Market Structure 2.5.1. Market Leaders 2.5.2. Market Followers 2.5.3. Emerging Players 2.6. Mergers and Acquisitions Details 3. LNG Market: Dynamics 3.1. LNG Market Trends by Region 3.1.1. North America LNG Market Trends 3.1.2. Europe LNG Market Trends 3.1.3. Asia Pacific LNG Market Trends 3.1.4. Middle East and Africa LNG Market Trends 3.1.5. South America LNG Market Trends 3.2. LNG Market Dynamics by Region 3.2.1. North America 3.2.1.1. North America LNG Market Drivers 3.2.1.2. North America LNG Market Restraints 3.2.1.3. North America LNG Market Opportunities 3.2.1.4. North America LNG Market Challenges 3.2.2. Europe 3.2.2.1. Europe LNG Market Drivers 3.2.2.2. Europe LNG Market Restraints 3.2.2.3. Europe LNG Market Opportunities 3.2.2.4. Europe LNG Market Challenges 3.2.3. Asia Pacific 3.2.3.1. Asia Pacific LNG Market Drivers 3.2.3.2. Asia Pacific LNG Market Restraints 3.2.3.3. Asia Pacific LNG Market Opportunities 3.2.3.4. Asia Pacific LNG Market Challenges 3.2.4. Middle East and Africa 3.2.4.1. Middle East and Africa LNG Market Drivers 3.2.4.2. Middle East and Africa LNG Market Restraints 3.2.4.3. Middle East and Africa LNG Market Opportunities 3.2.4.4. Middle East and Africa LNG Market Challenges 3.2.5. South America 3.2.5.1. South America LNG Market Drivers 3.2.5.2. South America LNG Market Restraints 3.2.5.3. South America LNG Market Opportunities 3.2.5.4. South America LNG Market Challenges 3.3. PORTER's Five Forces Analysis 3.4. PESTLE Analysis 3.5. Technology Roadmap 3.6. Regulatory Landscape by Region 3.6.1. North America 3.6.2. Europe 3.6.3. Asia Pacific 3.6.4. Middle East and Africa 3.6.5. South America 3.7. Key Opinion Leader Analysis in the LNG Market 3.8. Analysis of Government Schemes and Initiatives For Global Industry 3.9. LNG Market Trade Analysis 3.10. The Global Pandemic Impact on LNG Market 4. LNG Market: Global Market Size and Forecast by Segmentation (in USD Million) 2025-2034 4.1. LNG Market Size and Forecast, by Application (2025-2034) 4.1.1. Power Generation 4.1.2. Transportation Fuel 4.1.3. Other 4.2. LNG Market Size and Forecast, by Type (2025-2034) 4.2.1. Liquefaction 4.2.2. Regasification 4.3. LNG Market Size and Forecast, by Region (2025-2034) 4.3.1. North America 4.3.2. Europe 4.3.3. Asia Pacific 4.3.4. Middle East and Africa 4.3.5. South America 5. North America LNG Market Size and Forecast by Segmentation (in USD Million) 2025-2034 5.1. North America LNG Market Size and Forecast, by Application (2025-2034) 5.1.1. Power Generation 5.1.2. Transportation Fuel 5.1.3. Other 5.2. North America LNG Market Size and Forecast, by Type (2025-2034) 5.2.1. Liquefaction 5.2.2. Regasification 5.3. North America LNG Market Size and Forecast, by Country (2025-2034) 5.3.1. United States 5.3.1.1. United States LNG Market Size and Forecast, by Application (2025-2034) 5.3.1.1.1. Power Generation 5.3.1.1.2. Transportation Fuel 5.3.1.1.3. Other 5.3.1.2. United States LNG Market Size and Forecast, by Type (2025-2034) 5.3.1.2.1. Liquefaction 5.3.1.2.2. Regasification 5.3.2. Canada 5.3.2.1. Canada LNG Market Size and Forecast, by Application (2025-2034) 5.3.2.1.1. Power Generation 5.3.2.1.2. Transportation Fuel 5.3.2.1.3. Other 5.3.2.2. Canada LNG Market Size and Forecast, by Type (2025-2034) 5.3.2.2.1. Liquefaction 5.3.2.2.2. Regasification 5.3.3. Mexico 5.3.3.1. Mexico LNG Market Size and Forecast, by Application (2025-2034) 5.3.3.1.1. Power Generation 5.3.3.1.2. Transportation Fuel 5.3.3.1.3. Other 5.3.3.2. Mexico LNG Market Size and Forecast, by Type (2025-2034) 5.3.3.2.1. Liquefaction 5.3.3.2.2. Regasification 6. Europe LNG Market Size and Forecast by Segmentation (in USD Million) 2025-2034 6.1. Europe LNG Market Size and Forecast, by Application (2025-2034) 6.1.1. Power Generation 6.1.2. Transportation Fuel 6.1.3. Other 6.2. Europe LNG Market Size and Forecast, by Type (2025-2034) 6.2.1. Liquefaction 6.2.2. Regasification 6.3. Europe LNG Market Size and Forecast, by Country (2025-2034) 6.3.1. United Kingdom 6.3.1.1. United Kingdom LNG Market Size and Forecast, by Application (2025-2034) 6.3.1.1.1. Power Generation 6.3.1.1.2. Transportation Fuel 6.3.1.1.3. Other 6.3.1.2. United Kingdom LNG Market Size and Forecast, by Type (2025-2034) 6.3.1.2.1. Liquefaction 6.3.1.2.2. Regasification 6.3.2. France 6.3.2.1. France LNG Market Size and Forecast, by Application (2025-2034) 6.3.2.1.1. Power Generation 6.3.2.1.2. Transportation Fuel 6.3.2.1.3. Other 6.3.2.2. France LNG Market Size and Forecast, by Type (2025-2034) 6.3.2.2.1. Liquefaction 6.3.2.2.2. Regasification 6.3.3. Germany 6.3.3.1. Germany LNG Market Size and Forecast, by Application (2025-2034) 6.3.3.1.1. Power Generation 6.3.3.1.2. Transportation Fuel 6.3.3.1.3. Other 6.3.3.2. Germany LNG Market Size and Forecast, by Type (2025-2034) 6.3.3.2.1. Liquefaction 6.3.3.2.2. Regasification 6.3.4. Italy 6.3.4.1. Italy LNG Market Size and Forecast, by Application (2025-2034) 6.3.4.1.1. Power Generation 6.3.4.1.2. Transportation Fuel 6.3.4.1.3. Other 6.3.4.2. Italy LNG Market Size and Forecast, by Type (2025-2034) 6.3.4.2.1. Liquefaction 6.3.4.2.2. Regasification 6.3.5. Spain 6.3.5.1. Spain LNG Market Size and Forecast, by Application (2025-2034) 6.3.5.1.1. Power Generation 6.3.5.1.2. Transportation Fuel 6.3.5.1.3. Other 6.3.5.2. Spain LNG Market Size and Forecast, by Type (2025-2034) 6.3.5.2.1. Liquefaction 6.3.5.2.2. Regasification 6.3.6. Sweden 6.3.6.1. Sweden LNG Market Size and Forecast, by Application (2025-2034) 6.3.6.1.1. Power Generation 6.3.6.1.2. Transportation Fuel 6.3.6.1.3. Other 6.3.6.2. Sweden LNG Market Size and Forecast, by Type (2025-2034) 6.3.6.2.1. Liquefaction 6.3.6.2.2. Regasification 6.3.7. Austria 6.3.7.1. Austria LNG Market Size and Forecast, by Application (2025-2034) 6.3.7.1.1. Power Generation 6.3.7.1.2. Transportation Fuel 6.3.7.1.3. Other 6.3.7.2. Austria LNG Market Size and Forecast, by Type (2025-2034) 6.3.7.2.1. Liquefaction 6.3.7.2.2. Regasification 6.3.8. Rest of Europe 6.3.8.1. Rest of Europe LNG Market Size and Forecast, by Application (2025-2034) 6.3.8.1.1. Power Generation 6.3.8.1.2. Transportation Fuel 6.3.8.1.3. Other 6.3.8.2. Rest of Europe LNG Market Size and Forecast, by Type (2025-2034) 6.3.8.2.1. Liquefaction 6.3.8.2.2. Regasification 7. Asia Pacific LNG Market Size and Forecast by Segmentation (in USD Million) 2025-2034 7.1. Asia Pacific LNG Market Size and Forecast, by Application (2025-2034) 7.1.1. Power Generation 7.1.2. Transportation Fuel 7.1.3. Other 7.2. Asia Pacific LNG Market Size and Forecast, by Type (2025-2034) 7.2.1. Liquefaction 7.2.2. Regasification 7.3. Asia Pacific LNG Market Size and Forecast, by Country (2025-2034) 7.3.1. China 7.3.1.1. China LNG Market Size and Forecast, by Application (2025-2034) 7.3.1.1.1. Power Generation 7.3.1.1.2. Transportation Fuel 7.3.1.1.3. Other 7.3.1.2. China LNG Market Size and Forecast, by Type (2025-2034) 7.3.1.2.1. Liquefaction 7.3.1.2.2. Regasification 7.3.2. S Korea 7.3.2.1. S Korea LNG Market Size and Forecast, by Application (2025-2034) 7.3.2.1.1. Power Generation 7.3.2.1.2. Transportation Fuel 7.3.2.1.3. Other 7.3.2.2. S Korea LNG Market Size and Forecast, by Type (2025-2034) 7.3.2.2.1. Liquefaction 7.3.2.2.2. Regasification 7.3.3. Japan 7.3.3.1. Japan LNG Market Size and Forecast, by Application (2025-2034) 7.3.3.1.1. Power Generation 7.3.3.1.2. Transportation Fuel 7.3.3.1.3. Other 7.3.3.2. Japan LNG Market Size and Forecast, by Type (2025-2034) 7.3.3.2.1. Liquefaction 7.3.3.2.2. Regasification 7.3.4. India 7.3.4.1. India LNG Market Size and Forecast, by Application (2025-2034) 7.3.4.1.1. Power Generation 7.3.4.1.2. Transportation Fuel 7.3.4.1.3. Other 7.3.4.2. India LNG Market Size and Forecast, by Type (2025-2034) 7.3.4.2.1. Liquefaction 7.3.4.2.2. Regasification 7.3.5. Australia 7.3.5.1. Australia LNG Market Size and Forecast, by Application (2025-2034) 7.3.5.1.1. Power Generation 7.3.5.1.2. Transportation Fuel 7.3.5.1.3. Other 7.3.5.2. Australia LNG Market Size and Forecast, by Type (2025-2034) 7.3.5.2.1. Liquefaction 7.3.5.2.2. Regasification 7.3.6. Indonesia 7.3.6.1. Indonesia LNG Market Size and Forecast, by Application (2025-2034) 7.3.6.1.1. Power Generation 7.3.6.1.2. Transportation Fuel 7.3.6.1.3. Other 7.3.6.2. Indonesia LNG Market Size and Forecast, by Type (2025-2034) 7.3.6.2.1. Liquefaction 7.3.6.2.2. Regasification 7.3.7. Malaysia 7.3.7.1. Malaysia LNG Market Size and Forecast, by Application (2025-2034) 7.3.7.1.1. Power Generation 7.3.7.1.2. Transportation Fuel 7.3.7.1.3. Other 7.3.7.2. Malaysia LNG Market Size and Forecast, by Type (2025-2034) 7.3.7.2.1. Liquefaction 7.3.7.2.2. Regasification 7.3.8. Vietnam 7.3.8.1. Vietnam LNG Market Size and Forecast, by Application (2025-2034) 7.3.8.1.1. Power Generation 7.3.8.1.2. Transportation Fuel 7.3.8.1.3. Other 7.3.8.2. Vietnam LNG Market Size and Forecast, by Type (2025-2034) 7.3.8.2.1. Liquefaction 7.3.8.2.2. Regasification 7.3.9. Taiwan 7.3.9.1. Taiwan LNG Market Size and Forecast, by Application (2025-2034) 7.3.9.1.1. Power Generation 7.3.9.1.2. Transportation Fuel 7.3.9.1.3. Other 7.3.9.2. Taiwan LNG Market Size and Forecast, by Type (2025-2034) 7.3.9.2.1. Liquefaction 7.3.9.2.2. Regasification 7.3.10. Rest of Asia Pacific 7.3.10.1. Rest of Asia Pacific LNG Market Size and Forecast, by Application (2025-2034) 7.3.10.1.1. Power Generation 7.3.10.1.2. Transportation Fuel 7.3.10.1.3. Other 7.3.10.2. Rest of Asia Pacific LNG Market Size and Forecast, by Type (2025-2034) 7.3.10.2.1. Liquefaction 7.3.10.2.2. Regasification 8. Middle East and Africa LNG Market Size and Forecast by Segmentation (in USD Million) 2025-2034 8.1. Middle East and Africa LNG Market Size and Forecast, by Application (2025-2034) 8.1.1. Power Generation 8.1.2. Transportation Fuel 8.1.3. Other 8.2. Middle East and Africa LNG Market Size and Forecast, by Type (2025-2034) 8.2.1. Liquefaction 8.2.2. Regasification 8.3. Middle East and Africa LNG Market Size and Forecast, by Country (2025-2034) 8.3.1. South Africa 8.3.1.1. South Africa LNG Market Size and Forecast, by Application (2025-2034) 8.3.1.1.1. Power Generation 8.3.1.1.2. Transportation Fuel 8.3.1.1.3. Other 8.3.1.2. South Africa LNG Market Size and Forecast, by Type (2025-2034) 8.3.1.2.1. Liquefaction 8.3.1.2.2. Regasification 8.3.2. GCC 8.3.2.1. GCC LNG Market Size and Forecast, by Application (2025-2034) 8.3.2.1.1. Power Generation 8.3.2.1.2. Transportation Fuel 8.3.2.1.3. Other 8.3.2.2. GCC LNG Market Size and Forecast, by Type (2025-2034) 8.3.2.2.1. Liquefaction 8.3.2.2.2. Regasification 8.3.3. Nigeria 8.3.3.1. Nigeria LNG Market Size and Forecast, by Application (2025-2034) 8.3.3.1.1. Power Generation 8.3.3.1.2. Transportation Fuel 8.3.3.1.3. Other 8.3.3.2. Nigeria LNG Market Size and Forecast, by Type (2025-2034) 8.3.3.2.1. Liquefaction 8.3.3.2.2. Regasification 8.3.4. Rest of ME&A 8.3.4.1. Rest of ME&A LNG Market Size and Forecast, by Application (2025-2034) 8.3.4.1.1. Power Generation 8.3.4.1.2. Transportation Fuel 8.3.4.1.3. Other 8.3.4.2. Rest of ME&A LNG Market Size and Forecast, by Type (2025-2034) 8.3.4.2.1. Liquefaction 8.3.4.2.2. Regasification 9. South America LNG Market Size and Forecast by Segmentation (in USD Million) 2025-2034 9.1. South America LNG Market Size and Forecast, by Application (2025-2034) 9.1.1. Power Generation 9.1.2. Transportation Fuel 9.1.3. Other 9.2. South America LNG Market Size and Forecast, by Type (2025-2034) 9.2.1. Liquefaction 9.2.2. Regasification 9.3. South America LNG Market Size and Forecast, by Country (2025-2034) 9.3.1. Brazil 9.3.1.1. Brazil LNG Market Size and Forecast, by Application (2025-2034) 9.3.1.1.1. Power Generation 9.3.1.1.2. Transportation Fuel 9.3.1.1.3. Other 9.3.1.2. Brazil LNG Market Size and Forecast, by Type (2025-2034) 9.3.1.2.1. Liquefaction 9.3.1.2.2. Regasification 9.3.2. Argentina 9.3.2.1. Argentina LNG Market Size and Forecast, by Application (2025-2034) 9.3.2.1.1. Power Generation 9.3.2.1.2. Transportation Fuel 9.3.2.1.3. Other 9.3.2.2. Argentina LNG Market Size and Forecast, by Type (2025-2034) 9.3.2.2.1. Liquefaction 9.3.2.2.2. Regasification 9.3.3. Rest Of South America 9.3.3.1. Rest Of South America LNG Market Size and Forecast, by Application (2025-2034) 9.3.3.1.1. Power Generation 9.3.3.1.2. Transportation Fuel 9.3.3.1.3. Other 9.3.3.2. Rest Of South America LNG Market Size and Forecast, by Type (2025-2034) 9.3.3.2.1. Liquefaction 9.3.3.2.2. Regasification 10. Company Profile: Key Players 10.1. Saudi Aramco 10.1.1. Company Overview 10.1.2. Business Portfolio 10.1.3. Financial Overview 10.1.4. SWOT Analysis 10.1.5. Strategic Analysis 10.1.6. Scale of Operation (small, medium, and large) 10.1.7. Details on Partnership 10.1.8. Regulatory Accreditations and Certifications Received by Them 10.1.9. Awards Received by the Firm 10.1.10. Recent Developments 10.2. Sinopec 10.3. ADNOC 10.4. CNPC 10.5. Exxon Mobil 10.6. Reliance Industries 10.7. KNPC 10.8. Phillips66 10.9. Bharat Petroleum Corporation Ltd. 10.10. Pemex 10.11. Total Corp. 10.12. Qatar Petroleum 10.13. Equinor 10.14. BP Corp. 10.15. Gazprom Corp. 10.16. Chevron 10.17. ConocoPhillips Company 10.18. SHV Energy (NL) 10.19. Valero Energy 10.20. UGI Corporation 10.21. Royal Dutch Shell PLC 11. Key Findings 12. Industry Recommendations 13. LNG Market: Research Methodology 14. Terms and Glossary

Custom Market Research Services

We Will Customise The Research For You, In Case The Report Listed Above Does Not Meet With Your Requirements