
Electronic Recycling Market Size by Material Type, Source, End Use Industries and Region – Segment-Level Market Assessment, Growth Opportunity Analysis, Competitive Mapping & Forecast to 2030
Overview
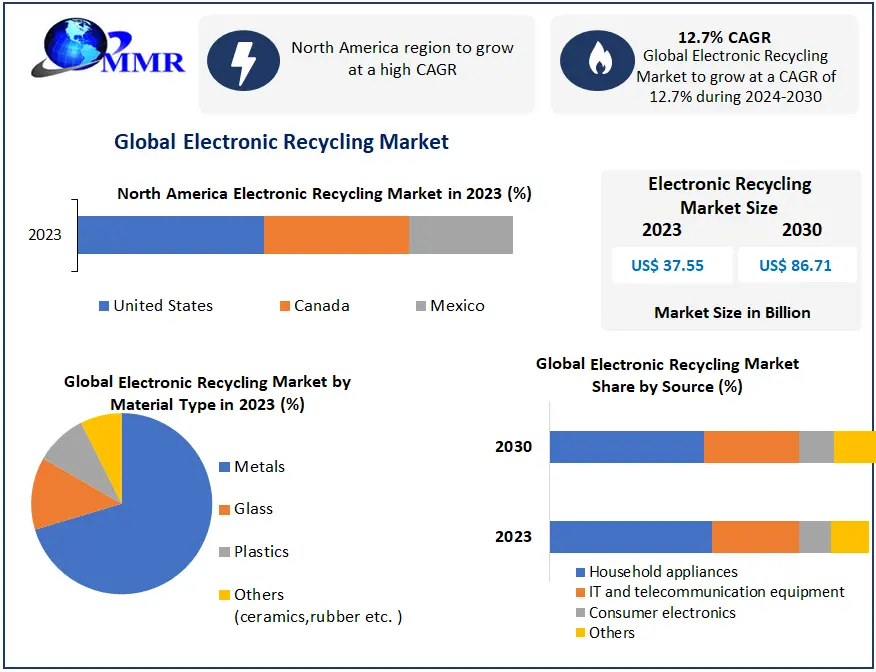
Global Electronic Recycling Market size was valued at USD 37.55 Bn in 2023 and is expected to reach USD 86.71 Bn by 2030, at a CAGR of 12.7 %.
Overview
Electronics, such as televisions, computers, and computer monitors, contain toxic substances, including lead, mercury, cadmium, lithium, brominated flame retardants, phosphorous coatings, and PVC plastics. When thrown away these devices release their toxics, posing a threat to human health and the environment. Because of the threat posed by these toxics, it is illegal to throw away cathode ray tubes and LCD screens in Maine. Electronics also contain high-quality plastics, copper, aluminum, and small amounts of silver, gold, and other precious metals. Mining and processing these materials are energy-intensive and environmentally detrimental. Recycling old devices prevents the release of toxic substances and ensures valuable materials are recovered. The electronic recycling market is propelled by increasing e-waste generation due to technological advancements.
 To know about the Research Methodology :- Request Free Sample Report
Stricter environmental regulations and a shift toward circular economy practices further drive demand. Corporate social responsibility initiatives and consumer awareness of environmental impact also contribute. Advancements in recycling technologies make material recovery more efficient and cost-effective. Additionally, emerging business models, such as refurbishment and resale of electronic devices, offer opportunities for waste reduction. These factors collectively stimulate growth in the electronic recycling industry.
Electronic Recycling Market Dynamics:
Environmental Awareness and Regulatory Compliance to Drive the Market Growth
As environmental concerns continue to gain prominence globally, there's a growing emphasis on sustainable practices and waste reduction. Electronic recycling plays a crucial role in mitigating the environmental impact of electronic waste (e-waste) by diverting harmful materials from landfills and promoting resource conservation through materials recovery and reuse. Moreover, stringent regulations imposed by governments and international bodies regarding e-waste management drive the demand for electronic recycling services. Compliance with these regulations compels businesses and individuals to responsibly dispose of their electronic devices, creating a steady stream of recyclable materials for the electronic recycling industry. The growing demand for recycled materials, such as precious metals, plastics, and rare earth elements, in various industries including electronics, automotive, and manufacturing, is fueling the expansion of the electronic recycling market.
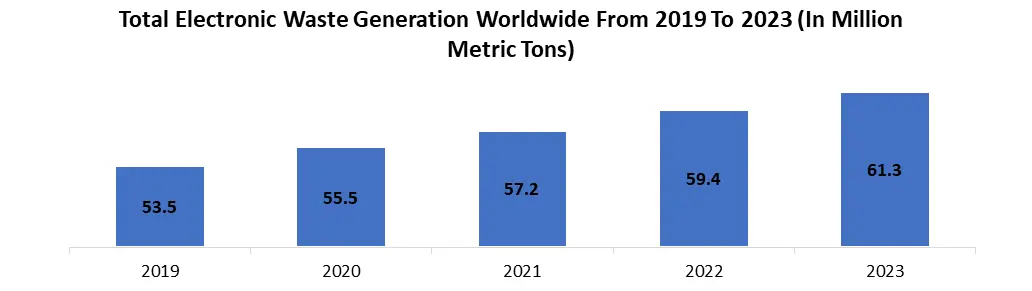
Electrical and Electronic Equipment (EEE) demand is rising due to factors like higher disposable incomes, urbanization, and industrialization, leading to a surge in electronic waste (e-waste). This trend is exacerbated by short product lifespans and constant upgrades promoted by brands, rendering older technology obsolete. E-waste, consisting of both recyclable materials and hazardous substances like lead and mercury, poses significant health and environmental risks. Despite the staggering volume of e-waste 57.4 million metric tonnes generated in 2021-22 only a small fraction is properly recycled. The global e-waste problem is exacerbated by inadequate legislation, with only 78 countries having regulations in place. Recycling rates vary widely, with Estonia, Norway, and Iceland leading in e-waste recycling. The market for e-waste recycling was valued at $49.88 billion in 2020, indicating both the scale of the problem and the potential economic opportunities in addressing it. Given the current trajectory, global e-waste generation is projected to nearly double by 2030, underscoring the urgent need for effective waste management solutions. As a result, the increasing volume of e-waste underscores the critical role of electronic recycling in addressing environmental concerns, meeting regulatory requirements, and capitalizing on economic opportunities, all of which drive growth in the electronic recycling market.
In 2023, Europeans (16.2 Kg) produced the most e-waste per person, followed by Oceania (16.1 Kg) and the Americas (13.3 Kg). African residents produce the least amount of e-waste per capita. China, the US, and India produce the most electronic waste. The table below shows the top 10 e-waste-producing countries in the world, in terms of the total volume produced (shown in KiloTons).
| Rank | Country | E-Waste Produced (Kt) | Recycling Rate |
| 1. | China | 10129 | 16% |
| 2. | USA | 6918 | 15% |
| 3. | India | 3230 | 1% |
| 4. | Japan | 2569 | 22% |
| 5. | Brazil | 2143 | 0% |
| 6. | Russia | 1631 | 6% |
| 7. | Indonesia | 1618 | N/A |
| 8. | Germany | 1607 | 52% |
| 9. | UK | 1598 | 57% |
| 10. | France | 1362 | 56% |
Technological Advancements and Innovation to Boost the Market Growth
Continuous technological advancements result in shorter product lifecycles and the rapid obsolescence of electronic devices, leading to an increase in e-waste generation. However, these advancements also drive innovation in electronic recycling processes and technologies. Innovations such as advanced sorting techniques, automated dismantling systems, and environmentally friendly recycling methods improve efficiency, increase recovery rates, and reduce costs within the electronic recycling industry. Additionally, emerging technologies like artificial intelligence and robotics are being integrated into electronic recycling facilities, enabling more precise sorting and disassembly of electronic components, further fueling Electronic Recycling Market growth.
In today’s fast-paced digital age, electronic devices have become integral to our lives. From smartphones to laptops and other gadgets, we rely on these devices for communication, entertainment, and productivity. However, the rapid advancement of technology has resulted in a staggering amount of electronic waste, also known as e-waste. Improper disposal of e-waste not only harms the environment but also poses significant health risks. As a result, there is an urgent need for innovative solutions to tackle the growing concern of e-waste.
Innovations in E-Waste Recycling Technology

Circular Economy Initiatives for Electronic Recycling
E-waste is a rapidly growing global issue, with vast amounts of electronic waste being generated annually. Only a small percentage of this waste is properly recycled, leading to environmental and health risks, particularly in developing countries. Electronic Recycling Market Challenges include inadequate recycling infrastructure, high costs, and low recycling rates. However, adopting circular economy business models presents an opportunity for companies to create value, lower environmental impact, and generate profitability. Shared economy models, products-as-a-service models, and product ownership models all contribute to more sustainable approaches to electronic waste management. Cross-industry partnerships and a holistic approach to value chain synchronization are essential for effectively implementing circular strategies and addressing the e-waste crisis. This factor is expected to create a lucrative opportunity for market growth.
The global electronics industry is rapidly expanding, with electronic waste becoming the fastest-growing waste stream. This waste, which contains valuable raw materials, is often discarded improperly, leading to environmental pollution and health hazards. Transitioning to a circular economy for electronics is crucial for addressing these challenges. Circular models involve using more recycled content in new products, extending product lifespans, and implementing responsible recycling practices. Companies, governments, and civil society organizations must collaborate to incentivize sustainable product design, increase the use of recycled materials, and promote consumer awareness and participation in recycling programs are expected to drive the Electronic Recycling Market. Effective collection systems, transparent transboundary movement, and investment in recycling technologies are also essential for a successful transition to a circular economy for electronics.
Adoption of a Circular Economy in the United States: its regulatory framework remains fragmented and lacks international coordination. As a major emitter of greenhouse gases, the U.S. must take a more proactive role in promoting circular practices and collaborating with developing nations. Joining the Basel Convention would be a positive step towards addressing waste dumping overseas. Additionally, efforts to increase recycling should prioritize the prevention of pollution at the source. Although companies are embracing sustainability, legislative support for circular economy practices is still evolving, particularly at the federal level. This shift toward a circular economy model presents opportunities for electronic recycling companies to partner with manufacturers, retailers, and other stakeholders to implement sustainable practices throughout the lifecycle of electronic devices. By participating in circular economy initiatives, electronic recycling companies not only expand their customer base but also contribute to a more sustainable future.
Also, the Environmental Protection Agency (EPA) is in the process of implementing the National Recycling Strategy, which focuses on implementing a circular economy to increase the recycling rate in the United States to 50 percent by 2030. Recently, in June 2023, the United States participated in the eighth meeting of the Greening Government Initiative (GGI) a summit designed to enable countries to exchange information, methods of innovation, and best practices to meet Paris Agreement climate change commitments to discuss how national governments advance a circular economy.
Infrastructure Limitations and Regulatory Challenges to Restrain the Market Growth
Establishing an e-waste recycling business investment faces several limitations. Despite evolving regulations, there's a need for stronger regulatory capacity at both state and central levels. Consumer awareness about formal recycling units and the environmental impact of e-waste remains low, resulting in slow business growth. Additionally, inadequate infrastructure and costly technology hinder the establishment of e-waste recycling ventures. Such a factor restraining the electronic recycling market size growth is the lack of adequate infrastructure for collecting, sorting, and processing electronic waste. Many regions do not have sufficient facilities or systems in place to handle the volume of electronic waste generated, leading to inefficient recycling processes and limited capacity. Additionally, the cost of establishing and maintaining such infrastructure be prohibitive for some organizations or governments, further hindering the development of electronic recycling efforts.
Another significant restraining factor is the complexity and variability of regulations governing electronic waste disposal and recycling across different jurisdictions. Compliance with these regulations often requires significant resources and expertise, leading to barriers for businesses looking to enter the electronic recycling market. Additionally, inconsistencies in regulations between regions create logistical challenges for companies operating on a global scale, further complicating the electronic waste recycling process. These regulatory challenges deter investment in electronic recycling initiatives and impede the growth of the market.
Electronic Recycling Market Segment Analysis
By Material Type:
The Electronic Recycling Market comprises various material categories, including metals, glass, plastics, and other materials. In 2023, the metals category emerged as the dominant segment and is expected to maintain its leadership position throughout the forecast period. This is primarily due to the high demand for recycled metals in industries such as construction, automotive, and electronics. Additionally, recycling metals from electronic waste helps mitigate environmental damage caused by their extraction from the earth's crust, thereby conserving natural resources.
The plastics segment is projected to witness substantial growth over the forecast period. Increasing demand for plastics across industries like packaging, automotive, and construction, coupled with dwindling natural resources, is driving this expansion. The market for recycled plastics is expanding as efforts to reduce plastic waste and adopt sustainable waste management practices gain traction. Furthermore, advancements in technology for sorting and processing plastic waste are expected to bolster revenue growth in this market segment. Overall, heightened awareness about responsible electronic waste disposal and the growing emphasis on sustainability are driving demand for electronics recycling services, particularly for metals and plastics.
By Source:
Based on the source, the household appliances segment held the largest Electronic Recycling Market share in 2023. This growth is driven by the growing disposal of appliances like refrigerators and washing machines, coupled with increasing replacement needs. Stringent government regulations on electronic waste disposal are also expected to drive market growth. The IT and communications equipment segment is projected to exhibit the fastest revenue growth during the forecast period, driven by increased electronics usage and the IT industry's expansion. The consumer electronics segment is anticipated to experience significant expansion, increased by increased adoption of gadgets like televisions and gaming consoles. Rapid technological advancements and shorter product life cycles are expected to boost electronic waste generation and revenue growth. The "others" category, including industrial, military, and medical equipment, is expected to see stable expansion due to increased electronic equipment usage across various industries.
Electronic Recycling Market Regional Insight
North America held the largest Electronic Recycling Market share in 2023 with stringent regulations from the United States Environmental Protection Agency (EPA) ensuring safe disposal of hazardous materials. With a significant production of e-waste, the region's demand for electronics recycling is projected to surge. The International E-Waste Management Network (IEMN) convenes government officials annually to exchange best practices in electronics management. The US Environmental Protection Agency (USEPA) collaborates with global counterparts, including the Taiwan Environmental Protection Administration (Taiwan EPA), under IEMN since 2011. Additionally, USEPA partners with the Solving the E-waste Problem (StEP) initiative to address e-waste challenges in developing nations. In the US, the EPA supports the National Strategy for Electronics Stewardship, with 25 states mandating e-waste recycling and more working on legislation. Notably, California, Connecticut, Illinois, and Indiana prohibit e-waste from landfills, impacting 65% of the US population.
Each year, over 50 million tons of electronic waste is generated globally, including 1 billion cell phones and 300 million computers produced annually. In the US, 140 million cell phones end up in landfills yearly, enough to power 25,000 households if recycled. America leads in e-waste production, discarding 9.4 million tons yearly. Recycling 1 million laptops saves energy equivalent to 3,500 homes' electricity use. Despite this, only 12.5% of e-waste is recycled. Globally, 20-50 million metric tons of e-waste is discarded annually, comprising 2% of America's landfill waste but 70% of toxic waste. E-waste production is expected to grow by 8% annually, with roughly 80% of US e-waste exported to Asia.
Europe, the adoption of eco-friendly waste management practices and strict e-waste legislation, such as the Waste Electrical and Electronic Equipment (WEEE) directive, are set to drive substantial Electronic Recycling Market Share growth. Compliance requirements for electronics producers and importers are expected to bolster demand for recycling services.
Asia Pacific Electronic Recycling Market growth is driven by increasing consumer spending power, widespread adoption of electronic devices in countries such as China and India, and growing awareness of proper e-waste management practices. The region's status as a major electronics manufacturing hub will further drive demand for e-waste recycling services. Also, the consumer consciousness grows, these regions are expected to witness increasing demand for recycling solutions to address the mounting volumes of electronic trash.
Scope of Global Electronic Recycling Market: Inquire before buying
| Electronic Recycling Market | |||
|---|---|---|---|
| Report Coverage | Details | ||
| Base Year: | 2023 | Forecast Period: | 2024-2030 |
| Historical Data: | 2018 to 2023 | Market Size in 2024: | US $ 37.55 Bn. |
| Forecast Period 2024 to 2030 CAGR: | 12.7% | Market Size in 2030: | US $ 86.71 Bn. |
| Segments Covered: | by Material Type | Metals Glass Plastics Others (Ceramics, Rubber, etc.) |
|
| by Source | Household Appliances IT and telecommunication equipment Consumer electronics Others |
||
| by End Use Industries | Electronics Manufacturing Automotive Healthcare Energy Construction Consumer Goods Others |
||
Global Electronic Recycling Market, by Region:
North America (United States, Canada and Mexico)
Europe (UK, France, Germany, Italy, Spain, Sweden, Austria and Rest of Europe)
Asia Pacific (China, South Korea, Japan, India, Australia, Indonesia, Malaysia, Vietnam, Taiwan, Bangladesh, Pakistan and Rest of APAC)
Middle East and Africa (South Africa, GCC, Egypt, Nigeria and Rest of ME&A)
South America (Brazil, Argentina Rest of South America)
Electronic Recycling Key players
North America
1. AERC Recycling Solutions (United States)
2. Dlubak Glass Company (United States)
3. Eco-Tech Environmental Services Inc. (United States)
4. Fortune Plastic & Metal Inc. (United States)
5. MBA Polymers Inc. (United States)
6. URT Solutions (USA)
7. A2Z Group (USA)
8. Zak Enterprises (USA)
9. Good Point Recycling (United States)
10. Universal Recyclers Technologies (United States)
11. Ecomation Oy (Finland)
12. CRT Recycling Ltd. (United Kingdom)
Europe
13. CRT Recycling Ltd. (United Kingdom)
14. Aurubis AG(Germany)
15. Umicore (Belgium)
16. RecycloBekia (Egypt)
Asia Pacific
17. Cimelia Resource Recovery Pte Ltd (Singapore)
18. Sims Metal Management Limited (Australia)
19. Sims Metal Management Limited (Australia)
20. Enviro-Hub Holdings Ltd (Singapore)
21. CIMELIA Resource Recovery (Singapore)
Frequently Asked Questions:
1] What is the growth rate of the Global Electronic Recycling Market?
Ans. The Global Electronic Recycling Market is growing at a significant rate of 12.7 % during the forecast period.
2] Which region is expected to dominate the Global Electronic Recycling Market?
Ans. North America is expected to dominate the Electronic Recycling Market during the forecast period.
3] What is the expected Global Electronic Recycling Market size by 2030?
Ans. The Electronic Recycling Market size is expected to reach USD 37.55 Bn by 2030.
4] Which are the top players in the Global Electronic Recycling Market?
Ans. The major top players in the Global Electronic Recycling Market are Eco-Tech Environmental Services Inc., Fortune Plastic & Metal Inc. and others.
5] What are the factors driving the Global Electronic Recycling Market growth?
Ans. With the proliferation of electronic devices worldwide, there has been a significant increase in electronic waste (e-waste) generation. This surge in e-waste creates a pressing need for effective recycling solutions, driving the growth of the electronic recycling market.
6] Which country held the largest Global Electronic Recycling Market share in 2023?
Ans. The United States held the largest Electronic Recycling Market share in 2023.