Electric Van Market: Global analysis and forecast for the period 2024-2030

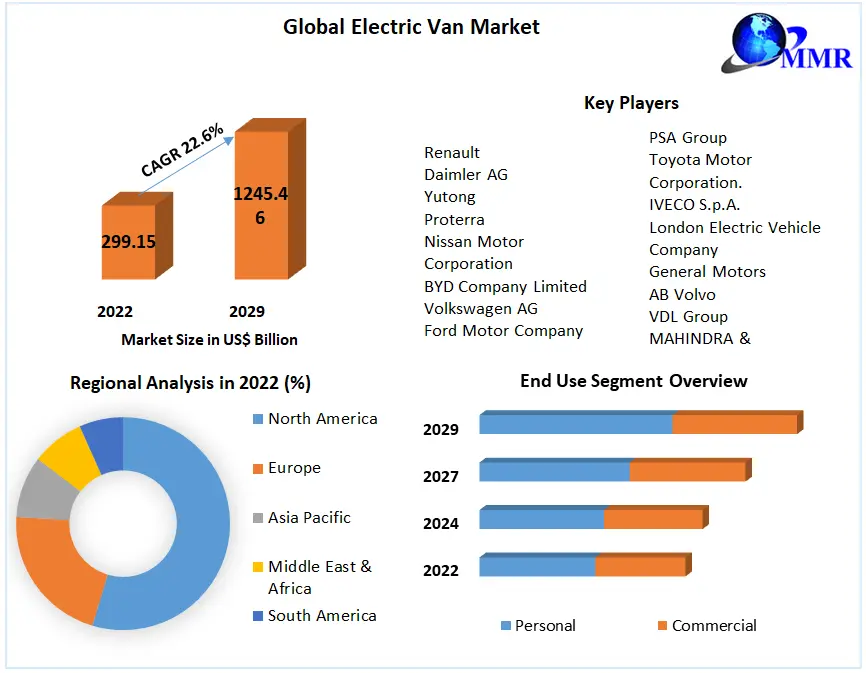
The Global Electric Van Market size was valued at USD 9.93 billion in 2023 and is expected to grow at a CAGR of 26.9% from 2024 to 2030, reaching a market size of approximately US$ 52.63 billion by 2030. An electric van is a type of vehicle that runs predominantly on electric power. The vehicle is designed for transporting goods or people and it is part of a broader trend towards electric vehicles. Electric vans offer several advantages over traditional internal combustion engine vehicles, such as less operating cost, reduced emission, and potentially quieter operation. They are popular in urban areas and used for delivery services owing to their greater efficiency and environmental benefits. The Electric Van market is expected to grow exceptionally in the forecast period of 2030. North America held the largest market share in 2023 and is estimated to grow progressively as the demand for electric vans increases. The demand for eco-friendly electric vehicles has been observed to be increasing in the past few years, as the consumer’s behaviour is more directed to sustainability and environmental concerns. Countries like the U.S., Japan, China, Germany, and the UK have a significant share of electric vans and in other developing countries like India and South Korea, the electric vehicle is in the initial stage of adoption. Europe has strict regulatory standardized practices for emissions and the government of countries in the Europe region provides incentives to the people to use electric vehicles and promote the electric vehicles. This has exceptionally increased the use of electric vehicles in Europe, especially in the UK and Germany. Despite this, the electric van market is facing several challenges to emerge and increase sales in the market. The lack of charging stations, the high cost of electric vans, safety majors, lack of resources, etc. are some of the factors that restrain the growth of the electric van market globally. The report provides a comprehensive analysis of the global Electric Van Market, which includes the current market size, overall segmentation analysis (By Range, Battery Type, Propulsion Type, Application, and Regions), market trends, drivers, restraints, opportunities, scope, and key players. Electric Van MarketTo know about the Research Methodology :- Request Free Sample Report

Global Electric Van Market Dynamics:

Potential drivers that led to a rise in the Electric Van Market Increasing demand for eco-friendly, emission-free, and energy-efficient electric vehicles is the driving factor for the electric van market. The vehicles are the largest contributors to global greenhouse gas emissions. According to the United Nations Environment Program (UNEP), around one-quarter of greenhouse gas emissions in the environment are contributed by the transport sector causing air pollution. 29% of Ozone depletion is caused by vehicle emissions discharging substances that bring air pollution. Governments worldwide are introducing electric vans to make urban public transport more sustainable and fuel-efficient, improving air quality, reducing noise, and increasing fuel efficiency. Also, governments are initiating and launching schemes, providing incentives to enable the adoption of electric vehicles and pressuring automakers to cut CO2 emissions from burning diesel fuel, this drives the growth of the electric van market. Electric Van Market addition, advancements in technological features of connectivity, data analytics, and autonomous features will increase efficiency and reduce operating costs. Electric vans with greater range, faster charging times, and longer lifespans as a result of ongoing advancements in battery technology, resolve major issues raised by both businesses and customers. This factor is expected to drive the growth of the global electric van market during the forecast period. Impact of Restraint on the Global Electric Van Market A shorter driving range of electric vans than that of commercial vans is one of the restraining factors that hinders the global electric van market during the forecast period. Many operators of electric vehicles especially commercial ones are concerned about the range or distance covered in one time charge. Also, high costs, lower speed, and battery range are some restraints that affect the global electric van market growth. The cost of electric vehicles is more dependent on the battery and the transmission units, which makes the vehicle more expensive than others. Another restraining factor for the growth of the market is the limited electric vehicle charging facilities available in various countries throughout the world. Potential growth opportunity for the Electric Van Market Ongoing advancements in battery technology include higher energy density and faster charging capabilities which make the electric van more reliable and preferable, providing an opportunity for electric van industry to emerge in market with such innovations. Many businesses are setting ambitious sustainability goals, including the reduction of carbon footprints. Consumer awareness and sustainability concerns surge the demand for electric vans. Also, Governments are offering incentives such as subsidies, tax credits, etc. to promote the adoption of electric vehicles and contributes in growth of electric van market. With the growth of urbanization and e-commerce, people are more diverted towards efficient last-mile delivery solutions. This increases the demand for electric vans as they are suited for these tasks due to their lower operational noise, low maintenance needs, and potential access to urban zones. The Automobile companies collaborate or partner with logistics firms to develop more efficient electric vans. This collaboration accelerates innovations and increase the market size of global electric van markets. Challenges affecting growth of the Electric Van Market Range anxiety is one of the concerns regarding electric vans as compared to diesel or gasoline-based vehicles. This is a significant challenge for the electric van manufacturing industry to increase the range required to travel long distances or operate. The concern has risen due to limited sites for electric vehicle charging, particular areas are facilitated with the charging points globally, these all factors affect the growth of global electric van market. Electric van industry needs to improve the charging infrastructure making it more reliable and accessible to customers. The upfront cost of electric vans is generally higher than that of commercial vans, this affects the preference and decision of customers to drive more towards commercial vans. The durability of electric vans is one of the concerns of customers as some businesses may still perceive electric vans as less reliable or durable compared to traditional vans, especially in harsh operating conditions or extreme weather. Electric Van Market Trends Charging infrastructure companies like ChargePoint and EVBox are expanding their networks to support the growing number of electric vans. They are installing fast-charging stations along delivery routes and in urban areas to ensure fleets have reliable access to charging facilities, enhancing the practicality of electric vans for commercial use. In Europe, the governments of countries like the Netherlands and Germany offer significant subsidies and tax incentives for businesses purchasing electric vans. These incentives help reduce the upfront costs and operational expenses associated with electric vehicles. In 2019, The climate pledge Amazon committed to achieving net-zero carbon by 2040. As a part of the pledge, Amazon announced a partnership with Rivian to bring 100,000 electric delivery vehicles on the road by 2030 and got to work on designing a new state-of-the-art delivery vehicle. In April 2024, Amazon rolled out more than 13,500 custom electric vans across the U.S.

Electric Van Market Segment Analysis

By Battery Type, Based on the Battery Type, the market is segmented into Lithium-ion battery, Lead-ion battery, and Lead carbon. Lithium-ion battery segment held the largest global electric van market share of xx% in 2023. This is due to the increasing use of lithium-ion batteries in electric vehicles, as they consist of multiple cells with fluctuating voltage. This is the key factor that drives the growth of the Lithium-ion battery segment in the global market during the forecast period. By Range Based on the range, the global electric van market is segmented into up to 100 miles, 100 to 200 miles, and above 200 miles. Among these, the 100 to 200-mile segment held the largest share of the global electric van market in 2023. This range is suitable for regional delivery applications without the need for frequent recharging. Electric vehicles with ranges of 100 to 200 miles are less expensive and affordable for the customer than those with longer ranges. During the forecast period, charging infrastructure will be improved and more established for ranges ranging from 100 to 200 miles, this increases the practicality of the electric vehicles. Also, businesses are working on readily locating charging facilities, minimizing concerns about range which makes the vehicle more reliable. Electric Van Market By Propulsion Type Based on the propulsion, the global electric van market is segmented into battery electric vans and plug-in hybrid electric vans. The battery electric van segment held the largest global electric van market share at xx% in 2023. The features and properties of battery electric vans including zero emissions and no pollution, the battery electric van is in high demand, and this drives market expansion for batteries worldwide. By Application, Based on the application, the global electric van market is segmented into personal, and commercial. The commercial segment held the largest of the global electric van market share in 2023. The usage of electric vans for commercial purposes is increasing due to awareness of greenhouse emission regulations, lowered operating costs, and numerous financial incentives. The technological advancement, available charging infrastructure, and most importantly the preference and attitude toward eco-friendly practices led the customer decision to purchase electric vans.

Electric Van Market Regional Analysis

Asia Pacific dominates the global electric van market and held the largest market share of xx% in 2030. The significant growth of the logistic sector and improving the infrastructure of the nation propelled the demand for electric vans for transportation applications. Increasing awareness about traffic pollution and initiatives taken by several governments for the adoption of electric vehicles in this region increases the demand. Increasing the economic standard and living standard of individuals in developing countries significantly propels them to decide to purchase electric vans. Development and increase in the number of automotive manufacturing industries, and entry of foreign automakers in emerging nations such as India and China are expected to drive the electric van market during the forecast period. Electric Van Market North America is expected to grow at the fastest pace in the global electric van market during the forecast period by 2030. The growth can be attributed to increasing government incentives and regulations, which raised the adoption of electric vans in the region. The availability of charging infrastructure is a key factor driving the market in North America. Competitive Landscape In Oct 2023, Renault Group, Volvo Group, and CMA CGM Group joined forces to address the growing need for decarbonized and efficient logistics with an all-new generation of electric vans. The pain points of the logistics will be addressed with superior and safe solutions onboarding the new Software-defined vehicle platform and a wide ecosystem of customized solutions. In May 2023 Mercedes-Benz announced that starting from 2026, all newly developed vans from Mercedes-Benz will be based on single innovation modular and scalable architecture called VAN.EA is short for Van Electric Architecture. VAN.EA, Mercedes-Benz Vans focuses on efficiency and performance in every aspect of the vehicle – including aerodynamics, drivetrain, tires, and chassis. The goal is to achieve a high range with an optimal battery capacity, which is directly related to vehicle weight and costs. The objective of the report is to present a comprehensive analysis of the Global Electric Van Market to the stakeholders in the industry. The past and current status of the industry with the forecasted market size and trends are presented in the report with the analysis of complicated data in simple language. The report covers all the aspects of the industry with a dedicated study of key players that include market leaders, followers, and new entrants. PORTER, PESTEL analysis with the potential impact of micro-economic factors of the market have been presented in the report. External as well as internal factors that are supposed to affect the business positively or negatively have been analysed, which will give a clear futuristic view of the industry to the decision-makers. The reports also help in understanding the Global Electric Van Market dynamic, and structure by analysing the market segments and projecting the Global Electric Van Market size. Clear representation of competitive analysis of key players by product, price, financial position, product portfolio, growth strategies, and regional presence in the Global Electric Van Market makes the report an investor’s guide.

Global Electric Van Market Scope: Inquire before buying

Global Electric Van Market
Report Coverage Details
Base Year: 2023 Forecast Period: 2024-2030
Historical Data: 2018 to 2023 Market Size in 2023: US $ 9.93 Bn.
Forecast Period 2024 to 2030 CAGR: 26.9% Market Size in 2030: US $ 52.63 Bn.
Segments Covered: by Battery Type Lithium-ion battery Lead-ion battery Lead carbon
by Range Up to 100 Miles 100-200 Miles Above 200 Miles
by Propulsion Type Plug-in Hybrid electric van Hybrid electric van Battery electric van
by Application Personal Commercial

Electric Van Market, by Region

North America (United States, Canada and Mexico) Europe (UK, France, Germany, Italy, Spain, Sweden, Austria, Turkey, Russia and Rest of Europe) Asia Pacific (China, India, Japan, South Korea, Australia, ASEAN and Rest of APAC) Middle East and Africa (South Africa, GCC, Egypt, Nigeria and Rest of ME&A) South America (Brazil, Argentina, Columbia and Rest of South America)

Electric Van Market's key Players are

1. Renault (France) 2. Mercedes-Benz Group AG 3. Yutong 4. Nissan Motor Corporation 5. General Motors (US) 6. BYD Company Limited (China) 7. Volkswagen AG 8. Ford Motor Company (US) 9. Tesla Inc. 10. Toyota Motor Corporation. 11. IVECO S.p.A. 12. Stellantis NV 13. General Motors 14. AB Volvo 15. Hyundai Motor Company 16. MAHINDRA & MAHINDRA LTD. Frequently Asked Questions: 1. Which region has the largest share in the Global Electric Van Market? Ans: The Asia Pacific region held the largest share in 2023. 2. What is the growth rate of the Global Electric Van Market? Ans: The Global Market is expected to grow at a CAGR of 26.9 % during the forecast period 2024-2030. 3. Why are demand for Electric vans rising? Ans: The demand for Electric vans is rising primarily due to several factors: awareness and adoption of electric vans, the concern for sustainability, eco-friendly practices, government incentives and policies, technology advancements, and improved charging infrastructure in regions, etc. 4. Who are the key players in the Global Electric Van Market? 1Ans: The important key players in the Global Electric Van Market are. Renault, Mercedes-Benz Group AG, Yutong, Nissan Motor Corporation, BYD Company Limited, Volkswagen AG, and Ford Motor Company. 5. What is the scope of the Global Electric Van Market report? Ans: The Global Electric Van Market report helps with the PESTLE, PORTER, Recommendations for Investors & Leaders, and market estimation of the forecast period.
1. Electric Van Market Introduction 1.1. Study Assumption and Market Definition 1.2. Scope of the Study 1.3. Executive Summary 2. Electric Van Market: Dynamics 2.1. Electric Van Market Trends by Region 2.1.1. North America Electric Van Market Trends 2.1.2. Europe Electric Van Market Trends 2.1.3. Asia Pacific Electric Van Market Trends 2.1.4. Middle East and Africa Electric Van Market Trends 2.1.5. South America Electric Van Market Trends 2.2. Electric Van Market Dynamics by Region 2.2.1. North America 2.2.1.1. North America Electric Van Market Drivers 2.2.1.2. North America Electric Van Market Restraints 2.2.1.3. North America Electric Van Market Opportunities 2.2.1.4. North America Electric Van Market Challenges 2.2.2. Europe 2.2.2.1. Europe Electric Van Market Drivers 2.2.2.2. Europe Electric Van Market Restraints 2.2.2.3. Europe Electric Van Market Opportunities 2.2.2.4. Europe Electric Van Market Challenges 2.2.3. Asia Pacific 2.2.3.1. Asia Pacific Electric Van Market Drivers 2.2.3.2. Asia Pacific Electric Van Market Restraints 2.2.3.3. Asia Pacific Electric Van Market Opportunities 2.2.3.4. Asia Pacific Electric Van Market Challenges 2.2.4. Middle East and Africa 2.2.4.1. Middle East and Africa Electric Van Market Drivers 2.2.4.2. Middle East and Africa Electric Van Market Restraints 2.2.4.3. Middle East and Africa Electric Van Market Opportunities 2.2.4.4. Middle East and Africa Electric Van Market Challenges 2.2.5. South America 2.2.5.1. South America Electric Van Market Drivers 2.2.5.2. South America Electric Van Market Restraints 2.2.5.3. South America Electric Van Market Opportunities 2.2.5.4. South America Electric Van Market Challenges 2.3. PORTER’s Five Forces Analysis 2.4. PESTLE Analysis 2.5. Technology Roadmap 2.6. Regulatory Landscape by Region 2.6.1. North America 2.6.2. Europe 2.6.3. Asia Pacific 2.6.4. Middle East and Africa 2.6.5. South America 2.7. Key Opinion Leader Analysis For Electric Van Industry 2.8. Analysis of Government Schemes and Initiatives For Electric Van Industry 2.9. Electric Van Market Trade Analysis 2.10. The Global Pandemic Impact on Electric Van Market 3. Electric Van Market: Global Market Size and Forecast by Segmentation by Demand and Supply Side (by Value in USD Million) 2023-2030 3.1. Electric Van Market Size and Forecast, by Battery Type (2023-2030) 3.1.1. Lithium-ion battery 3.1.2. Lead-ion battery 3.1.3. Lead carbon 3.2. Electric Van Market Size and Forecast, by Range (2023-2030) 3.2.1. Up to 100 Miles 3.2.2. 100-200 Miles 3.2.3. Above 200 Miles 3.3. Electric Van Market Size and Forecast, by Propulsion Type (2023-2030) 3.3.1. Plug-in Hybrid electric van 3.3.2. Hybrid electric van 3.3.3. Battery electric van 3.4. Electric Van Market Size and Forecast, by Application (2023-2030) 3.4.1. Personal 3.4.2. Commercial 3.5. Electric Van Market Size and Forecast, by Region (2023-2030) 3.5.1. North America 3.5.2. Europe 3.5.3. Asia Pacific 3.5.4. Middle East and Africa 3.5.5. South America 4. North America Electric Van Market Size and Forecast by Segmentation (by Value in USD Million) 2023-2030 4.1. North America Electric Van Market Size and Forecast, by Battery Type (2023-2030) 4.1.1. Lithium-ion battery 4.1.2. Lead-ion battery 4.1.3. Lead carbon 4.2. North America Electric Van Market Size and Forecast, by Range (2023-2030) 4.2.1. Up to 100 Miles 4.2.2. 100-200 Miles 4.2.3. Above 200 Miles 4.3. North America Electric Van Market Size and Forecast, by Propulsion Type (2023-2030) 4.3.1. Plug-in Hybrid electric van 4.3.2. Hybrid electric van 4.3.3. Battery electric van 4.4. North America Electric Van Market Size and Forecast, by Application (2023-2030) 4.4.1. Personal 4.4.2. Commercial 4.5. North America Electric Van Market Size and Forecast, by Country (2023-2030) 4.5.1. United States 4.5.1.1. United States Electric Van Market Size and Forecast, by Battery Type (2023-2030) 4.5.1.1.1. Lithium-ion battery 4.5.1.1.2. Lead-ion battery 4.5.1.1.3. Lead carbon 4.5.1.2. United States Electric Van Market Size and Forecast, by Range (2023-2030) 4.5.1.2.1. Up to 100 Miles 4.5.1.2.2. 100-200 Miles 4.5.1.2.3. Above 200 Miles 4.5.1.3. United States Electric Van Market Size and Forecast, by Propulsion Type (2023-2030) 4.5.1.3.1. Plug-in Hybrid electric van 4.5.1.3.2. Hybrid electric van 4.5.1.3.3. Battery electric van 4.5.1.4. United States Electric Van Market Size and Forecast, by Application (2023-2030) 4.5.1.4.1. Personal 4.5.1.4.2. Commercial 4.5.2. Canada 4.5.2.1. Canada Electric Van Market Size and Forecast, by Battery Type (2023-2030) 4.5.2.1.1. Lithium-ion battery 4.5.2.1.2. Lead-ion battery 4.5.2.1.3. Lead carbon 4.5.2.2. Canada Electric Van Market Size and Forecast, by Range (2023-2030) 4.5.2.2.1. Up to 100 Miles 4.5.2.2.2. 100-200 Miles 4.5.2.2.3. Above 200 Miles 4.5.2.3. Canada Electric Van Market Size and Forecast, by Propulsion Type (2023-2030) 4.5.2.3.1. Plug-in Hybrid electric van 4.5.2.3.2. Hybrid electric van 4.5.2.3.3. Battery electric van 4.5.2.4. Canada Electric Van Market Size and Forecast, by Application (2023-2030) 4.5.2.4.1. Personal 4.5.2.4.2. Commercial 4.5.3. Mexico 4.5.3.1. Mexico Electric Van Market Size and Forecast, by Battery Type (2023-2030) 4.5.3.1.1. Lithium-ion battery 4.5.3.1.2. Lead-ion battery 4.5.3.1.3. Lead carbon 4.5.3.2. Mexico Electric Van Market Size and Forecast, by Range (2023-2030) 4.5.3.2.1. Up to 100 Miles 4.5.3.2.2. 100-200 Miles 4.5.3.2.3. Above 200 Miles 4.5.3.3. Mexico Electric Van Market Size and Forecast, by Propulsion Type (2023-2030) 4.5.3.3.1. Plug-in Hybrid electric van 4.5.3.3.2. Hybrid electric van 4.5.3.3.3. Battery electric van 4.5.3.4. Mexico Electric Van Market Size and Forecast, by Application (2023-2030) 4.5.3.4.1. Personal 4.5.3.4.2. Commercial 5. Europe Electric Van Market Size and Forecast by Segmentation (by Value in USD Million) 2023-2030 5.1. Europe Electric Van Market Size and Forecast, by Battery Type (2023-2030) 5.2. Europe Electric Van Market Size and Forecast, by Range (2023-2030) 5.3. Europe Electric Van Market Size and Forecast, by Propulsion Type (2023-2030) 5.4. Europe Electric Van Market Size and Forecast, by Application (2023-2030) 5.5. Europe Electric Van Market Size and Forecast, by Country (2023-2030) 5.5.1. United Kingdom 5.5.1.1. United Kingdom Electric Van Market Size and Forecast, by Battery Type (2023-2030) 5.5.1.2. United Kingdom Electric Van Market Size and Forecast, by Range (2023-2030) 5.5.1.3. United Kingdom Electric Van Market Size and Forecast, by Propulsion Type (2023-2030) 5.5.1.4. United Kingdom Electric Van Market Size and Forecast, by Application (2023-2030) 5.5.2. France 5.5.2.1. France Electric Van Market Size and Forecast, by Battery Type (2023-2030) 5.5.2.2. France Electric Van Market Size and Forecast, by Range (2023-2030) 5.5.2.3. France Electric Van Market Size and Forecast, by Propulsion Type (2023-2030) 5.5.2.4. France Electric Van Market Size and Forecast, by Application (2023-2030) 5.5.3. Germany 5.5.3.1. Germany Electric Van Market Size and Forecast, by Battery Type (2023-2030) 5.5.3.2. Germany Electric Van Market Size and Forecast, by Range (2023-2030) 5.5.3.3. Germany Electric Van Market Size and Forecast, by Propulsion Type (2023-2030) 5.5.3.4. Germany Electric Van Market Size and Forecast, by Application (2023-2030) 5.5.4. Italy 5.5.4.1. Italy Electric Van Market Size and Forecast, by Battery Type (2023-2030) 5.5.4.2. Italy Electric Van Market Size and Forecast, by Range (2023-2030) 5.5.4.3. Italy Electric Van Market Size and Forecast, by Propulsion Type (2023-2030) 5.5.4.4. Italy Electric Van Market Size and Forecast, by Application (2023-2030) 5.5.5. Spain 5.5.5.1. Spain Electric Van Market Size and Forecast, by Battery Type (2023-2030) 5.5.5.2. Spain Electric Van Market Size and Forecast, by Range (2023-2030) 5.5.5.3. Spain Electric Van Market Size and Forecast, by Propulsion Type (2023-2030) 5.5.5.4. Spain Electric Van Market Size and Forecast, by Application (2023-2030) 5.5.6. Sweden 5.5.6.1. Sweden Electric Van Market Size and Forecast, by Battery Type (2023-2030) 5.5.6.2. Sweden Electric Van Market Size and Forecast, by Range (2023-2030) 5.5.6.3. Sweden Electric Van Market Size and Forecast, by Propulsion Type (2023-2030) 5.5.6.4. Sweden Electric Van Market Size and Forecast, by Application (2023-2030) 5.5.7. Austria 5.5.7.1. Austria Electric Van Market Size and Forecast, by Battery Type (2023-2030) 5.5.7.2. Austria Electric Van Market Size and Forecast, by Range (2023-2030) 5.5.7.3. Austria Electric Van Market Size and Forecast, by Propulsion Type (2023-2030) 5.5.7.4. Austria Electric Van Market Size and Forecast, by Application (2023-2030) 5.5.8. Rest of Europe 5.5.8.1. Rest of Europe Electric Van Market Size and Forecast, by Battery Type (2023-2030) 5.5.8.2. Rest of Europe Electric Van Market Size and Forecast, by Range (2023-2030) 5.5.8.3. Rest of Europe Electric Van Market Size and Forecast, by Propulsion Type (2023-2030) 5.5.8.4. Rest of Europe Electric Van Market Size and Forecast, by Application (2023-2030) 6. Asia Pacific Electric Van Market Size and Forecast by Segmentation (by Value in USD Million) 2023-2030 6.1. Asia Pacific Electric Van Market Size and Forecast, by Battery Type (2023-2030) 6.2. Asia Pacific Electric Van Market Size and Forecast, by Range (2023-2030) 6.3. Asia Pacific Electric Van Market Size and Forecast, by Propulsion Type (2023-2030) 6.4. Asia Pacific Electric Van Market Size and Forecast, by Application (2023-2030) 6.5. Asia Pacific Electric Van Market Size and Forecast, by Country (2023-2030) 6.5.1. China 6.5.1.1. China Electric Van Market Size and Forecast, by Battery Type (2023-2030) 6.5.1.2. China Electric Van Market Size and Forecast, by Range (2023-2030) 6.5.1.3. China Electric Van Market Size and Forecast, by Propulsion Type (2023-2030) 6.5.1.4. China Electric Van Market Size and Forecast, by Application (2023-2030) 6.5.2. S Korea 6.5.2.1. S Korea Electric Van Market Size and Forecast, by Battery Type (2023-2030) 6.5.2.2. S Korea Electric Van Market Size and Forecast, by Range (2023-2030) 6.5.2.3. S Korea Electric Van Market Size and Forecast, by Propulsion Type (2023-2030) 6.5.2.4. S Korea Electric Van Market Size and Forecast, by Application (2023-2030) 6.5.3. Japan 6.5.3.1. Japan Electric Van Market Size and Forecast, by Battery Type (2023-2030) 6.5.3.2. Japan Electric Van Market Size and Forecast, by Range (2023-2030) 6.5.3.3. Japan Electric Van Market Size and Forecast, by Propulsion Type (2023-2030) 6.5.3.4. Japan Electric Van Market Size and Forecast, by Application (2023-2030) 6.5.4. India 6.5.4.1. India Electric Van Market Size and Forecast, by Battery Type (2023-2030) 6.5.4.2. India Electric Van Market Size and Forecast, by Range (2023-2030) 6.5.4.3. India Electric Van Market Size and Forecast, by Propulsion Type (2023-2030) 6.5.4.4. India Electric Van Market Size and Forecast, by Application (2023-2030) 6.5.5. Australia 6.5.5.1. Australia Electric Van Market Size and Forecast, by Battery Type (2023-2030) 6.5.5.2. Australia Electric Van Market Size and Forecast, by Range (2023-2030) 6.5.5.3. Australia Electric Van Market Size and Forecast, by Propulsion Type (2023-2030) 6.5.5.4. Australia Electric Van Market Size and Forecast, by Application (2023-2030) 6.5.6. Indonesia 6.5.6.1. Indonesia Electric Van Market Size and Forecast, by Battery Type (2023-2030) 6.5.6.2. Indonesia Electric Van Market Size and Forecast, by Range (2023-2030) 6.5.6.3. Indonesia Electric Van Market Size and Forecast, by Propulsion Type (2023-2030) 6.5.6.4. Indonesia Electric Van Market Size and Forecast, by Application (2023-2030) 6.5.7. Malaysia 6.5.7.1. Malaysia Electric Van Market Size and Forecast, by Battery Type (2023-2030) 6.5.7.2. Malaysia Electric Van Market Size and Forecast, by Range (2023-2030) 6.5.7.3. Malaysia Electric Van Market Size and Forecast, by Propulsion Type (2023-2030) 6.5.7.4. Malaysia Electric Van Market Size and Forecast, by Application (2023-2030) 6.5.8. Vietnam 6.5.8.1. Vietnam Electric Van Market Size and Forecast, by Battery Type (2023-2030) 6.5.8.2. Vietnam Electric Van Market Size and Forecast, by Range (2023-2030) 6.5.8.3. Vietnam Electric Van Market Size and Forecast, by Propulsion Type (2023-2030) 6.5.8.4. Vietnam Electric Van Market Size and Forecast, by Application (2023-2030) 6.5.9. Taiwan 6.5.9.1. Taiwan Electric Van Market Size and Forecast, by Battery Type (2023-2030) 6.5.9.2. Taiwan Electric Van Market Size and Forecast, by Range (2023-2030) 6.5.9.3. Taiwan Electric Van Market Size and Forecast, by Propulsion Type (2023-2030) 6.5.9.4. Taiwan Electric Van Market Size and Forecast, by Application (2023-2030) 6.5.10. Rest of Asia Pacific 6.5.10.1. Rest of Asia Pacific Electric Van Market Size and Forecast, by Battery Type (2023-2030) 6.5.10.2. Rest of Asia Pacific Electric Van Market Size and Forecast, by Range (2023-2030) 6.5.10.3. Rest of Asia Pacific Electric Van Market Size and Forecast, by Propulsion Type (2023-2030) 6.5.10.4. Rest of Asia Pacific Electric Van Market Size and Forecast, by Application (2023-2030) 7. Middle East and Africa Electric Van Market Size and Forecast by Segmentation (by Value in USD Million) 2023-2030 7.1. Middle East and Africa Electric Van Market Size and Forecast, by Battery Type (2023-2030) 7.2. Middle East and Africa Electric Van Market Size and Forecast, by Range (2023-2030) 7.3. Middle East and Africa Electric Van Market Size and Forecast, by Propulsion Type (2023-2030) 7.4. Middle East and Africa Electric Van Market Size and Forecast, by Application (2023-2030) 7.5. Middle East and Africa Electric Van Market Size and Forecast, by Country (2023-2030) 7.5.1. South Africa 7.5.1.1. South Africa Electric Van Market Size and Forecast, by Battery Type (2023-2030) 7.5.1.2. South Africa Electric Van Market Size and Forecast, by Range (2023-2030) 7.5.1.3. South Africa Electric Van Market Size and Forecast, by Propulsion Type (2023-2030) 7.5.1.4. South Africa Electric Van Market Size and Forecast, by Application (2023-2030) 7.5.2. GCC 7.5.2.1. GCC Electric Van Market Size and Forecast, by Battery Type (2023-2030) 7.5.2.2. GCC Electric Van Market Size and Forecast, by Range (2023-2030) 7.5.2.3. GCC Electric Van Market Size and Forecast, by Propulsion Type (2023-2030) 7.5.2.4. GCC Electric Van Market Size and Forecast, by Application (2023-2030) 7.5.3. Nigeria 7.5.3.1. Nigeria Electric Van Market Size and Forecast, by Battery Type (2023-2030) 7.5.3.2. Nigeria Electric Van Market Size and Forecast, by Range (2023-2030) 7.5.3.3. Nigeria Electric Van Market Size and Forecast, by Propulsion Type (2023-2030) 7.5.3.4. Nigeria Electric Van Market Size and Forecast, by Application (2023-2030) 7.5.4. Rest of ME&A 7.5.4.1. Rest of ME&A Electric Van Market Size and Forecast, by Battery Type (2023-2030) 7.5.4.2. Rest of ME&A Electric Van Market Size and Forecast, by Range (2023-2030) 7.5.4.3. Rest of ME&A Electric Van Market Size and Forecast, by Propulsion Type (2023-2030) 7.5.4.4. Rest of ME&A Electric Van Market Size and Forecast, by Application (2023-2030) 8. South America Electric Van Market Size and Forecast by Segmentation (by Value in USD Million) 2023-2030 8.1. South America Electric Van Market Size and Forecast, by Battery Type (2023-2030) 8.2. South America Electric Van Market Size and Forecast, by Range (2023-2030) 8.3. South America Electric Van Market Size and Forecast, by Propulsion Type(2023-2030) 8.4. South America Electric Van Market Size and Forecast, by Application (2023-2030) 8.5. South America Electric Van Market Size and Forecast, by Country (2023-2030) 8.5.1. Brazil 8.5.1.1. Brazil Electric Van Market Size and Forecast, by Battery Type (2023-2030) 8.5.1.2. Brazil Electric Van Market Size and Forecast, by Range (2023-2030) 8.5.1.3. Brazil Electric Van Market Size and Forecast, by Propulsion Type (2023-2030) 8.5.1.4. Brazil Electric Van Market Size and Forecast, by Application (2023-2030) 8.5.2. Argentina 8.5.2.1. Argentina Electric Van Market Size and Forecast, by Battery Type (2023-2030) 8.5.2.2. Argentina Electric Van Market Size and Forecast, by Range (2023-2030) 8.5.2.3. Argentina Electric Van Market Size and Forecast, by Propulsion Type (2023-2030) 8.5.2.4. Argentina Electric Van Market Size and Forecast, by Application (2023-2030) 8.5.3. Rest Of South America 8.5.3.1. Rest Of South America Electric Van Market Size and Forecast, by Battery Type (2023-2030) 8.5.3.2. Rest Of South America Electric Van Market Size and Forecast, by Range (2023-2030) 8.5.3.3. Rest Of South America Electric Van Market Size and Forecast, by Propulsion Type (2023-2030) 8.5.3.4. Rest Of South America Electric Van Market Size and Forecast, by Application (2023-2030) 9. Global Electric Van Market: Competitive Landscape 9.1. MMR Competition Matrix 9.2. Competitive Landscape 9.3. Key Players Benchmarking 9.3.1. Company Name 9.3.2. Business Segment 9.3.3. End-user Segment 9.3.4. Revenue (2022) 9.3.5. Company Locations 9.4. Leading Electric Van Market Companies, by market capitalization 9.5. Market Structure 9.5.1. Market Leaders 9.5.2. Market Followers 9.5.3. Emerging Players 9.6. Mergers and Acquisitions Details 10. Company Profile: Key Players 10.1. Renault (France) 10.1.1. Company Overview 10.1.2. Business Portfolio 10.1.3. Financial Overview 10.1.4. SWOT Analysis 10.1.5. Strategic Analysis 10.1.6. Scale of Operation (small, medium, and large) 10.1.7. Details on Partnership 10.1.8. Regulatory Accreditations and Certifications Received by Them 10.1.9. Awards Received by the Firm 10.1.10. Recent Developments 10.2. Mercedes-Benz Group AG 10.3. Yutong 10.4. Nissan Motor Corporation 10.5. General Motors (US) 10.6. BYD Company Limited (China) 10.7. Volkswagen AG 10.8. Ford Motor Company (US) 10.9. Tesla Inc. 10.10. Toyota Motor Corporation. 10.11. IVECO S.p.A. 10.12. Stellantis NV 10.13. General Motors 10.14. AB Volvo 10.15. Hyundai Motor Company 10.16. MAHINDRA & MAHINDRA LTD. 11. Key Findings 12. Industry Recommendations 13. Electric Van Market: Research Methodology 14. Terms and Glossary
  • INQUIRE BEFORE BUYING