
E-waste to Precious Metal Market Size – Industry Structure Evaluation, Demand Drivers Analysis, Regional Growth Analysis and Identification, Competitive Positioning Review & Global Market Size Forecast to 2032
Overview
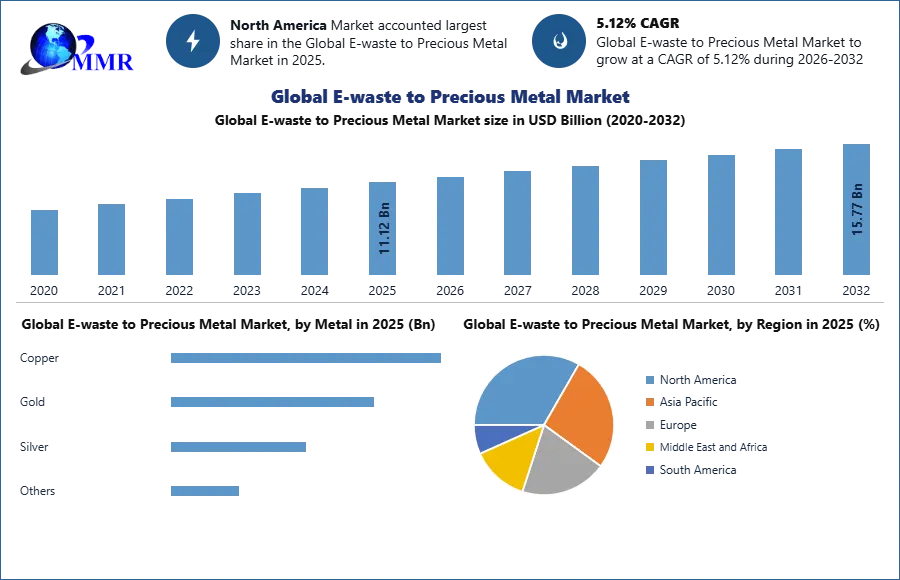
E-waste to Precious Metal Market size is expected to reach US$ 15.77 Bn in year 2032, at a CAGR of 5.12% during the forecast period.
The global E-waste to Precious Metal Market report is a comprehensive analysis of the industry, market, and key players. The report has covered the market by demand and supply-side by segments. The global E-waste to Precious Metal Market report also provides trends by market segments, technology, and investment with a competitive landscape.
 To know about the Research Methodology :- Request Free Sample Report
E-waste to Precious Metal Market Overview:
E-waste stands for electronic waste. Various metallurgic and chemical approaches are used to recover precious metals from E-waste. This E-waste recovery of precious metals is carried out to reuse the metal for another application. Various types of precious metals are gold, copper, and silver. These metals are employed in various end-user industries for the electrical and electronic application, plumbing, transportations, and other.
E-waste to Precious Metal Market Dynamics:
Demand for the precious metal market has taken over the global market due to industrial application as an investment tool. Copper being economical and abundant in nature is widely accepted in application industries like electronics, automobiles, transportation, and others. Coppers have excellent thermal and electric conductivity. And due to this factor, they are most preferred in power generation and transmission. Gold is widely used in jewelry, medical, a dental application like teeth caps and fillings. Gold is noncorrosive and used as a catalyst in some pharmaceutical preparations like drugs. Silver is used in manufacturing solar cells, laptops, and batteries, and is also used in India for the jewelry industry. Silver is also employed by the food industry. This factor is responsible to drive the E-waste precious metal market.
The major Restraining factor of the E-waste precious metal market is metal recovery from electronic waste. Cyanide leaching is preferable and shows efficient results in outcomes. However, the contamination and extreme toxicity of cyanide can harm the individual due to cyanide spills in the environment outlets like drinking water and can affect the land as well. Though the low concentration of cyanide is degradable in sunlight and has less toxicity to the environment.
The E-waste precious metal market is shooting for more opportunities in the electronic and electrical sector as the rate of recycled e-waste is not running in a favorable direction and very few metals are recycled by the industries. As per the research study e-waste generated globally accounts for 54.9 billion MT and recycled E-waste accounts for 8.9 billion in the base year 2022. This factor leads to more purchases and sales of precious metals opens the door for key players to invest in the market.
E-waste to Precious Metal Market Segment Analysis:
By Source, the segment is trifurcated into Household Appliances, It & Telecommunication, Consumer Electronics. Household appliances are dominating the E-waste to Precious Metal Market as the populations are increasing and growing urbanization and rising purchasing power of the individual is driving the E-waste to Precious Metal Market. The demand for home appliances like mixers, electronic and electrical devices is boosting the market.
The market share of the home appliances market was valued at USD 171.56 billion in the year 2018 and is estimated to reach USD 209.68 billion at a CAGR of 3.45% in the forecast. As the population is increasing the consumers are investing more in luxury like cooking, cleaning, food preservation, and these factors are fueling the market growth of E-waste to the Precious Metal Market. Consumer electronics is the second dominating in E-waste to Precious Metal Market.
By Metal: the segment is trifurcated into Copper, Gold, and Silver. The sub-segment copper is dominating the metal segment. The consumption of copper is wider in the construction industry, transmission, and power generation industry, electronics, and electrical products manufacturing, and production facilities in various industries like transportation, vehicle, and machinery are creating a huge demand for copper.
The demand for copper is increasing by 4.6% in the forecast period. As per the research study, 30.4 million metric tons of world copper is analyzed by the industry in the forecast period. The market share of the copper industry was valued at 36.2 million and is advancing by 4.3% in the forecast period.
The second dominating is Gold metal owed growing ornamental industry in the Asia Pacific and its wider consumption. India is dominating in the gold market globally.
Recent Development: E-waste to Precious Metal Market
| Exact Date | Company | Development | Impact |
|---|---|---|---|
| 20 February 2026 | Umicore | Confirmed a final investment decision for the second half of 2026 to expand its proprietary hydrometallurgical flowsheet within its Precious Metals Refining unit. | The expansion will increase copper and nickel capacity and shorten Platinum Group Metals (PGM) throughput times, enhancing efficiency in complex e-waste processing. |
| 03 February 2026 | Boliden | Reported record annual earnings driven by strong precious metal prices and stable production across its recycling-integrated smelters in Rönnskär and Harjavalta. | The results validate the economic resilience of "urban mining" models that extract gold and silver from electronic scrap to offset volatile primary mining costs. |
| 16 December 2025 | DOWA Holdings | Commenced a large-scale demonstration test for a one-stop recycling service designed to recover precious metals from decommissioned photovoltaic (PV) panels. | This initiative establishes a circular resource scheme for silver and other metals, addressing the emerging wave of end-of-life solar infrastructure waste. |
| 05 December 2025 | Boliden | Announced a SEK 400 million positive profit adjustment following the final assessment of metal recoveries at the Rönnskär smelter material flows. | The adjustment reflects optimized recovery rates for precious metals from secondary feedstocks, strengthening the company's 2026 financial guidance for the recycling segment. |
| 01 October 2025 | DOWA Eco-System | Released the FY2025 H2 Metal Production Plan, prioritizing the recovery of 22 different metallic elements through advanced pyrometallurgical technologies. | The plan focuses on increasing free metal income from PGMs and gold, leveraging high-grade PCB feedstock to meet growing domestic industrial demand. |
| 13 June 2025 | Murata Manufacturing | Partnered with DOWA Holdings to co-create a specialized resource circulation scheme for the secure recovery of metals from electronic components. | This collaboration ensures material security for high-value metals, reducing reliance on primary mining by re-injecting recovered silver and gold back into electronics manufacturing. |
E-waste to Precious Metal Market Regional Insights:
The Asia Pacific is second dominating in the E-waste to Precious Metal Market, and the dominating countries of Asia Pacific are China, India, Malaysia, South Korea, Taiwan, and Japan and contributing a large amount of market share in the precious metal market. The Asia Pacific is the largest consumer of gold commodities and has a strong base in the jewelry and ornament sector.
The availability of raw materials and labor is making the Asia Pacific market more preferred for the precious metal market. Additionally, China is the dominating in the building and construction sector, and this is corresponding to a larger market share in the region as well as globally. Furthermore, Asia Pacific has been the highest grown region in the precious metal market.
The objective of the report is to present a comprehensive analysis of the global E-waste to Precious Metal Market to the stakeholders in the industry. The past and current status of the industry with the forecasted market size and trends are presented in the report with the analysis of complicated data in simple language. The report covers all the aspects of the industry with a dedicated study of key players that include market leaders, followers, and new entrants.
PORTER, SVOR, PESTEL analysis with the potential impact of micro-economic factors of the market have been presented in the report. External as well as internal factors that are supposed to affect the business positively or negatively have been analyzed, which will give a clear futuristic view of the industry to the decision-makers.
The report also helps in understanding the global E-waste to Precious Metal Market dynamics, structure by analyzing the market segments and project the global E-waste to Precious Metal Market size. Clear representation of competitive analysis of key players by Grade, price, financial position, Grade portfolio, growth strategies, and regional presence in the global E-waste to Precious Metal Market make the report investor’s guide.
E-waste to Precious Metal Market Scope: Inquire before buying
| Global E-waste to Precious Metal Market | |||
|---|---|---|---|
| Report Coverage | Details | ||
| Base Year: | 2025 | Forecast Period: | 2026-2032 |
| Historical Data: | 2020 to 2025 | Market Size in 2025: | 11.12 USD Billion |
| Forecast Period 2026-2032 CAGR: | 5.12% | Market Size in 2032: | 15.77 USD Billion |
| Segments Covered: | by E-waste Type | Printed Circuit Boards (PCBs) Batteries Cables & Wires Displays & Monitors Others |
|
| by Source | Household Appliances It & Telecommunication Consumer Electronics Others |
||
| by Metal | Copper Gold Silver Others |
||
| by End User | Metal Refiners Electronics Manufacturers Recycling Companies Others |
||
E-waste to Precious Metal Market, by Region
● North America (United States, Canada and Mexico)
● Europe (UK, France, Germany, Italy, Spain, Sweden, Austria, Turkey, Russia and Rest of Europe)
● Asia Pacific (China, India, Japan, South Korea, Australia, ASEAN and Rest of APAC)
● Middle East and Africa (South Africa, GCC, Egypt, Nigeria and Rest of ME&A)
● South America (Brazil, Argentina, Columbia and Rest of South America).
E-waste to Precious Metal Market, Key Players are:
- Umicore
- Aurubis AG
- Sims Limited
- Materion Corporation
- Boliden AB
- DOWA Holdings Co., Ltd.
- Johnson Matthey
- Heraeus Holding GmbH
- Tanaka Precious Metals
- TES-AMM Pte. Ltd.
- Metallix Refining Inc.
- EnviroLeach Technologies Inc.
- emew Corporation
- Reldan
- All Green Electronics Recycling
- Globe Metal
- Metech Recycling
- Mint Innovation
- Tetronics International
- The Royal Mint
- Sutter Metals Recycling
- Attero Recycling
- Veolia
- SUEZ Recycling and Recovery
- Stena Recycling
- MBA Polymers
- ERI (Electronic Recyclers International)
- Kuusakoski Recycling
- Sims Lifecycle Services
- JX Advanced Metals
Frequently Asked Questions:
1. Which region has the largest share in Global Sodium Lauryl Sulphate Market Market?
Ans: Asia Pacific region held the highest share in 2025.
2. What is the growth rate of Global Sodium Lauryl Sulphate Market Market?
Ans: The Global Sodium Lauryl Sulphate Market Market is expected to growing at a CAGR of 5.12% during forecast period 2026-2032.
3. What is scope of the Global Sodium Lauryl Sulphate Market market report?
Ans: Global Sodium Lauryl Sulphate Market Market report helps with the PESTEL, PORTER, COVID-19 Impact analysis, Recommendations for Investors & Leaders, and market estimation of the forecast period.
4. Who are the key players in Global Sodium Lauryl Sulphate Market market?
Ans: The important key players in the Global Sodium Lauryl Sulphate Market Market are - Johnson Matthey, Umicore, Materion Corporation, Boliden Group, Sims Recycling Ltd, TANAKA HOLDINGS Co., Ltd., Metallix, TES, Heraeus Holding, Enviroleach Technologies Inc., DOWA Holdings Co., Ltd. (Japan), and Metallix Refining Inc. (US).
5. What is the study period of this market?
Ans: The Global Sodium Lauryl Sulphate Market Market is studied from 2025 to 2032.