Digital Therapeutics Market Size, Share, Trend Analysis and Industry Growth Forecast (2025-2032)

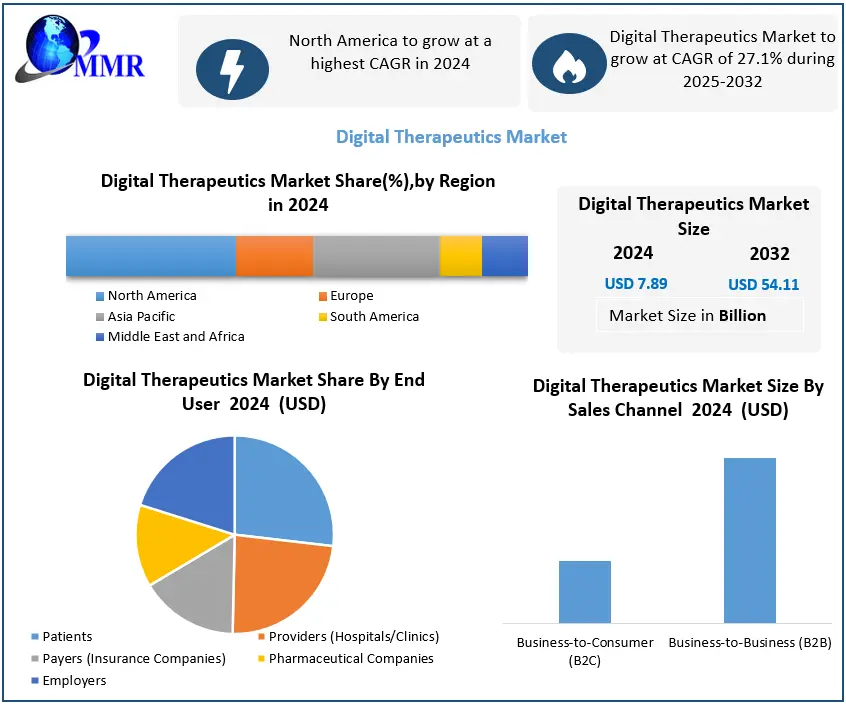
Digital Therapeutics Market was valued at USD 7.89 Bn. in 2024 and the total Global Digital Therapeutics Market revenue is Expected to grow at a CAGR of 27.1% from 2025 to 2032 reaching nearly USD 54.11 Bn. by 2032.

Digital Therapeutics Market Overview:

Patients benefit from evidence-based treatment interventions delivered through digital therapeutic interventions. It is delivered via software and gadgets to help prevent, manage, and treat medical diseases. To deliver patient care and health results, the digital treatment software program can be utilized alone or in conjunction with another device, drug, or therapy. Digital therapies' design, clinical validation, usability, and data security are all based on cutting-edge technology and best practices. Before usage, these items are assessed and authorized by regulatory organizations. Additionally, digital treatments give smart, accessible tools to patients, healthcare professionals, and payers to treat a wide range of illnesses through interventions such as high-quality, safe, and effective evidence-based cards. The increasing adoption of smartphones in developed and emerging markets, the cost-effectiveness of digital health technology for providers and patients, and the rising need for integrated healthcare systems and patient-centric treatment are expected to increase market growth. According to Kepios, 4.27 billion people were using the internet, in April 2022, accounting for more than 60% of the global population. Besides that, the COVID-19 pandemic, supporting regulatory actions and early signs of reimbursement, as well as the rising prevalence of chronic illnesses, are expected to drive market growth. The COVID-19 pandemic had a huge influence on the market. Demand for simple and accessible digital health solutions is a primary COVID-related motivator. According to the FDA's April 2020 rules, the distribution and use of digital health treatment devices for mental health illnesses would be permitted during the duration of the pandemic. Providers can thereby sell their solutions without having to conform to standard regulatory criteria, as long as the gadgets do not cause an unnecessary public health emergency. Growing regulatory activities are expected to drive market standardization and R&D throughout the forecast period. In addition, Poor diet, cigarette use, drunkenness, and a lack of physical activity all raise the chance of having a chronic condition. Healthcare expenditures rise rapidly because most chronic illnesses do not exist in isolation and patients frequently have co-morbidities. Smartphone ownership is becoming increasingly important in strengthening global interconnection, both economically and socially. Smartphone penetration is a significant factor driving the market growth. Digital Therapeutics Market 2025-2032To know about the Research Methodology :- Request Free Sample Report

Digital Therapeutics Market Dynamics:

Increasing prevalence of chronic diseases Chronic illnesses have raised the load on global healthcare systems. According to the American Heart Association's 2016 publication, Heart Diseases and Stroke Statistics at a Glance, cardiovascular disease (CVD) is the leading cause of mortality globally. The increased prevalence and incidence rate of chronic illnesses is a key concern for global healthcare systems. The management of chronic illness patients is a considerable problem since psychosomatic or bio-psychic variables frequently impact these individuals. Patients must adapt their behavior as part of a new self-care lifestyle since chronic illnesses are frequently accompanied by significant levels of uncertainty. However, many chronic diseases and illnesses are progressive, and their prevalence rises with age. As a result of the large increase in the global elderly population, chronic diseases are expected to increase during the forecast period. Growing concerns about Data Privacy Many governments reject proper permissions to various health applications, raising issues about product and data quality, dependability in treatment decisions, patient privacy, security, and responsible data usage. Digital therapy providers have access to patient information and are not permitted to share it with anybody who is not involved in the patient's treatment. However, with data integration utilizing digital technologies, the patient's data may be viewed by any healthcare provider unrelated to the patient's treatment program. Several countries, such as the United States (through the Health Insurance Portability and Accountability Act (HIPAA) and the Health Information Technology for Economic and Clinical Health (HITECH) Act), have legislation addressing data security. Despite such federal actions, digital therapeutics consumers are vulnerable to infringement and data breaches, which may restrict the market's growth. Emerging markets offer lucrative growth opportunities Emerging markets like India, China, and the Middle East offer growth possibilities for digital therapeutics growth. Due to a lack of knowledge, the limited availability of these solutions, a lack of IT infrastructure, and financial and societal restraints, the industry is still in its infancy in most geographies. On the other hand, chronic illness incidence is high in most rising economies. According to WHO predictions, chronic illnesses would account for 74% of all over the world by 2023. By 2025, emerging nations would face 60% of the global burden of chronic illnesses. Besides that, the scarcity of trained medical practitioners in developing countries emphasizes the significance of connected healthcare. However, emerging nations such as India and China lack sufficient standards and government regulations for digital health solutions, which provide an enormous opportunity to providers that are unable to fulfill the high criteria required by the US federal government. In these areas, the patient-to-doctor ratio is generally substantially higher, necessitating alternate healthcare options. These countries have also registered widespread adoption of smartphones and related technologies due to their growing affordability. Globally, China and India are the top two countries in terms of smartphone penetration. Additionally, the growing availability of smart devices and the Internet has driven the production of health applications. Additionally, government agencies in these locations are working to develop HCIT infrastructure. China, for example, planned to enhance healthcare quality by integrating HCIT solutions in its five-year strategy from 2015 to 2020. Patients' reluctance to use digital treatments Motivating consumers to utilize digital medicines and gaining their trust is a significant challenge for digital therapeutic providers. While elderly and underprivileged groups have the highest illness susceptibility and incidence rates, they are the least likely to employ digital therapy products due to low levels of technological literacy. Additionally, the amount of behavioral change that may be noticed with digital treatments is currently unknown. The clinical validation and implementation of digital treatments are done on self-selected or volunteer patients, but their effect on patients who demonstrate resistance is undetermined. However, it is uncertain if digital treatments can be sustained over extended periods of time, and there is limited data on total patient retention and long-term effects. Many patients still rely on established methods of diagnosis and therapy, making these revolutionary approaches unappealing. This presents a significant challenge to the digital therapies business.

Digital Therapeutics Market Segment Analysis:

Based on Application, the Treatment/Care-related Applications segment dominated the market with the highest market share in 2024 and is expected to maintain its dominance at the end of the forecast period. The Diabetes segment is expected to lead the market during the forecast period. According to the CDC, almost 38.1 million individuals had diabetes in 2023. The growing prevalence of diabetes and various other chronic conditions is one of the factors driving the segment's growth. Digital therapies can help healthcare doctors examine patients' lifestyles and enhance treatment plans depending on their unique therapeutic needs. Based on Sales Channel market is segmented into Business-to-Consumer (B2C) and Business-to-Business (B2B). Business to Business segment dominated the market in 2024 and is expected to hold largest share during the forecast period. Dominance is driven by growing partnerships between DTx providers and employers, insurance companies, and healthcare organizations aiming to improve patient outcomes and reduce treatment costs. The B2B model ensures wider patient reach, better reimbursement frameworks, and integration into existing healthcare systems, making it a preferred channel for scaling digital therapeutic solutions. Cardiovascular diseases, smoking cessation, and obesity segment expected to increase at considerable rates throughout the forecast period. The growing use of digital therapeutic goods to treat respiratory disorders is driving the market growth. Hailie by Adherium, Respiro by Amiko, Propeller by Propeller Health, Breathe Smart by Cohero Health, and CareTRx by Teva are among these products. Digital medicines have the potential to change the course of COPD and asthma treatment. This is because poor drug adherence is a significant concern while treating respiratory disorders. Digital therapy solutions can aid in the efficient resolution of this issue. The relatively rapid and significant increase in the prevalence of obesity has been largely attributed to a changing lifestyle that promotes increased caloric intake and reduced physical activity. A high-fat diet, excessive use of sugar-sweetened drinks, and increased fast food consumption may all contribute to the continued rise in obesity prevalence. In the United States, obesity has reached epidemic proportions. More than two-thirds of people are overweight or obese, with one in every three Americans being obese. Obesity has become increasingly common among youngsters. Obesity has also been rapidly increasing over the world, with the prevalence of obesity nearly doubling between 1991 and 1998. In the United States in 2015, about 40% of adults were obese. Obesity causes around 112,000 fatalities in the United States each year, with the majority of these deaths occurring in people with a BMI greater than 30. Patients with a BMI greater than 40 have a lower life expectancy.Digital Therapeutics Market
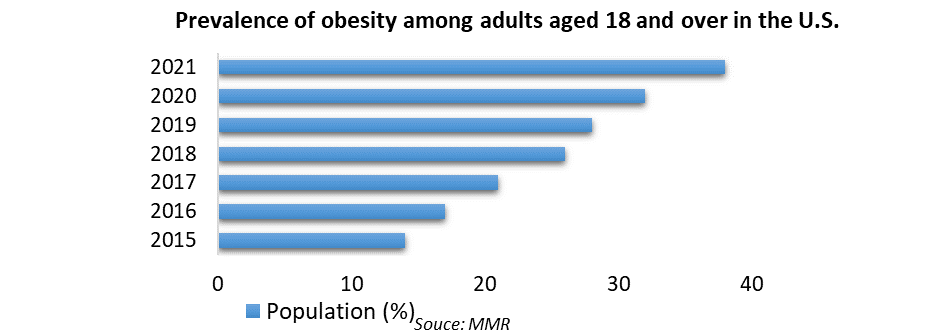
Digital therapeutics play an essential role in the treatment of obesity. Digital health is crucial in the development of a new strategy for obesity prevention and treatment that understands the complexities of obesity and delivers a more patient-centered, precise approach to obesity care. Telehealth and mHealth are already widely utilized in healthcare delivery, and they present new potential to lower obstacles to effective obesity care, enhance access to care, and, ultimately, improve long-term weight management and obesity-related health outcomes. The most major digital advancement in obesity care during the forecast period is expected to be the growing use of telehealth. Over time, this will be increasingly supported by mHealth applications and gadgets, with interventions and support being supplied by proxy via an avatar or a chatbot powered by AI technology.

Digital Therapeutics Market Regional Insights:

North American regional market dominated the digital therapeutics market with the highest market share in 2023 and is expected to maintain its dominance at the end of the forecast period. This dominance is due to several factors, including the growing utilization of digital health devices and advantageous reimbursement scenarios that emphasize enhancing quality of life through enhanced tracking and diagnostics. The market is expected to be influenced by an increase in the prevalence of chronic diseases and the region's geriatric population. Proteus Digital Health, Inc., Omada Health, Inc., WellDoc, Inc., and Livongo Health, Inc. are some of the leading firms in this region. The majority of these organizations are headquartered in the United States, which contributes to their local dominance. In addition, the rising emergence of new startups, the evolving reimbursement system for digital medicines, and investments in digital therapeutics are increasing and increasing government initiatives to support technical development. The United States would be the dominant country in the market during the forecast period due to reasons such as an increasing elderly generation, an increase in chronic diseases among individuals, etc. According to the C.D.C., chronic illness would affect 6 in 10 persons in the United States in January 2021. Every year, these disorders cost the country's healthcare system over USD 3.8 trillion in healthcare expenses.Digital Therapeutics MarketIn the United States, the Federal government adopted a new rule in 2020 that allows all medical professionals to practice beyond state boundaries, hence increasing access to treatment and providing a bigger supply of healthcare providers for digital health enterprises. This, in combination with higher reimbursement rates for telehealth set by CMS (Centers for Medicare & Medicaid Services), should help solve the problem of insufficient numbers of medical professionals using DTx platforms. The Asia Pacific region is expected to grow at the highest growth rate of about 19.8% during the forecast period. This significant growth can be attributed to increased demand for effective healthcare, increased adoption of smartphones, and enhanced internet connectivity. As a result of increasing government expenditure on healthcare, demand for personal care devices and related services is expected to increase the market growth.

Digital Therapeutics Industry EcosystemDigital Therapeutics Industry Ecosystem

Digital Therapeutics Market Scope: Inquire before buying

Global Digital Therapeutics Market
Report Coverage Details
Base Year: 2024 Forecast Period: 2025-2032
Historical Data: 2019 to 2024 Market Size in 2024: USD 5 Bn.
Forecast Period 2025 to 2032 CAGR: 4.5% Market Size in 2032: USD 10 Bn.
Segments Covered: by Product Type Software-only Digital Therapeutics Device-based Digital Therapeutics
by Sales Channel Business-to-Consumer (B2C) Business-to-Business (B2B)
by Application Preventive Applications Prediabetes   Obesity   Nutrition   Lifestyle Management   Other Preventive Applications Treatment/Care-related Applications Diabetes   CNS Disorders   Chronic Respiratory Disorders   Musculoskeletal Disorders   Cardiovascular Diseases   Smoking Cessation   Medication Adherence   Gastrointestinal Disorders   Substance Use & Addiction Management   Rehabilitation & Patient Care   Other
by End-User Patients Providers (Hospitals/Clinics) Payers (Insurance Companies) Pharmaceutical Companies Employers

Digital Therapeutics Market, by Region

North America (United States, Canada and Mexico) Europe (UK, France, Germany, Italy, Spain, Sweden, Austria, Turkey, Russia and Rest of Europe) Asia Pacific (China, India, Japan, South Korea, Australia, ASEAN and Rest of APAC) Middle East and Africa (South Africa, GCC, Egypt, Nigeria and Rest of ME&A) South America (Brazil, Argentina, Columbia and Rest of South America)

Digital Therapeutics Market, Key Players are:

1. Noom(US) 2. Livongo Health(US) 3. Omada Health(US) 4. Virta Health(US) 5. Cognoa(US) 6. Ayogo Health(US) 7. Mindstrong Health(US) 8. 2Morrow(US) 9. Hinge Health(US) 10. BehaVR(US) 11. WellDoc(US) 12. Pear Therapeutics(US) 13. Proteus Digital Health(US) 14. Propeller Health(US) 15. Akili Interactive Labs(US) 16. Better Therapeutics(US) 17. Happify(US) 18. Kaia Health(US) 19. Mango Health(US) 20. Click Therapeutics(US) 21. Canary Health(US) 22. Wellthy Therapeutics(India) 23. Ginger( Australia) 24. Mindable Health(Germany) 25. Doktor.se( Sweden)

FAQs:

1. What is the major driver for the Digital Therapeutics market growth? Ans. The rising smartphone prevalence in developed and emerging nations, the cost-effectiveness of digital health technology for providers and patients, and the rising demand for integrated healthcare systems and patient-centric treatment are expected to be a major driver for market growth. 2. What are the restraints in the Digital Therapeutics market? Ans. Growing concerns about data privacy are the key factors for restraining market growth. 3. Which region is expected to lead the global Digital Therapeutics market during the forecast period? Ans. The North American market is expected to lead the global Digital Therapeutics market during the forecast period due to the growing utilization of digital health devices and advantageous reimbursement scenarios that emphasize enhancing quality of life through enhanced tracking and diagnostics. 4. What is the projected market size & growth rate of the Digital Therapeutics Market? Ans. Digital Therapeutics Market size was valued at USD 7.89 Bn. in 2024 and the total Digital Therapeutics revenue is expected to grow at a CAGR of 27.1% from 2025 to 2032, reaching nearly USD 54.11 Bn. 5. What segments are covered in the Digital Therapeutics Market report? Ans. The segments covered are Sales Channel, Component, Application, and Region.
1. Digital Therapeutics Market Introduction 1.1. Study Assumption and Market Definition 1.2. Scope of the Study 1.3. Executive Summary 2. Global Digital Therapeutics Market: Competitive Landscape 2.1. MMR Competition Matrix 2.2. Competitive Landscape 2.3. Key Players Benchmarking 2.3.1. Company Name 2.3.2. Business Segment 2.3.3. End-user Segment 2.3.4. Revenue (2024) 2.3.5. Company Locations 2.4. Leading Digital Therapeutics Market Companies, by market capitalization 2.5. Market Structure 2.5.1. Market Leaders 2.5.2. Market Followers 2.5.3. Emerging Players 2.6. Mergers and Acquisitions Details 3. Digital Therapeutics Market: Dynamics 3.1. Digital Therapeutics Market Trends by Region 3.1.1. North America Digital Therapeutics Market Trends 3.1.2. Europe Digital Therapeutics Market Trends 3.1.3. Asia Pacific Digital Therapeutics Market Trends 3.1.4. Middle East and Africa Digital Therapeutics Market Trends 3.1.5. South America Digital Therapeutics Market Trends 3.2. Digital Therapeutics Market Dynamics by Region 3.2.1. North America 3.2.1.1. North America Digital Therapeutics Market Drivers 3.2.1.2. North America Digital Therapeutics Market Restraints 3.2.1.3. North America Digital Therapeutics Market Opportunities 3.2.1.4. North America Digital Therapeutics Market Challenges 3.2.2. Europe 3.2.2.1. Europe Digital Therapeutics Market Drivers 3.2.2.2. Europe Digital Therapeutics Market Restraints 3.2.2.3. Europe Digital Therapeutics Market Opportunities 3.2.2.4. Europe Digital Therapeutics Market Challenges 3.2.3. Asia Pacific 3.2.3.1. Asia Pacific Digital Therapeutics Market Drivers 3.2.3.2. Asia Pacific Digital Therapeutics Market Restraints 3.2.3.3. Asia Pacific Digital Therapeutics Market Opportunities 3.2.3.4. Asia Pacific Digital Therapeutics Market Challenges 3.2.4. Middle East and Africa 3.2.4.1. Middle East and Africa Digital Therapeutics Market Drivers 3.2.4.2. Middle East and Africa Digital Therapeutics Market Restraints 3.2.4.3. Middle East and Africa Digital Therapeutics Market Opportunities 3.2.4.4. Middle East and Africa Digital Therapeutics Market Challenges 3.2.5. South America 3.2.5.1. South America Digital Therapeutics Market Drivers 3.2.5.2. South America Digital Therapeutics Market Restraints 3.2.5.3. South America Digital Therapeutics Market Opportunities 3.2.5.4. South America Digital Therapeutics Market Challenges 3.3. PORTER’s Five Forces Analysis 3.4. PESTLE Analysis 3.5. Technology Roadmap 3.6. Regulatory Landscape by Region 3.6.1. North America 3.6.2. Europe 3.6.3. Asia Pacific 3.6.4. Middle East and Africa 3.6.5. South America 3.7. Key Opinion Leader Analysis For Digital Therapeutics Industry 3.8. Analysis of Government Schemes and Initiatives For Digital Therapeutics Industry 3.9. Digital Therapeutics Market Trade Analysis 3.10. The Global Pandemic Impact on Digital Therapeutics Market 4. Digital Therapeutics Market: Global Market Size and Forecast by Segmentation by Demand and Supply Side (by Value in USD Million) 2024-2032 4.1. Digital Therapeutics Market Size and Forecast, by Product Type (2024-2032) 4.1.1. Software-only Digital Therapeutics 4.1.2. Device-based Digital Therapeutics 4.2. Digital Therapeutics Market Size and Forecast, by Sales Channel (2024-2032) 4.2.1. Business-to-Consumer (B2C) 4.2.2. Business-to-Business (B2B) 4.3. Digital Therapeutics Market Size and Forecast, by Application (2024-2032) 4.3.1. Preventive Applications 4.3.2. Treatment/Care-related Applications 4.4. Digital Therapeutics Market Size and Forecast, by End User (2024-2032) 4.4.1. Patients 4.4.2. Providers (Hospitals/Clinics) 4.4.3. Payers (Insurance Companies) 4.4.4. Pharmaceutical Companies 4.4.5. Employers 4.5. Digital Therapeutics Market Size and Forecast, by Region (2024-2032) 4.5.1. North America 4.5.2. Europe 4.5.3. Asia Pacific 4.5.4. Middle East and Africa 4.5.5. South America 5. North America Digital Therapeutics Market Size and Forecast by Segmentation (by Value in USD Million) 2024-2032 5.1. North America Digital Therapeutics Market Size and Forecast, by Product Type (2024-2032) 5.1.1. Software-only Digital Therapeutics 5.1.2. Device-based Digital Therapeutics 5.2. North America Digital Therapeutics Market Size and Forecast, by Sales Channel (2024-2032) 5.2.1. Business-to-Consumer (B2C) 5.2.2. Business-to-Business (B2B) 5.3. North America Digital Therapeutics Market Size and Forecast, by Application (2024-2032) 5.3.1. Preventive Applications 5.3.2. Treatment/Care-related Applications 5.4. North America Digital Therapeutics Market Size and Forecast, by End User (2024-2032) 5.4.1. Patients 5.4.2. Providers (Hospitals/Clinics) 5.4.3. Payers (Insurance Companies) 5.4.4. Pharmaceutical Companies 5.4.5. Employers 5.5. North America Digital Therapeutics Market Size and Forecast, by Country (2024-2032) 5.5.1. United States 5.5.1.1. United States Digital Therapeutics Market Size and Forecast, by Product Type (2024-2032) 5.5.1.1.1. Software-only Digital Therapeutics 5.5.1.1.2. Device-based Digital Therapeutics 5.5.1.2. United States Digital Therapeutics Market Size and Forecast, by Sales Channel (2024-2032) 5.5.1.2.1. Business-to-Consumer (B2C) 5.5.1.2.2. Business-to-Business (B2B) 5.5.1.3. United States Digital Therapeutics Market Size and Forecast, by Application (2024-2032) 5.5.1.3.1. Preventive Applications 5.5.1.3.2. Treatment/Care-related Applications 5.5.1.4. United States Digital Therapeutics Market Size and Forecast, by End User (2024-2032) 5.5.1.4.1. Patients 5.5.1.4.2. Providers (Hospitals/Clinics) 5.5.1.4.3. Payers (Insurance Companies) 5.5.1.4.4. Pharmaceutical Companies 5.5.1.4.5. Employers 5.5.2. Canada 5.5.2.1. Canada Digital Therapeutics Market Size and Forecast, by Product Type (2024-2032) 5.5.2.1.1. Software-only Digital Therapeutics 5.5.2.1.2. Device-based Digital Therapeutics 5.5.2.2. Canada Digital Therapeutics Market Size and Forecast, by Sales Channel (2024-2032) 5.5.2.2.1. Business-to-Consumer (B2C) 5.5.2.2.2. Business-to-Business (B2B) 5.5.2.3. Canada Digital Therapeutics Market Size and Forecast, by Application (2024-2032) 5.5.2.3.1. Preventive Applications 5.5.2.3.2. Treatment/Care-related Applications 5.5.2.4. Canada Digital Therapeutics Market Size and Forecast, by End User (2024-2032) 5.5.2.4.1. Patients 5.5.2.4.2. Providers (Hospitals/Clinics) 5.5.2.4.3. Payers (Insurance Companies) 5.5.2.4.4. Pharmaceutical Companies 5.5.2.4.5. Employers 5.5.3. Mexico 5.5.3.1. Mexico Digital Therapeutics Market Size and Forecast, by Product Type (2024-2032) 5.5.3.1.1. Software-only Digital Therapeutics 5.5.3.1.2. Device-based Digital Therapeutics 5.5.3.2. Mexico Digital Therapeutics Market Size and Forecast, by Sales Channel (2024-2032) 5.5.3.2.1. Business-to-Consumer (B2C) 5.5.3.2.2. Business-to-Business (B2B) 5.5.3.3. Mexico Digital Therapeutics Market Size and Forecast, by Application (2024-2032) 5.5.3.3.1. Preventive Applications 5.5.3.3.2. Treatment/Care-related Applications 5.5.3.4. Mexico Digital Therapeutics Market Size and Forecast, by End User (2024-2032) 5.5.3.4.1. Patients 5.5.3.4.2. Providers (Hospitals/Clinics) 5.5.3.4.3. Payers (Insurance Companies) 5.5.3.4.4. Pharmaceutical Companies 5.5.3.4.5. Employers 6. Europe Digital Therapeutics Market Size and Forecast by Segmentation (by Value in USD Million) 2024-2032 6.1. Europe Digital Therapeutics Market Size and Forecast, by Product Type (2024-2032) 6.2. Europe Digital Therapeutics Market Size and Forecast, by Sales Channel (2024-2032) 6.3. Europe Digital Therapeutics Market Size and Forecast, by Application (2024-2032) 6.4. Europe Digital Therapeutics Market Size and Forecast, by End User (2024-2032) 6.5. Europe Digital Therapeutics Market Size and Forecast, by Country (2024-2032) 6.5.1. United Kingdom 6.5.1.1. United Kingdom Digital Therapeutics Market Size and Forecast, by Product Type (2024-2032) 6.5.1.2. United Kingdom Digital Therapeutics Market Size and Forecast, by Sales Channel (2024-2032) 6.5.1.3. United Kingdom Digital Therapeutics Market Size and Forecast, by Application (2024-2032) 6.5.1.4. United Kingdom Digital Therapeutics Market Size and Forecast, by End User (2024-2032) 6.5.2. France 6.5.2.1. France Digital Therapeutics Market Size and Forecast, by Product Type (2024-2032) 6.5.2.2. France Digital Therapeutics Market Size and Forecast, by Sales Channel (2024-2032) 6.5.2.3. France Digital Therapeutics Market Size and Forecast, by Application (2024-2032) 6.5.2.4. France Digital Therapeutics Market Size and Forecast, by End User (2024-2032) 6.5.3. Germany 6.5.3.1. Germany Digital Therapeutics Market Size and Forecast, by Product Type (2024-2032) 6.5.3.2. Germany Digital Therapeutics Market Size and Forecast, by Sales Channel (2024-2032) 6.5.3.3. Germany Digital Therapeutics Market Size and Forecast, by Application (2024-2032) 6.5.3.4. Germany Digital Therapeutics Market Size and Forecast, by End User (2024-2032) 6.5.4. Italy 6.5.4.1. Italy Digital Therapeutics Market Size and Forecast, by Product Type (2024-2032) 6.5.4.2. Italy Digital Therapeutics Market Size and Forecast, by Sales Channel (2024-2032) 6.5.4.3. Italy Digital Therapeutics Market Size and Forecast, by Application (2024-2032) 6.5.4.4. Italy Digital Therapeutics Market Size and Forecast, by End User (2024-2032) 6.5.5. Spain 6.5.5.1. Spain Digital Therapeutics Market Size and Forecast, by Product Type (2024-2032) 6.5.5.2. Spain Digital Therapeutics Market Size and Forecast, by Sales Channel (2024-2032) 6.5.5.3. Spain Digital Therapeutics Market Size and Forecast, by Application (2024-2032) 6.5.5.4. Spain Digital Therapeutics Market Size and Forecast, by End User (2024-2032) 6.5.6. Sweden 6.5.6.1. Sweden Digital Therapeutics Market Size and Forecast, by Product Type (2024-2032) 6.5.6.2. Sweden Digital Therapeutics Market Size and Forecast, by Sales Channel (2024-2032) 6.5.6.3. Sweden Digital Therapeutics Market Size and Forecast, by Application (2024-2032) 6.5.6.4. Sweden Digital Therapeutics Market Size and Forecast, by End User (2024-2032) 6.5.7. Austria 6.5.7.1. Austria Digital Therapeutics Market Size and Forecast, by Product Type (2024-2032) 6.5.7.2. Austria Digital Therapeutics Market Size and Forecast, by Sales Channel (2024-2032) 6.5.7.3. Austria Digital Therapeutics Market Size and Forecast, by Application (2024-2032) 6.5.7.4. Austria Digital Therapeutics Market Size and Forecast, by End User (2024-2032) 6.5.8. Rest of Europe 6.5.8.1. Rest of Europe Digital Therapeutics Market Size and Forecast, by Product Type (2024-2032) 6.5.8.2. Rest of Europe Digital Therapeutics Market Size and Forecast, by Sales Channel (2024-2032) 6.5.8.3. Rest of Europe Digital Therapeutics Market Size and Forecast, by Application (2024-2032) 6.5.8.4. Rest of Europe Digital Therapeutics Market Size and Forecast, by End User (2024-2032) 7. Asia Pacific Digital Therapeutics Market Size and Forecast by Segmentation (by Value in USD Million) 2024-2032 7.1. Asia Pacific Digital Therapeutics Market Size and Forecast, by Product Type (2024-2032) 7.2. Asia Pacific Digital Therapeutics Market Size and Forecast, by Sales Channel (2024-2032) 7.3. Asia Pacific Digital Therapeutics Market Size and Forecast, by Application (2024-2032) 7.4. Asia Pacific Digital Therapeutics Market Size and Forecast, by End User (2024-2032) 7.5. Asia Pacific Digital Therapeutics Market Size and Forecast, by Country (2024-2032) 7.5.1. China 7.5.1.1. China Digital Therapeutics Market Size and Forecast, by Product Type (2024-2032) 7.5.1.2. China Digital Therapeutics Market Size and Forecast, by Sales Channel (2024-2032) 7.5.1.3. China Digital Therapeutics Market Size and Forecast, by Application (2024-2032) 7.5.1.4. China Digital Therapeutics Market Size and Forecast, by End User (2024-2032) 7.5.2. S Korea 7.5.2.1. S Korea Digital Therapeutics Market Size and Forecast, by Product Type (2024-2032) 7.5.2.2. S Korea Digital Therapeutics Market Size and Forecast, by Sales Channel (2024-2032) 7.5.2.3. S Korea Digital Therapeutics Market Size and Forecast, by Application (2024-2032) 7.5.2.4. S Korea Digital Therapeutics Market Size and Forecast, by End User (2024-2032) 7.5.3. Japan 7.5.3.1. Japan Digital Therapeutics Market Size and Forecast, by Product Type (2024-2032) 7.5.3.2. Japan Digital Therapeutics Market Size and Forecast, by Sales Channel (2024-2032) 7.5.3.3. Japan Digital Therapeutics Market Size and Forecast, by Application (2024-2032) 7.5.3.4. Japan Digital Therapeutics Market Size and Forecast, by End User (2024-2032) 7.5.4. India 7.5.4.1. India Digital Therapeutics Market Size and Forecast, by Product Type (2024-2032) 7.5.4.2. India Digital Therapeutics Market Size and Forecast, by Sales Channel (2024-2032) 7.5.4.3. India Digital Therapeutics Market Size and Forecast, by Application (2024-2032) 7.5.4.4. India Digital Therapeutics Market Size and Forecast, by End User (2024-2032) 7.5.5. Australia 7.5.5.1. Australia Digital Therapeutics Market Size and Forecast, by Product Type (2024-2032) 7.5.5.2. Australia Digital Therapeutics Market Size and Forecast, by Sales Channel (2024-2032) 7.5.5.3. Australia Digital Therapeutics Market Size and Forecast, by Application (2024-2032) 7.5.5.4. Australia Digital Therapeutics Market Size and Forecast, by End User (2024-2032) 7.5.6. Indonesia 7.5.6.1. Indonesia Digital Therapeutics Market Size and Forecast, by Product Type (2024-2032) 7.5.6.2. Indonesia Digital Therapeutics Market Size and Forecast, by Sales Channel (2024-2032) 7.5.6.3. Indonesia Digital Therapeutics Market Size and Forecast, by Application (2024-2032) 7.5.6.4. Indonesia Digital Therapeutics Market Size and Forecast, by End User (2024-2032) 7.5.7. Malaysia 7.5.7.1. Malaysia Digital Therapeutics Market Size and Forecast, by Product Type (2024-2032) 7.5.7.2. Malaysia Digital Therapeutics Market Size and Forecast, by Sales Channel (2024-2032) 7.5.7.3. Malaysia Digital Therapeutics Market Size and Forecast, by Application (2024-2032) 7.5.7.4. Malaysia Digital Therapeutics Market Size and Forecast, by End User (2024-2032) 7.5.8. Vietnam 7.5.8.1. Vietnam Digital Therapeutics Market Size and Forecast, by Product Type (2024-2032) 7.5.8.2. Vietnam Digital Therapeutics Market Size and Forecast, by Sales Channel (2024-2032) 7.5.8.3. Vietnam Digital Therapeutics Market Size and Forecast, by Application (2024-2032) 7.5.8.4. Vietnam Digital Therapeutics Market Size and Forecast, by End User (2024-2032) 7.5.9. Taiwan 7.5.9.1. Taiwan Digital Therapeutics Market Size and Forecast, by Product Type (2024-2032) 7.5.9.2. Taiwan Digital Therapeutics Market Size and Forecast, by Sales Channel (2024-2032) 7.5.9.3. Taiwan Digital Therapeutics Market Size and Forecast, by Application (2024-2032) 7.5.9.4. Taiwan Digital Therapeutics Market Size and Forecast, by End User (2024-2032) 7.5.10. Rest of Asia Pacific 7.5.10.1. Rest of Asia Pacific Digital Therapeutics Market Size and Forecast, by Product Type (2024-2032) 7.5.10.2. Rest of Asia Pacific Digital Therapeutics Market Size and Forecast, by Sales Channel (2024-2032) 7.5.10.3. Rest of Asia Pacific Digital Therapeutics Market Size and Forecast, by Application (2024-2032) 7.5.10.4. Rest of Asia Pacific Digital Therapeutics Market Size and Forecast, by End User (2024-2032) 8. Middle East and Africa Digital Therapeutics Market Size and Forecast by Segmentation (by Value in USD Million) 2024-2032 8.1. Middle East and Africa Digital Therapeutics Market Size and Forecast, by Product Type (2024-2032) 8.2. Middle East and Africa Digital Therapeutics Market Size and Forecast, by Sales Channel (2024-2032) 8.3. Middle East and Africa Digital Therapeutics Market Size and Forecast, by Application (2024-2032) 8.4. Middle East and Africa Digital Therapeutics Market Size and Forecast, by End User (2024-2032) 8.5. Middle East and Africa Digital Therapeutics Market Size and Forecast, by Country (2024-2032) 8.5.1. South Africa 8.5.1.1. South Africa Digital Therapeutics Market Size and Forecast, by Product Type (2024-2032) 8.5.1.2. South Africa Digital Therapeutics Market Size and Forecast, by Sales Channel (2024-2032) 8.5.1.3. South Africa Digital Therapeutics Market Size and Forecast, by Application (2024-2032) 8.5.1.4. South Africa Digital Therapeutics Market Size and Forecast, by End User (2024-2032) 8.5.2. GCC 8.5.2.1. GCC Digital Therapeutics Market Size and Forecast, by Product Type (2024-2032) 8.5.2.2. GCC Digital Therapeutics Market Size and Forecast, by Sales Channel (2024-2032) 8.5.2.3. GCC Digital Therapeutics Market Size and Forecast, by Application (2024-2032) 8.5.2.4. GCC Digital Therapeutics Market Size and Forecast, by End User (2024-2032) 8.5.3. Nigeria 8.5.3.1. Nigeria Digital Therapeutics Market Size and Forecast, by Product Type (2024-2032) 8.5.3.2. Nigeria Digital Therapeutics Market Size and Forecast, by Sales Channel (2024-2032) 8.5.3.3. Nigeria Digital Therapeutics Market Size and Forecast, by Application (2024-2032) 8.5.3.4. Nigeria Digital Therapeutics Market Size and Forecast, by End User (2024-2032) 8.5.4. Rest of ME&A 8.5.4.1. Rest of ME&A Digital Therapeutics Market Size and Forecast, by Product Type (2024-2032) 8.5.4.2. Rest of ME&A Digital Therapeutics Market Size and Forecast, by Sales Channel (2024-2032) 8.5.4.3. Rest of ME&A Digital Therapeutics Market Size and Forecast, by Application (2024-2032) 8.5.4.4. Rest of ME&A Digital Therapeutics Market Size and Forecast, by End User (2024-2032) 9. South America Digital Therapeutics Market Size and Forecast by Segmentation (by Value in USD Million) 2024-2032 9.1. South America Digital Therapeutics Market Size and Forecast, by Product Type (2024-2032) 9.2. South America Digital Therapeutics Market Size and Forecast, by Sales Channel (2024-2032) 9.3. South America Digital Therapeutics Market Size and Forecast, by Application(2024-2032) 9.4. South America Digital Therapeutics Market Size and Forecast, by End User (2024-2032) 9.5. South America Digital Therapeutics Market Size and Forecast, by Country (2024-2032) 9.5.1. Brazil 9.5.1.1. Brazil Digital Therapeutics Market Size and Forecast, by Product Type (2024-2032) 9.5.1.2. Brazil Digital Therapeutics Market Size and Forecast, by Sales Channel (2024-2032) 9.5.1.3. Brazil Digital Therapeutics Market Size and Forecast, by Application (2024-2032) 9.5.1.4. Brazil Digital Therapeutics Market Size and Forecast, by End User (2024-2032) 9.5.2. Argentina 9.5.2.1. Argentina Digital Therapeutics Market Size and Forecast, by Product Type (2024-2032) 9.5.2.2. Argentina Digital Therapeutics Market Size and Forecast, by Sales Channel (2024-2032) 9.5.2.3. Argentina Digital Therapeutics Market Size and Forecast, by Application (2024-2032) 9.5.2.4. Argentina Digital Therapeutics Market Size and Forecast, by End User (2024-2032) 9.5.3. Rest Of South America 9.5.3.1. Rest Of South America Digital Therapeutics Market Size and Forecast, by Product Type (2024-2032) 9.5.3.2. Rest Of South America Digital Therapeutics Market Size and Forecast, by Sales Channel (2024-2032) 9.5.3.3. Rest Of South America Digital Therapeutics Market Size and Forecast, by Application (2024-2032) 9.5.3.4. Rest Of South America Digital Therapeutics Market Size and Forecast, by End User (2024-2032) 10. Company Profile: Key Players 10.1. Noom(US) 10.1.1. Company Overview 10.1.2. Business Portfolio 10.1.3. Financial Overview 10.1.4. SWOT Analysis 10.1.5. Strategic Analysis 10.1.6. Scale of Operation (small, medium, and large) 10.1.7. Details on Partnership 10.1.8. Regulatory Accreditations and Certifications Received by Them 10.1.9. Awards Received by the Firm 10.1.10. Recent Developments 10.2. Livongo Health (US) 10.3. Omada Health (US) 10.4. Virta Health (US) 10.5. Cognoa(US) 10.6. Ayogo Health (US) 10.7. Mindstrong Health (US) 10.8. 2Morrow (US) 10.9. Hinge Health (US) 10.10. BehaVR(US) 10.11. WellDoc(US) 10.12. Pear Therapeutics (US) 10.13. Proteus Digital Health (US) 10.14. Propeller Health (US) 10.15. Akili Interactive Labs (US) 10.16. Better Therapeutics (US) 10.17. Happify (US) 10.18. Kaia Health (US) 10.19. Mango Health (US) 10.20. Click Therapeutics (US) 10.21. Canary Health (US) 10.22. Wellthy Therapeutics (India) 10.23. Ginger (Australia) 10.24. Mindable Health (Germany) 10.25. Doktor.se (Sweden) 11. Key Findings 12. Industry Recommendations 13. Digital Therapeutics Market: Research Methodology 14. Terms and Glossary
  • INQUIRE BEFORE BUYING
MMRLogo
America's Fastest Growing Market Research Firm