1. Collaboration Display Market Introduction
1.1. Study Assumption and Market Definition
1.2. Scope of the Study
1.3. Executive Summary
2. Global Collaboration Display Market: Competitive Landscape
2.1. MMR Competition Matrix
2.2. Competitive Landscape
2.3. Key Players Benchmarking
2.3.1. Company Name
2.3.2. Business Segment
2.3.3. End-user Segment
2.3.4. Revenue (2025)
2.3.5. Company Locations
2.4. Leading Collaboration Display Market Companies, by market capitalization
2.5. Market Structure
2.5.1. Market Leaders
2.5.2. Market Followers
2.5.3. Emerging Players
2.6. Mergers and Acquisitions Details
3. Collaboration Display Market: Dynamics
3.1. Collaboration Display Market Trends by Region
3.1.1. North America Collaboration Display Market Trends
3.1.2. Europe Collaboration Display Market Trends
3.1.3. Asia Pacific Collaboration Display Market Trends
3.1.4. Middle East and Africa Collaboration Display Market Trends
3.1.5. South America Collaboration Display Market Trends
3.2. Collaboration Display Market Dynamics by Region
3.2.1. North America
3.2.1.1. North America Collaboration Display Market Drivers
3.2.1.2. North America Collaboration Display Market Restraints
3.2.1.3. North America Collaboration Display Market Opportunities
3.2.1.4. North America Collaboration Display Market Challenges
3.2.2. Europe
3.2.2.1. Europe Collaboration Display Market Drivers
3.2.2.2. Europe Collaboration Display Market Restraints
3.2.2.3. Europe Collaboration Display Market Opportunities
3.2.2.4. Europe Collaboration Display Market Challenges
3.2.3. Asia Pacific
3.2.3.1. Asia Pacific Collaboration Display Market Drivers
3.2.3.2. Asia Pacific Collaboration Display Market Restraints
3.2.3.3. Asia Pacific Collaboration Display Market Opportunities
3.2.3.4. Asia Pacific Collaboration Display Market Challenges
3.2.4. Middle East and Africa
3.2.4.1. Middle East and Africa Collaboration Display Market Drivers
3.2.4.2. Middle East and Africa Collaboration Display Market Restraints
3.2.4.3. Middle East and Africa Collaboration Display Market Opportunities
3.2.4.4. Middle East and Africa Collaboration Display Market Challenges
3.2.5. South America
3.2.5.1. South America Collaboration Display Market Drivers
3.2.5.2. South America Collaboration Display Market Restraints
3.2.5.3. South America Collaboration Display Market Opportunities
3.2.5.4. South America Collaboration Display Market Challenges
3.3. PORTER's Five Forces Analysis
3.4. PESTLE Analysis
3.5. Technology Roadmap
3.6. Regulatory Landscape by Region
3.6.1. North America
3.6.2. Europe
3.6.3. Asia Pacific
3.6.4. Middle East and Africa
3.6.5. South America
3.7. Key Opinion Leader Analysis For Collaboration Display Industry
3.8. Analysis of Government Schemes and Initiatives For Collaboration Display Industry
3.9. Collaboration Display Market Trade Analysis
3.10. The Global Pandemic Impact on Collaboration Display Market
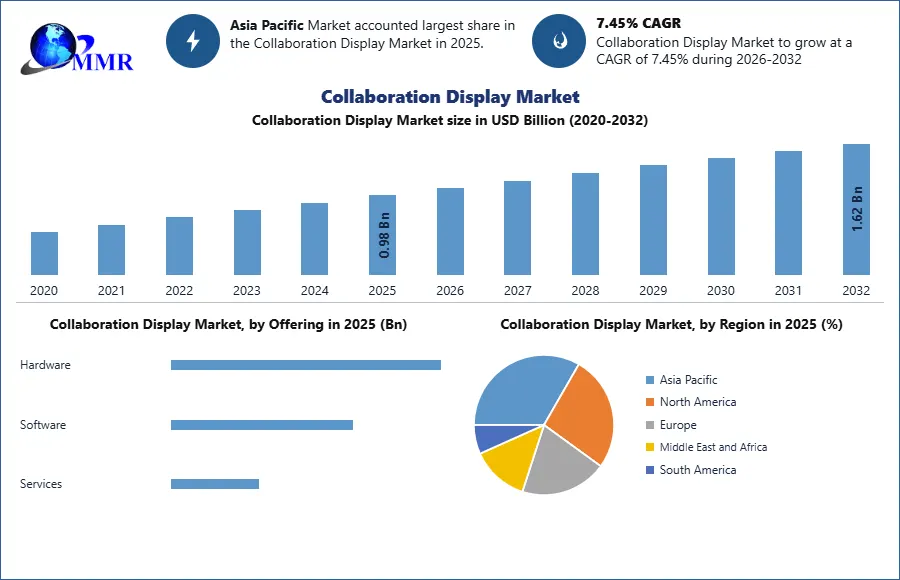
4. Collaboration Display Market: Global Market Size and Forecast by Segmentation (in USD Billion) 2025-2032
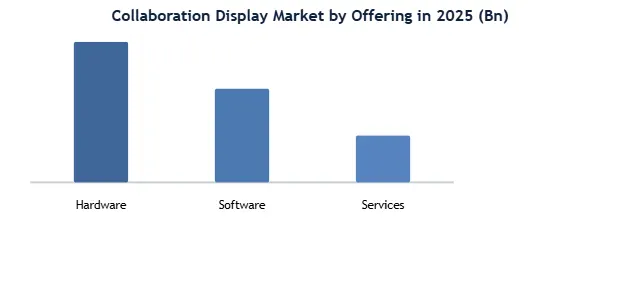
4.1. Collaboration Display Market Size and Forecast, by Offering (2025-2032)
4.1.1. Hardware
4.1.2. Software
4.1.3. Services
4.2. Collaboration Display Market Size and Forecast, by Resolution (2025-2032)
4.2.1. 4K / UHD
4.2.2. 1080p
4.3. Collaboration Display Market Size and Forecast, by Application (2025-2032)
4.3.1. Large Meeting Rooms
4.3.2. Huddle Rooms
4.3.3. Classrooms
4.3.4. Open Layouts
4.3.5. Offices
4.3.6. Others
4.4. Collaboration Display Market Size and Forecast, by End-User (2025-2032)
4.4.1. Corporate Offices
4.4.2. Educational Institutions
4.4.3. Government Organizations
4.4.4. Others
4.5. Collaboration Display Market Size and Forecast, by Region (2025-2032)
4.5.1. North America
4.5.2. Europe
4.5.3. Asia Pacific
4.5.4. Middle East and Africa
4.5.5. South America
5. North America Collaboration Display Market Size and Forecast by Segmentation (in USD Billion) 2025-2032
5.1. North America Collaboration Display Market Size and Forecast, by Offering (2025-2032)
5.1.1. Hardware
5.1.2. Software
5.1.3. Services
5.2. North America Collaboration Display Market Size and Forecast, by Resolution (2025-2032)
5.2.1. 4K / UHD
5.2.2. 1080p
5.3. North America Collaboration Display Market Size and Forecast, by Application (2025-2032)
5.3.1. Large Meeting Rooms
5.3.2. Huddle Rooms
5.3.3. Classrooms
5.3.4. Open Layouts
5.3.5. Offices
5.3.6. Others
5.4. North America Collaboration Display Market Size and Forecast, by End-User (2025-2032)
5.4.1. Corporate Offices
5.4.2. Educational Institutions
5.4.3. Government Organizations
5.4.4. Others
5.5. North America Collaboration Display Market Size and Forecast, by Country (2025-2032)
5.5.1. United States
5.5.1.1. United States Collaboration Display Market Size and Forecast, by Offering (2025-2032)
5.5.1.1.1. Hardware
5.5.1.1.2. Software
5.5.1.1.3. Services
5.5.1.2. United States Collaboration Display Market Size and Forecast, by Resolution (2025-2032)
5.5.1.2.1. 4K / UHD
5.5.1.2.2. 1080p
5.5.1.3. United States Collaboration Display Market Size and Forecast, by Application (2025-2032)
5.5.1.3.1. Large Meeting Rooms
5.5.1.3.2. Huddle Rooms
5.5.1.3.3. Classrooms
5.5.1.3.4. Open Layouts
5.5.1.3.5. Offices
5.5.1.3.6. Others
5.5.1.4. United States Collaboration Display Market Size and Forecast, by End-User (2025-2032)
5.5.1.4.1. Corporate Offices
5.5.1.4.2. Educational Institutions
5.5.1.4.3. Government Organizations
5.5.1.4.4. Others
5.5.2. Canada
5.5.2.1. Canada Collaboration Display Market Size and Forecast, by Offering (2025-2032)
5.5.2.1.1. Hardware
5.5.2.1.2. Software
5.5.2.1.3. Services
5.5.2.2. Canada Collaboration Display Market Size and Forecast, by Resolution (2025-2032)
5.5.2.2.1. 4K / UHD
5.5.2.2.2. 1080p
5.5.2.3. Canada Collaboration Display Market Size and Forecast, by Application (2025-2032)
5.5.2.3.1. Large Meeting Rooms
5.5.2.3.2. Huddle Rooms
5.5.2.3.3. Classrooms
5.5.2.3.4. Open Layouts
5.5.2.3.5. Offices
5.5.2.3.6. Others
5.5.2.4. Canada Collaboration Display Market Size and Forecast, by End-User (2025-2032)
5.5.2.4.1. Corporate Offices
5.5.2.4.2. Educational Institutions
5.5.2.4.3. Government Organizations
5.5.2.4.4. Others
5.5.3. Mexico
5.5.3.1. Mexico Collaboration Display Market Size and Forecast, by Offering (2025-2032)
5.5.3.1.1. Hardware
5.5.3.1.2. Software
5.5.3.1.3. Services
5.5.3.2. Mexico Collaboration Display Market Size and Forecast, by Resolution (2025-2032)
5.5.3.2.1. 4K / UHD
5.5.3.2.2. 1080p
5.5.3.3. Mexico Collaboration Display Market Size and Forecast, by Application (2025-2032)
5.5.3.3.1. Large Meeting Rooms
5.5.3.3.2. Huddle Rooms
5.5.3.3.3. Classrooms
5.5.3.3.4. Open Layouts
5.5.3.3.5. Offices
5.5.3.3.6. Others
5.5.3.4. Mexico Collaboration Display Market Size and Forecast, by End-User (2025-2032)
5.5.3.4.1. Corporate Offices
5.5.3.4.2. Educational Institutions
5.5.3.4.3. Government Organizations
5.5.3.4.4. Others
6. Europe Collaboration Display Market Size and Forecast by Segmentation (in USD Billion) 2025-2032
6.1. Europe Collaboration Display Market Size and Forecast, by Offering (2025-2032)
6.2. Europe Collaboration Display Market Size and Forecast, by Resolution (2025-2032)
6.3. Europe Collaboration Display Market Size and Forecast, by Application (2025-2032)
6.4. Europe Collaboration Display Market Size and Forecast, by End-User (2025-2032)
6.5. Europe Collaboration Display Market Size and Forecast, by Country (2025-2032)
6.5.1. United Kingdom
6.5.1.1. United Kingdom Collaboration Display Market Size and Forecast, by Offering (2025-2032)
6.5.1.2. United Kingdom Collaboration Display Market Size and Forecast, by Resolution (2025-2032)
6.5.1.3. United Kingdom Collaboration Display Market Size and Forecast, by Application (2025-2032)
6.5.1.4. United Kingdom Collaboration Display Market Size and Forecast, by End-User (2025-2032)
6.5.2. France
6.5.2.1. France Collaboration Display Market Size and Forecast, by Offering (2025-2032)
6.5.2.2. France Collaboration Display Market Size and Forecast, by Resolution (2025-2032)
6.5.2.3. France Collaboration Display Market Size and Forecast, by Application (2025-2032)
6.5.2.4. France Collaboration Display Market Size and Forecast, by End-User (2025-2032)
6.5.3. Germany
6.5.3.1. Germany Collaboration Display Market Size and Forecast, by Offering (2025-2032)
6.5.3.2. Germany Collaboration Display Market Size and Forecast, by Resolution (2025-2032)
6.5.3.3. Germany Collaboration Display Market Size and Forecast, by Application (2025-2032)
6.5.3.4. Germany Collaboration Display Market Size and Forecast, by End-User (2025-2032)
6.5.4. Italy
6.5.4.1. Italy Collaboration Display Market Size and Forecast, by Offering (2025-2032)
6.5.4.2. Italy Collaboration Display Market Size and Forecast, by Resolution (2025-2032)
6.5.4.3. Italy Collaboration Display Market Size and Forecast, by Application (2025-2032)
6.5.4.4. Italy Collaboration Display Market Size and Forecast, by End-User (2025-2032)
6.5.5. Spain
6.5.5.1. Spain Collaboration Display Market Size and Forecast, by Offering (2025-2032)
6.5.5.2. Spain Collaboration Display Market Size and Forecast, by Resolution (2025-2032)
6.5.5.3. Spain Collaboration Display Market Size and Forecast, by Application (2025-2032)
6.5.5.4. Spain Collaboration Display Market Size and Forecast, by End-User (2025-2032)
6.5.6. Sweden
6.5.6.1. Sweden Collaboration Display Market Size and Forecast, by Offering (2025-2032)
6.5.6.2. Sweden Collaboration Display Market Size and Forecast, by Resolution (2025-2032)
6.5.6.3. Sweden Collaboration Display Market Size and Forecast, by Application (2025-2032)
6.5.6.4. Sweden Collaboration Display Market Size and Forecast, by End-User (2025-2032)
6.5.7. Austria
6.5.7.1. Austria Collaboration Display Market Size and Forecast, by Offering (2025-2032)
6.5.7.2. Austria Collaboration Display Market Size and Forecast, by Resolution (2025-2032)
6.5.7.3. Austria Collaboration Display Market Size and Forecast, by Application (2025-2032)
6.5.7.4. Austria Collaboration Display Market Size and Forecast, by End-User (2025-2032)
6.5.8. Rest of Europe
6.5.8.1. Rest of Europe Collaboration Display Market Size and Forecast, by Offering (2025-2032)
6.5.8.2. Rest of Europe Collaboration Display Market Size and Forecast, by Resolution (2025-2032)
6.5.8.3. Rest of Europe Collaboration Display Market Size and Forecast, by Application (2025-2032)
6.5.8.4. Rest of Europe Collaboration Display Market Size and Forecast, by End-User (2025-2032)
7. Asia Pacific Collaboration Display Market Size and Forecast by Segmentation (in USD Billion) 2025-2032
7.1. Asia Pacific Collaboration Display Market Size and Forecast, by Offering (2025-2032)
7.2. Asia Pacific Collaboration Display Market Size and Forecast, by Resolution (2025-2032)
7.3. Asia Pacific Collaboration Display Market Size and Forecast, by Application (2025-2032)
7.4. Asia Pacific Collaboration Display Market Size and Forecast, by End-User (2025-2032)
7.5. Asia Pacific Collaboration Display Market Size and Forecast, by Country (2025-2032)
7.5.1. China
7.5.1.1. China Collaboration Display Market Size and Forecast, by Offering (2025-2032)
7.5.1.2. China Collaboration Display Market Size and Forecast, by Resolution (2025-2032)
7.5.1.3. China Collaboration Display Market Size and Forecast, by Application (2025-2032)
7.5.1.4. China Collaboration Display Market Size and Forecast, by End-User (2025-2032)
7.5.2. S Korea
7.5.2.1. S Korea Collaboration Display Market Size and Forecast, by Offering (2025-2032)
7.5.2.2. S Korea Collaboration Display Market Size and Forecast, by Resolution (2025-2032)
7.5.2.3. S Korea Collaboration Display Market Size and Forecast, by Application (2025-2032)
7.5.2.4. S Korea Collaboration Display Market Size and Forecast, by End-User (2025-2032)
7.5.3. Japan
7.5.3.1. Japan Collaboration Display Market Size and Forecast, by Offering (2025-2032)
7.5.3.2. Japan Collaboration Display Market Size and Forecast, by Resolution (2025-2032)
7.5.3.3. Japan Collaboration Display Market Size and Forecast, by Application (2025-2032)
7.5.3.4. Japan Collaboration Display Market Size and Forecast, by End-User (2025-2032)
7.5.4. India
7.5.4.1. India Collaboration Display Market Size and Forecast, by Offering (2025-2032)
7.5.4.2. India Collaboration Display Market Size and Forecast, by Resolution (2025-2032)
7.5.4.3. India Collaboration Display Market Size and Forecast, by Application (2025-2032)
7.5.4.4. India Collaboration Display Market Size and Forecast, by End-User (2025-2032)
7.5.5. Australia
7.5.5.1. Australia Collaboration Display Market Size and Forecast, by Offering (2025-2032)
7.5.5.2. Australia Collaboration Display Market Size and Forecast, by Resolution (2025-2032)
7.5.5.3. Australia Collaboration Display Market Size and Forecast, by Application (2025-2032)
7.5.5.4. Australia Collaboration Display Market Size and Forecast, by End-User (2025-2032)
7.5.6. Indonesia
7.5.6.1. Indonesia Collaboration Display Market Size and Forecast, by Offering (2025-2032)
7.5.6.2. Indonesia Collaboration Display Market Size and Forecast, by Resolution (2025-2032)
7.5.6.3. Indonesia Collaboration Display Market Size and Forecast, by Application (2025-2032)
7.5.6.4. Indonesia Collaboration Display Market Size and Forecast, by End-User (2025-2032)
7.5.7. Malaysia
7.5.7.1. Malaysia Collaboration Display Market Size and Forecast, by Offering (2025-2032)
7.5.7.2. Malaysia Collaboration Display Market Size and Forecast, by Resolution (2025-2032)
7.5.7.3. Malaysia Collaboration Display Market Size and Forecast, by Application (2025-2032)
7.5.7.4. Malaysia Collaboration Display Market Size and Forecast, by End-User (2025-2032)
7.5.8. Vietnam
7.5.8.1. Vietnam Collaboration Display Market Size and Forecast, by Offering (2025-2032)
7.5.8.2. Vietnam Collaboration Display Market Size and Forecast, by Resolution (2025-2032)
7.5.8.3. Vietnam Collaboration Display Market Size and Forecast, by Application (2025-2032)
7.5.8.4. Vietnam Collaboration Display Market Size and Forecast, by End-User (2025-2032)
7.5.9. Taiwan
7.5.9.1. Taiwan Collaboration Display Market Size and Forecast, by Offering (2025-2032)
7.5.9.2. Taiwan Collaboration Display Market Size and Forecast, by Resolution (2025-2032)
7.5.9.3. Taiwan Collaboration Display Market Size and Forecast, by Application (2025-2032)
7.5.9.4. Taiwan Collaboration Display Market Size and Forecast, by End-User (2025-2032)
7.5.10. Rest of Asia Pacific
7.5.10.1. Rest of Asia Pacific Collaboration Display Market Size and Forecast, by Offering (2025-2032)
7.5.10.2. Rest of Asia Pacific Collaboration Display Market Size and Forecast, by Resolution (2025-2032)
7.5.10.3. Rest of Asia Pacific Collaboration Display Market Size and Forecast, by Application (2025-2032)
7.5.10.4. Rest of Asia Pacific Collaboration Display Market Size and Forecast, by End-User (2025-2032)
8. Middle East and Africa Collaboration Display Market Size and Forecast by Segmentation (in USD Billion) 2025-2032
8.1. Middle East and Africa Collaboration Display Market Size and Forecast, by Offering (2025-2032)
8.2. Middle East and Africa Collaboration Display Market Size and Forecast, by Resolution (2025-2032)
8.3. Middle East and Africa Collaboration Display Market Size and Forecast, by Application (2025-2032)
8.4. Middle East and Africa Collaboration Display Market Size and Forecast, by End-User (2025-2032)
8.5. Middle East and Africa Collaboration Display Market Size and Forecast, by Country (2025-2032)
8.5.1. South Africa
8.5.1.1. South Africa Collaboration Display Market Size and Forecast, by Offering (2025-2032)
8.5.1.2. South Africa Collaboration Display Market Size and Forecast, by Resolution (2025-2032)
8.5.1.3. South Africa Collaboration Display Market Size and Forecast, by Application (2025-2032)
8.5.1.4. South Africa Collaboration Display Market Size and Forecast, by End-User (2025-2032)
8.5.2. GCC
8.5.2.1. GCC Collaboration Display Market Size and Forecast, by Offering (2025-2032)
8.5.2.2. GCC Collaboration Display Market Size and Forecast, by Resolution (2025-2032)
8.5.2.3. GCC Collaboration Display Market Size and Forecast, by Application (2025-2032)
8.5.2.4. GCC Collaboration Display Market Size and Forecast, by End-User (2025-2032)
8.5.3. Nigeria
8.5.3.1. Nigeria Collaboration Display Market Size and Forecast, by Offering (2025-2032)
8.5.3.2. Nigeria Collaboration Display Market Size and Forecast, by Resolution (2025-2032)
8.5.3.3. Nigeria Collaboration Display Market Size and Forecast, by Application (2025-2032)
8.5.3.4. Nigeria Collaboration Display Market Size and Forecast, by End-User (2025-2032)
8.5.4. Rest of ME&A
8.5.4.1. Rest of ME&A Collaboration Display Market Size and Forecast, by Offering (2025-2032)
8.5.4.2. Rest of ME&A Collaboration Display Market Size and Forecast, by Resolution (2025-2032)
8.5.4.3. Rest of ME&A Collaboration Display Market Size and Forecast, by Application (2025-2032)
8.5.4.4. Rest of ME&A Collaboration Display Market Size and Forecast, by End-User (2025-2032)
9. South America Collaboration Display Market Size and Forecast by Segmentation (in USD Billion) 2025-2032
9.1. South America Collaboration Display Market Size and Forecast, by Offering (2025-2032)
9.2. South America Collaboration Display Market Size and Forecast, by Resolution (2025-2032)
9.3. South America Collaboration Display Market Size and Forecast, by Application (2025-2032)
9.4. South America Collaboration Display Market Size and Forecast, by End-User (2025-2032)
9.5. South America Collaboration Display Market Size and Forecast, by Country (2025-2032)
9.5.1. Brazil
9.5.1.1. Brazil Collaboration Display Market Size and Forecast, by Offering (2025-2032)
9.5.1.2. Brazil Collaboration Display Market Size and Forecast, by Resolution (2025-2032)
9.5.1.3. Brazil Collaboration Display Market Size and Forecast, by Application (2025-2032)
9.5.1.4. Brazil Collaboration Display Market Size and Forecast, by End-User (2025-2032)
9.5.2. Argentina
9.5.2.1. Argentina Collaboration Display Market Size and Forecast, by Offering (2025-2032)
9.5.2.2. Argentina Collaboration Display Market Size and Forecast, by Resolution (2025-2032)
9.5.2.3. Argentina Collaboration Display Market Size and Forecast, by Application (2025-2032)
9.5.2.4. Argentina Collaboration Display Market Size and Forecast, by End-User (2025-2032)
9.5.3. Rest Of South America
9.5.3.1. Rest Of South America Collaboration Display Market Size and Forecast, by Offering (2025-2032)
9.5.3.2. Rest Of South America Collaboration Display Market Size and Forecast, by Resolution (2025-2032)
9.5.3.3. Rest Of South America Collaboration Display Market Size and Forecast, by Application (2025-2032)
9.5.3.4. Rest Of South America Collaboration Display Market Size and Forecast, by End-User (2025-2032)
10. Company Profile: Key Players
10.1. Sharp Corporation
10.1.1. Company Overview
10.1.2. Business Portfolio
10.1.3. Financial Overview
10.1.4. SWOT Analysis
10.1.5. Strategic Analysis
10.1.6. Scale of Operation (small, medium, and large)
10.1.7. Details on Partnership
10.1.8. Regulatory Accreditations and Certifications Received by Them
10.1.9. Awards Received by the Firm
10.1.10. Recent Developments
10.2. ViewSonic Corporation
10.3. Cisco Systems Inc.
10.4. Microsoft Corporation
10.5. SMART Technologies ULC
10.6. Google LLC
10.7. LG Electronics
10.8. Samsung Electronics
10.9. Avocor Limited
10.10. IBV Solutions
10.11. BenQ Corporation
10.12. Panasonic Corporation
10.13. Sony Corporation
10.14. Hitachi Ltd.
10.15. Luidia Inc.
10.16. Qomo HiteVision
10.17. Newline Interactive
10.18. Boxlight Corporation
10.19. Promethean World Ltd.
10.20. Barco NV
10.21. Dell Technologies
10.22. HP Inc.
10.23. Lenovo Group Limited
10.24. Ricoh Company Ltd.
10.25. NEC Corporation
11. Key Findings
12. Industry Recommendations
13. Collaboration Display Market: Research Methodology
14. Terms and Glossary

 To know about the Research Methodology :- Request Free Sample Report