
CAR-T Cell Therapy Market– Industry Structure Evaluation, Demand Drivers Analysis, Regional Growth Analysis and Identification, Competitive Positioning Review & Global Market Size Forecast to 2034
Overview
The CAR-T Cell Therapy Market size was valued at USD 6.15 Billion in 2025 and the total CAR-T Cell Therapy revenue is expected to grow at a CAGR of 20.18% from 2026 to 2034, reaching nearly USD 32.16 Billion.
Global CAR-T Cell Therapy Market Overview:
Chimeric antigen receptor (CAR) T-cell therapy is a way to get immune cells called T cells (a type of white blood cell) to fight cancer by changing them in the lab so they can find and destroy cancer cells. CAR T-cell therapy is a type of cell-based gene therapy it involves altering the genes inside T cells to help them attack cancer.
Global CAR-T Cell Therapy Market Dynamics:
Rising prevalence of cancer coupled with high demand for effective treatment to cure cancer is driving the market growth.
Recent studies suggest that over 1.7 million new cancer patients are recorded in U.S. alone and nearly 4.3 million in China. A rising number of adults and children developing cancer is expected to increase demand for effective and reliable therapeutic treatment approach for the improvement of the quality of patient’s lives.
Moreover, the development of new and effective therapy options to cure symptoms of the disease is also contributing to the growth of the CAR-T cell therapy market. Increasing government initiatives for improving health care infrastructure and promoting research for cell therapy in cancer is fueling the growth of the market. In December , the National Cancer Advisory Board authorized US$ 1.8 Bn in funding for Cancer Moonshot, which is an initiative taken up to accelerate research with an aim to make more therapies available to patients with cancer. However, High costs associated with CAR-T therapy and lack of cost-effective therapies for cancer have influenced the health conditions of the population and have led to a low average life expectancy. These factors may hinder the market growth.
The report has profiled eighteen key players in the market from different regions. However, report has considered all market leaders, followers and new entrants with investors while analyzing the market and estimation the size of the same. Increasing R&D activities in each region are different and focus is given on the regional impact on the cost, availability of advanced technology is analyzed and report has come up with recommendations for future hot spot in APAC region.
CAR-T Cell Therapy Market Growth Outlook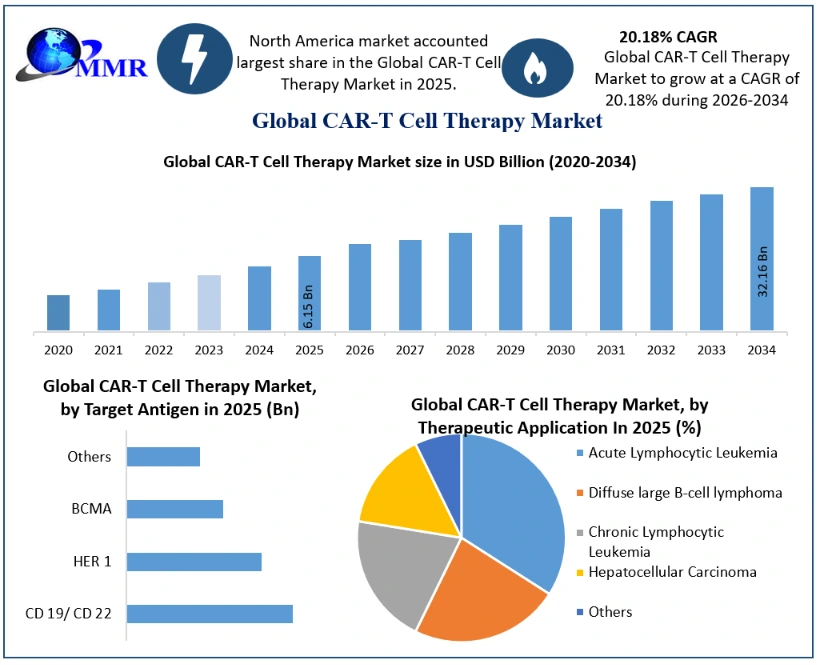
To know about the Research Methodology :- Request Free Sample Report
Global CAR-T Cell Therapy Market Segment Analysis:
The global CAR-T Cell Therapy market is segmented on the basis of Target Antigen, Therapeutic Application and End-Users. Based on Target Antigen, CD19/CD22 target antigens are estimated to hold the largest market share.
The strong growth is creditable to the high approval rate of the antigens and their commercialization. On the other hand, BCMA (B-cell maturation antigen) segment is anticipated to record a robust growth rate growth over the forecasted years. Based on Therapeutic Application, diffuse large B-cell lymphoma is expected to dominate the global market.
It accounted for xx% of the total market share in . The Multiple Myeloma (MM) segment is expected to register a significant growth rate over the forecast period.
CAR-T Cell Therapy Market Regional Insights:
North America dominated the largest CAR-T Cell Therapy Market share in 2025. North America’s market growth is attributed due to the rapid development and launch of new therapies for the treatment of cancer by key players in the market. For instance, in August , the U.S. Food and Drug Administration (FDA) approved Kymriah, a CAR-T cell therapy to treat pediatric and young adult patients suffering from a form of acute lymphoblastic leukemia. Moreover, a large patient pool suffering from cancer in the U.S. and Canada is expected to further fuel the growth of the region in the global market.
For instance, according to the Centers for Disease Control and Prevention (CDC) , around 171,000 patients with blood cancer are diagnosed each year in the U.S. Europe is expected to hold the second-largest market during the forecast period. Asia Pacific is expected to witness lucrative growth during forecast period.
Asia Pacific is expected to exhibit the highest growth over the forecast period, owing to the increasing number of global players collaborating and signing research as well as manufacturing contracts for CAR-T cell therapies with local players in the region. For instance, Cesca Therapeutics signed a license agreement with China-based, Boyalife Group, in March , for CAR-T cell-related bioprocessing, development, and manufacturing outsourcing.
The report also helps in understanding Global CAR-T Cell Therapy Market dynamics, structure by analyzing the market segments and project the Global CAR-T Cell Therapy Market size. Clear representation of competitive analysis of key players by product, price, financial position, product portfolio, growth strategies, and regional presence in the Global CAR-T Cell Therapy Market make the report investor’s guide.
Global CAR-T Cell Therapy Market, Key developments:
| Exact Date | Company | Development | Impact |
|---|---|---|---|
| 12 February 2026 | Novartis | The company reported positive long-term follow-up data for Kymriah® (tisagenlecleucel) in treating relapsed/refractory follicular lymphoma. | This reinforces the durability of response for Kymriah, maintaining its competitive edge in the CAR-T oncology segment. |
| 10 January 2026 | Gilead Sciences (Kite) | Kite inaugurated a new state-of-the-art automated manufacturing facility in the Netherlands dedicated to Yescarta® and Tecartus® production. | This expansion significantly increases production capacity, reducing lead times for patients across European markets. |
| 04 December 2025 | Bristol Myers Squibb | The FDA approved the expansion of Breyanzi® (lisocabtagene maraleucel) for the treatment of relapsed or refractory marginal zone lymphoma. | The approval broadens the therapeutic reach of the therapy to patients who have failed at least two prior treatment lines. |
| 18 November 2025 | Legend Biotech | The company successfully completed a major R&D milestone in their pipeline by initiating a Phase II study for a next-generation CAR-T candidate. | This advancement indicates progress toward overcoming resistance mechanisms and potentially improving patient survival rates. |
CAR-T Cell Therapy Market Ecosystem
Global CAR-T Cell Therapy Market Scope: Inquire before buying
| Global CAR-T Cell Therapy Market | |||
|---|---|---|---|
| Report Coverage | Details | ||
| Base Year: | 2025 | Forecast Period: | 2026-2034 |
| Historical Data: | 2020 to 2025 | Market Size in 2025: | 6.15 USD Billion |
| Forecast Period 2026-2034 CAGR: | 20.18% | Market Size in 2034: | 32.16 USD Billion |
| Segments Covered: | by Target Antigen | CD 19/ CD 22 HER 1 BCMA Others |
|
| by Therapeutic Application | Acute Lymphocytic Leukemia Diffuse large B-cell lymphoma Chronic Lymphocytic Leukemia Hepatocellular Carcinoma Others |
||
| by Disease Indication | Leukemia Lymphoma Multiple Myeloma Others |
||
| by End-Users | Hospitals Cancer Research Institutes Clinics & Ambulatory Centers |
||
Global CAR-T Cell Therapy Market, by Region:
North America (United States, Canada and Mexico)
Europe (UK, France, Germany, Italy, Spain, Sweden, Austria, Turkey, Russia and Rest of Europe)
Asia Pacific (China, India, Japan, South Korea, Australia, ASEAN and Rest of APAC)
Middle East and Africa (South Africa, GCC, Egypt, Nigeria and Rest of ME&A)
South America (Brazil, Argentina, Columbia and Rest of South America)
Global CAR-T Cell Therapy Market, Key Players are
- Gilead Sciences / Kite Pharma
- Novartis
- Bristol Myers Squibb
- Johnson & Johnson / Janssen Biotech
- Legend Biotech
- JW Therapeutics
- CARsgen Therapeutics
- ImmunoACT
- Autolus Therapeutics
- Cellectis
- Allogene Therapeutics
- Cabaletta Bio
- Cartesian Therapeutics
- IASO Biotherapeutics
- PersonGen Biomedicine
- Fosun Kite Biotechnology
- Gracell Biotechnologies / AstraZeneca
- Immuneel Therapeutics
- Miltenyi Biomedicine
- Galapagos
- ArsenalBio
- Caribou Biosciences
- Sana Biotechnology
- Century Therapeutics
- Adicet Bio
- Umoja Biopharma
- Lyell Immunopharma
- Precision BioSciences
- Fate Therapeutics
- Celyad Oncology
- BioNTech
- Cellular Biomedicine Group
- Juventas Cell Therapy
- Shanghai Unicar-Therapy Bio-Medicine Technology
- AnBio Therapeutics
- Takeda Pharmaceutical
- Astellas Pharma
- Daiichi Sankyo
- Ono Pharmaceutical
- GC Cell
Others