Captive Power Generation Market: Global Industry Analysis and Forecast 2030 – by End User and Region

Captive Power Generation Market is expected to grow at a CAGR of 5.2% during the forecast period and is expected to reach US$ 44.76 Bn by 2030. The report includes the analysis of impact of COVID-19 lock-down on the revenue of market leaders, followers, and disrupters. Since lock down was implemented differently in different regions and countries, impact of same is also different by regions and segments. The report has covered the current short term and long term impact on the market, same will help decision makers to prepare the outline for short term and long term strategies for companies by region.Captive Power Generation Market
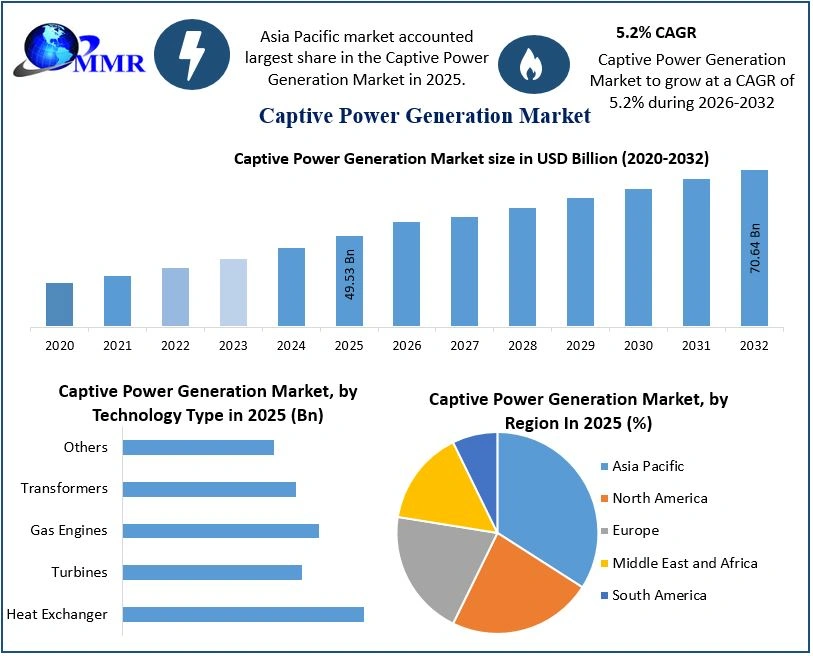
To know about the Research Methodology:-Request Free Sample Report

Market Dynamics

Captive power plants are system of distributed generation, which generate power close to the source of usage. The benefits of captive power generation include reduced distribution and transmission losses, and superior thermal efficiency. Increasing population, rapid industrialization, and urbanization are expected to boost captive power generation market growth. The high industrial power tariff in the end user industry is one of the key drivers in the global market. The increasing need for a reliable power supply coupled with energy-efficient technologies is expected to increase the adoption of cogeneration plants. The rising popularity of solar captive power generation in light of regulatory preference in countries like Germany and Mexico is expected to encourage solar energy output during the forecast period (2024-2030). Increasing expenditure on hydraulic fracturing, which is expected to increase the production output of shale gas and tight oil in the developed countries can pose a challenging threat for the market. On the other hand, the shortage of coal can adversely affect the operation and expose the production of various end-products like steel, cement, aluminum, and fertilizers, which is expected to limit the growth in the global market.

Segment Analysis

The metals & minerals segment is expected to hold the major market share in the captive power generation market. The industry is one of the maximum energy consumers. Growing demand for metals, chemicals, and cement on account of increasing application of construction, automotive and electronics industries is projected to stimulate the captive power generation market during the forecast period. High electricity consumption in the utility sector for steel manufacturing is encouraging key players to establish captive power generation plants in the locality. The increase in the prices in aluminum manufacturing is playing an important role in the growing importance of captive power generation. Favorable government support to support foreign investments is projected to have a positive influence on captive power generation market during the forecast period.

Regional Insights

The Asia Pacific is expected to grow significantly in captive power generation market. The growth in the market is attributed to the growing number of energy-intensive industries in the region. In the region, power availability is one of the key problems in many developing and under-developed countries. Increasing demand for unreliable power supply is expected to increase the need for the captive power generation plant. The objective of the report is to present a comprehensive assessment of the market and contains thoughtful insights, facts, historical data, industry-validated market data and projections with a suitable set of assumptions and methodology. The report also helps in understanding dynamics, structure by analysing the market segments and, project the market. The report also provides a clear representation of competitive analysis of key players by product, price, financial position, product portfolio, growth strategies, and regional presence in the market. The report also provides PEST analysis, PORTER’s analysis, SWOT analysis to address the question of shareholders in arranging the efforts and investment in the near future to a particular market segment.

Global Captive Power Generation Market, Key Highlights:

Global Captive Power Generation Market analysis and forecast, in terms of value. Comprehensive study and analysis of market drivers, restraints and opportunities influencing the growth of the global market Global market segmentation on the basis of type, source, end-user, and region (country-wise) has been provided. The Global Captive Power Generation Market strategic analysis with respect to individual growth trends, future prospects along with the contribution of various sub-market stakeholders have been considered under the scope of study. Global market analysis and forecast for five major regions namely North America, Europe, Asia Pacific, the Middle East & Africa (MEA) and Latin America along with country-wise segmentation. Profiles of key industry players, their strategic perspective, market positioning and analysis of core competencies are further profiled. Competitive developments, investments, strategic expansion and competitive landscape of the key players operating in the Global Captive Power Generation Market are also profiled.

Scope of the Report for Global Captive Power Generation Market :Inquire before buying

Global Captive Power Generation Market
Report Coverage Details
Base Year: 2023 Forecast Period: 2024-2030
Historical Data: 2018 to 2023 Market Size in 2023: US $ 31.39 Bn.
Forecast Period 2024 to 2030 CAGR: 5.2 % Market Size in 2030: US $ 44.76 Bn.
Segments Covered: by Technology Type Heat Exchanger Turbines Gas Engines Transformers Others
by Fuel Type Diesel Gas Coal Others
by Ownership Single Ownership Multiple Ownership
by End-User Residential Commercial Industrial Petrochemical Metals and minerals Cement Others

Global Captive Power Generation Market, by Region

North America (United States, Canada and Mexico) Europe (UK, France, Germany, Italy, Spain, Sweden, Austria and Rest of Europe) Asia Pacific (China, South Korea, Japan, India, Australia, Indonesia, Malaysia, Vietnam, Taiwan, Bangladesh, Pakistan and Rest of APAC) Middle East and Africa (South Africa, GCC, Egypt, Nigeria and Rest of ME&A) South America (Brazil, Argentina Rest of South America)

Global Captive Power Generation Market, Key players

1. Clarke Energy Limited 2. Ducon Technologies Inc. 3. Cethar Limited 4. Thermax Limited 5. SEPCO Electric Power Construction Corporation 6. Enmas GB Power Systems Projects Limited 7. L&T Power Development Limited 8. Samsung C & T Corporation 9. Wartsila Corporation 10.General Electric Company 11.Welspun India Ltd 12.Vedanta Limited 13.Essar Energy Plc. 14.Wartsila 15.Welspun Group 16.Reliance Industries limited 17.Vedanta Resources 18.Essar Energy 19.Jindal Power & Steel Ltd 20.Ultratech Cement Limited. 21.ArcelorMittal 22.Doosan Corporation 23.LafargeHolcim 24.Siemens Frequently Asked Questions: 1. Which region has the largest share in Global Captive Power Generation Market? Ans: Asia Pacific region held the highest share in 2023. 2. What is the growth rate of Global Captive Power Generation Market? Ans: The Global Captive Power Generation Market is growing at a CAGR of 5.2% during forecasting period 2024-2030. 3. What is scope of the Global Captive Power Generation Market report? Ans: Global market helps with the PESTEL, PORTER, COVID-19 Impact analysis, Recommendations for Investors & Leaders, and market estimation of the forecast period. 4. What was the Global Captive Power Generation Market size in 2023? Ans: The global market was valued at US$ 31.39 Bn. In 2023. 5. What is the study period of this Market? Ans: The Global Captive Power Generation Market is studied from 2023 to 2030.
1. Captive Power Generation Market Introduction 1.1. Study Assumption and Market Definition 1.2. Scope of the Study 1.3. Executive Summary 2. Global Captive Power Generation Market: Competitive Landscape 2.1. MMR Competition Matrix 2.2. Competitive Landscape 2.3. Key Players Benchmarking 2.3.1. Company Name 2.3.2. Service Segment 2.3.3. End-user Segment 2.3.4. Revenue (2023) 2.3.5. Manufacturing Locations 2.4. Market Structure 2.4.1. Market Leaders 2.4.2. Market Followers 2.4.3. Emerging Players 2.5. Consolidation Of The Industry 2.6. Recent Mergers And Acquisitions 2.7. JVs, Partnerships, Etc. 2.8. Strategic Business Changes 3. Captive Power Generation Market: Dynamics 3.1. Market Trends by Region 3.1.1. North America Captive Power Generation Market Trends 3.1.2. Europe Captive Power Generation Market Trends 3.1.3. Asia Pacific Captive Power Generation Market Trends 3.1.4. Middle East and Africa Captive Power Generation Market Trends 3.2. Market Dynamics 3.2.1. Global Captive Power Generation Market Drivers 3.2.2. Global Captive Power Generation Market Restraints 3.2.3. Global Captive Power Generation Market Opportunities 3.2.4. Global Captive Power Generation Market Challenges 3.3. PORTER’s Five Forces Analysis 3.4. PESTLE Analysis 3.5. Key Opinion leader Analysis For the Industry 4. Detailed Analysis Of Installed Capacity of Captive Power plants (2023)/ Key CCP setup by Industries 5. Source Wise Captive Power Capacity 6. Industries reaping the Benefits of Captive Power Plants 7. Technological Advancement 8. Regulatory Landscape by Region 8.1.1. North America 8.1.2. Europe 8.1.3. Asia Pacific 8.1.4. Middle East and Africa 8.1.5. South America 8.2. Analysis of Government Schemes and Initiatives For Captive Power Generation Industry 9. Captive Power Generation Market: Global Market Size and Forecast by Segmentation (by Value in USD Million) (2023-2030) 9.1. Captive Power Generation Market Size and Forecast, By Technology Type (2023-2030) 9.1.1. Heat Exchanger 9.1.2. Turbines 9.1.3. Gas Engines 9.1.4. Transformers 9.1.5. Others 9.2. Captive Power Generation Market Size and Forecast, By Fuel Type (2023-2030) 9.2.1. Diesel 9.2.2. Gas 9.2.3. Coal 9.2.4. Others 9.3. Captive Power Generation Market Size and Forecast, By Ownership (2023-2030) 9.3.1. Single Ownership 9.3.2. Multiple Ownership 9.4. Captive Power Generation Market Size and Forecast, By End User (2023-2030) 9.4.1. Residential 9.4.2. Commercial 9.4.3. Industrial 9.4.3.1. Petrochemical 9.4.3.2. Metals and minerals 9.4.3.3. Cement 9.4.3.4. Others 9.5. Captive Power Generation Market Size and Forecast, By Region (2023-2030) 9.5.1. North America 9.5.2. Europe 9.5.3. Asia Pacific 9.5.4. Middle East and Africa 9.5.5. South America 10. North America Captive Power Generation Market Size and Forecast by Segmentation (by Value in USD Million) (2023-2030) 10.1. North America Captive Power Generation Market Size and Forecast, By Technology Type (2023-2030) 10.1.1. Heat Exchanger 10.1.2. Turbines 10.1.3. Gas Engines 10.1.4. Transformers 10.1.5. Others 10.2. North America Captive Power Generation Market Size and Forecast, By Fuel Type (2023-2030) 10.2.1. Diesel 10.2.2. Gas 10.2.3. Coal 10.2.4. Others 10.3. North America Captive Power Generation Market Size and Forecast, By Ownership (2023-2030) 10.3.1. Single Ownership 10.3.2. Multiple Ownership 10.4. North America Captive Power Generation Market Size and Forecast, By End User (2023-2030) 10.4.1. Residential 10.4.2. Commercial 10.5. North America Captive Power Generation Market Size and Forecast, by Country (2023-2030) 10.5.1. United States 10.5.1.1. United States Captive Power Generation Market Size and Forecast, By Technology Type (2023-2030) 10.5.1.1.1. Heat Exchanger 10.5.1.1.2. Turbines 10.5.1.1.3. Gas Engines 10.5.1.1.4. Transformers 10.5.1.1.5. Others 10.5.1.2. United States Captive Power Generation Market Size and Forecast, By Fuel Type (2023-2030) 10.5.1.2.1. Diesel 10.5.1.2.2. Gas 10.5.1.2.3. Coal 10.5.1.2.4. Others 10.5.1.3. United States Captive Power Generation Market Size and Forecast, By Ownership (2023-2030) 10.5.1.3.1. Single Ownership 10.5.1.3.2. Multiple Ownership 10.5.1.4. United States Captive Power Generation Market Size and Forecast, By End User (2023-2030) 10.5.1.4.1. Residential 10.5.1.4.2. Commercial 10.5.1.4.3. Industrial 10.5.1.4.3.1. Petrochemical 10.5.1.4.3.2. Metals and minerals 10.5.1.4.3.3. Cement 10.5.1.4.3.4. Others 10.5.2. Canada 10.5.2.1. Canada Captive Power Generation Market Size and Forecast, By Technology Type (2023-2030) 10.5.2.1.1. Heat Exchanger 10.5.2.1.2. Turbines 10.5.2.1.3. Gas Engines 10.5.2.1.4. Transformers 10.5.2.1.5. Others 10.5.2.2. Canada Captive Power Generation Market Size and Forecast, By Fuel Type (2023-2030) 10.5.2.2.1. Diesel 10.5.2.2.2. Gas 10.5.2.2.3. Coal 10.5.2.2.4. Others 10.5.2.3. Canada Captive Power Generation Market Size and Forecast, By Ownership (2023-2030) 10.5.2.3.1. Single Ownership 10.5.2.3.2. Multiple Ownership 10.5.2.4. Canada Captive Power Generation Market Size and Forecast, By End User (2023-2030) 10.5.2.4.1. Residential 10.5.2.4.2. Commercial 10.5.2.4.3. Industrial 10.5.2.4.3.1. Petrochemical 10.5.2.4.3.2. Metals and minerals 10.5.2.4.3.3. Cement 10.5.2.4.3.4. Others 10.5.3. Mexico 10.5.3.1. Mexico Captive Power Generation Market Size and Forecast, By Technology Type (2023-2030) 10.5.3.1.1. Heat Exchanger 10.5.3.1.2. Turbines 10.5.3.1.3. Gas Engines 10.5.3.1.4. Transformers 10.5.3.1.5. Others 10.5.3.2. Mexico Captive Power Generation Market Size and Forecast, By Fuel Type (2023-2030) 10.5.3.2.1. Diesel 10.5.3.2.2. Gas 10.5.3.2.3. Coal 10.5.3.2.4. Others 10.5.3.3. Mexico Captive Power Generation Market Size and Forecast, By Ownership (2023-2030) 10.5.3.3.1. Single Ownership 10.5.3.3.2. Multiple Ownership 10.5.3.4. Mexico Captive Power Generation Market Size and Forecast, By End User (2023-2030) 10.5.3.4.1. Residential 10.5.3.4.2. Commercial 10.5.3.4.3. Industrial 10.5.3.4.3.1. Petrochemical 10.5.3.4.3.2. Metals and minerals 10.5.3.4.3.3. Cement 10.5.3.4.3.4. Others 11. Europe Captive Power Generation Market Size and Forecast by Segmentation (by Value in USD Million) (2023-2030) 11.1. Europe Captive Power Generation Market Size and Forecast, By Technology Type (2023-2030) 11.2. Europe Captive Power Generation Market Size and Forecast, By Fuel Type (2023-2030) 11.3. Europe Captive Power Generation Market Size and Forecast, By Ownership (2023-2030) 11.4. Europe Captive Power Generation Market Size and Forecast, By End User (2023-2030) 11.5. Europe Captive Power Generation Market Size and Forecast, by Country (2023-2030) 11.5.1. United Kingdom 11.5.1.1. United Kingdom Captive Power Generation Market Size and Forecast, By Technology Type (2023-2030) 11.5.1.2. United Kingdom Captive Power Generation Market Size and Forecast, By Fuel Type (2023-2030) 11.5.1.3. United Kingdom Captive Power Generation Market Size and Forecast, By Ownership (2023-2030) 11.5.1.4. United Kingdom Captive Power Generation Market Size and Forecast, By End User (2023-2030) 11.5.2. France 11.5.2.1. France Captive Power Generation Market Size and Forecast, By Technology Type (2023-2030) 11.5.2.2. France Captive Power Generation Market Size and Forecast, By Fuel Type (2023-2030) 11.5.2.3. France Captive Power Generation Market Size and Forecast, By Ownership (2023-2030) 11.5.2.4. France Captive Power Generation Market Size and Forecast, By End User (2023-2030) 11.5.3. Germany 11.5.3.1. Germany Captive Power Generation Market Size and Forecast, By Technology Type (2023-2030) 11.5.3.2. Germany Captive Power Generation Market Size and Forecast, By Fuel Type (2023-2030) 11.5.3.3. Germany Captive Power Generation Market Size and Forecast, By Ownership (2023-2030) 11.5.3.4. Germany Captive Power Generation Market Size and Forecast, By End User (2023-2030) 11.5.4. Italy 11.5.4.1. Italy Captive Power Generation Market Size and Forecast, By Technology Type (2023-2030) 11.5.4.2. Italy Captive Power Generation Market Size and Forecast, By Fuel Type (2023-2030) 11.5.4.3. Italy Captive Power Generation Market Size and Forecast, By Ownership (2023-2030) 11.5.4.4. Italy Captive Power Generation Market Size and Forecast, By End User (2023-2030) 11.5.5. Spain 11.5.5.1. Spain Captive Power Generation Market Size and Forecast, By Technology Type (2023-2030) 11.5.5.2. Spain Captive Power Generation Market Size and Forecast, By Fuel Type (2023-2030) 11.5.5.3. Spain Captive Power Generation Market Size and Forecast, By Ownership (2023-2030) 11.5.5.4. Spain Captive Power Generation Market Size and Forecast, By End User (2023-2030) 11.5.6. Sweden 11.5.6.1. Sweden Captive Power Generation Market Size and Forecast, By Technology Type (2023-2030) 11.5.6.2. Sweden Captive Power Generation Market Size and Forecast, By Fuel Type (2023-2030) 11.5.6.3. Sweden Captive Power Generation Market Size and Forecast, By Ownership (2023-2030) 11.5.6.4. Sweden Captive Power Generation Market Size and Forecast, By End User (2023-2030) 11.5.7. Austria 11.5.7.1. Austria Captive Power Generation Market Size and Forecast, By Technology Type (2023-2030) 11.5.7.2. Austria Captive Power Generation Market Size and Forecast, By Fuel Type (2023-2030) 11.5.7.3. Austria Captive Power Generation Market Size and Forecast, By Ownership (2023-2030) 11.5.7.4. Austria Captive Power Generation Market Size and Forecast, By End User (2023-2030) 11.5.8. Rest of Europe 11.5.8.1. Rest of Europe Captive Power Generation Market Size and Forecast, By Technology Type (2023-2030) 11.5.8.2. Rest of Europe Captive Power Generation Market Size and Forecast, By Fuel Type (2023-2030) 11.5.8.3. Rest of Europe Captive Power Generation Market Size and Forecast, By Ownership (2023-2030) 11.5.8.4. Rest of Europe Captive Power Generation Market Size and Forecast, By End User (2023-2030) 12. Asia Pacific Captive Power Generation Market Size and Forecast by Segmentation (by Value in USD Million) (2023-2030) 12.1. Asia Pacific Captive Power Generation Market Size and Forecast, By Technology Type (2023-2030) 12.2. Asia Pacific Captive Power Generation Market Size and Forecast, By Fuel Type (2023-2030) 12.3. Asia Pacific Captive Power Generation Market Size and Forecast, By Ownership (2023-2030) 12.4. Asia Pacific Captive Power Generation Market Size and Forecast, By End User (2023-2030) 12.5. Asia Pacific Captive Power Generation Market Size and Forecast, by Country (2023-2030) 12.5.1. China 12.5.1.1. China Captive Power Generation Market Size and Forecast, By Technology Type (2023-2030) 12.5.1.2. China Captive Power Generation Market Size and Forecast, By Fuel Type (2023-2030) 12.5.1.3. China Captive Power Generation Market Size and Forecast, By Ownership (2023-2030) 12.5.1.4. China Captive Power Generation Market Size and Forecast, By End User (2023-2030) 12.5.2. S Korea 12.5.2.1. S Korea Captive Power Generation Market Size and Forecast, By Technology Type (2023-2030) 12.5.2.2. S Korea Captive Power Generation Market Size and Forecast, By Fuel Type (2023-2030) 12.5.2.3. S Korea Captive Power Generation Market Size and Forecast, By Ownership (2023-2030) 12.5.2.4. S Korea Captive Power Generation Market Size and Forecast, By End User (2023-2030) 12.5.3. Japan 12.5.3.1. Japan Captive Power Generation Market Size and Forecast, By Technology Type (2023-2030) 12.5.3.2. Japan Captive Power Generation Market Size and Forecast, By Fuel Type (2023-2030) 12.5.3.3. Japan Captive Power Generation Market Size and Forecast, By Ownership (2023-2030) 12.5.3.4. Japan Captive Power Generation Market Size and Forecast, By End User (2023-2030) 12.5.4. India 12.5.4.1. India Captive Power Generation Market Size and Forecast, By Technology Type (2023-2030) 12.5.4.2. India Captive Power Generation Market Size and Forecast, By Fuel Type (2023-2030) 12.5.4.3. India Captive Power Generation Market Size and Forecast, By Ownership (2023-2030) 12.5.4.4. India Captive Power Generation Market Size and Forecast, By End User (2023-2030) 12.5.5. Australia 12.5.5.1. Australia Captive Power Generation Market Size and Forecast, By Technology Type (2023-2030) 12.5.5.2. Australia Captive Power Generation Market Size and Forecast, By Fuel Type (2023-2030) 12.5.5.3. Australia Captive Power Generation Market Size and Forecast, By Ownership (2023-2030) 12.5.5.4. Australia Captive Power Generation Market Size and Forecast, By End User (2023-2030) 12.5.6. ASEAN 12.5.6.1. ASEAN Captive Power Generation Market Size and Forecast, By Technology Type (2023-2030) 12.5.6.2. ASEAN Captive Power Generation Market Size and Forecast, By Fuel Type (2023-2030) 12.5.6.3. ASEAN Captive Power Generation Market Size and Forecast, By Ownership (2023-2030) 12.5.6.4. ASEAN Captive Power Generation Market Size and Forecast, By End User (2023-2030) 12.5.7. Rest of Asia Pacific 12.5.7.1. Rest of Asia Pacific Captive Power Generation Market Size and Forecast, By Technology Type (2023-2030) 12.5.7.2. Rest of Asia Pacific Captive Power Generation Market Size and Forecast, By Fuel Type (2023-2030) 12.5.7.3. Rest of Asia Pacific Captive Power Generation Market Size and Forecast, By Ownership (2023-2030) 12.5.7.4. Rest of Asia Pacific Captive Power Generation Market Size and Forecast, By End User (2023-2030) 13. Middle East and Africa Captive Power Generation Market Size and Forecast (by Value in USD Million) (2023-2030 13.1. Middle East and Africa Captive Power Generation Market Size and Forecast, By Technology Type (2023-2030) 13.2. Middle East and Africa Captive Power Generation Market Size and Forecast, By Fuel Type (2023-2030) 13.3. Middle East and Africa Captive Power Generation Market Size and Forecast, By Ownership (2023-2030) 13.4. Middle East and Africa Captive Power Generation Market Size and Forecast, By End User (2023-2030) 13.5. Middle East and Africa Captive Power Generation Market Size and Forecast, by Country (2023-2030) 13.5.1. South Africa 13.5.1.1. South Africa Captive Power Generation Market Size and Forecast, By Technology Type (2023-2030) 13.5.1.2. South Africa Captive Power Generation Market Size and Forecast, By Fuel Type (2023-2030) 13.5.1.3. South Africa Captive Power Generation Market Size and Forecast, By Ownership (2023-2030) 13.5.1.4. South Africa Captive Power Generation Market Size and Forecast, By End User (2023-2030) 13.5.2. GCC 13.5.2.1. GCC Captive Power Generation Market Size and Forecast, By Technology Type (2023-2030) 13.5.2.2. GCC Captive Power Generation Market Size and Forecast, By Fuel Type (2023-2030) 13.5.2.3. GCC Captive Power Generation Market Size and Forecast, By Ownership (2023-2030) 13.5.2.4. GCC Captive Power Generation Market Size and Forecast, By End User (2023-2030) 13.5.3. Rest of ME&A 13.5.3.1. Rest of ME&A Captive Power Generation Market Size and Forecast, By Technology Type (2023-2030) 13.5.3.2. Rest of ME&A Captive Power Generation Market Size and Forecast, By Fuel Type (2023-2030) 13.5.3.3. Rest of ME&A Captive Power Generation Market Size and Forecast, By Ownership (2023-2030) 13.5.3.4. Rest of ME&A Captive Power Generation Market Size and Forecast, By End User (2023-2030) 14. South America Captive Power Generation Market Size and Forecast by Segmentation (by Value in USD Million) (2023-2030 14.1. South America Captive Power Generation Market Size and Forecast, By Technology Type (2023-2030) 14.2. South America Captive Power Generation Market Size and Forecast, By Fuel Type (2023-2030) 14.3. South America Captive Power Generation Market Size and Forecast, By Ownership (2023-2030) 14.4. South America Captive Power Generation Market Size and Forecast, By End User (2023-2030) 14.5. South America Captive Power Generation Market Size and Forecast, by Country (2023-2030) 14.5.1. Brazil 14.5.1.1. Brazil Captive Power Generation Market Size and Forecast, By Technology Type (2023-2030) 14.5.1.2. Brazil Captive Power Generation Market Size and Forecast, By Fuel Type (2023-2030) 14.5.1.3. Brazil Captive Power Generation Market Size and Forecast, By Ownership (2023-2030) 14.5.1.4. Brazil Captive Power Generation Market Size and Forecast, By End User (2023-2030) 14.5.2. Argentina 14.5.2.1. Argentina Captive Power Generation Market Size and Forecast, By Technology Type (2023-2030) 14.5.2.2. Argentina Captive Power Generation Market Size and Forecast, By Fuel Type (2023-2030) 14.5.2.3. Argentina Captive Power Generation Market Size and Forecast, By Ownership (2023-2030) 14.5.2.4. Argentina Captive Power Generation Market Size and Forecast, By End User (2023-2030) 14.5.3. Rest Of South America 14.5.3.1. Rest Of South America Captive Power Generation Market Size and Forecast, By Technology Type (2023-2030) 14.5.3.2. Rest Of South America Captive Power Generation Market Size and Forecast, By Fuel Type (2023-2030) 14.5.3.3. Rest Of South America Captive Power Generation Market Size and Forecast, By Ownership (2023-2030) 14.5.3.4. Rest Of South America Captive Power Generation Market Size and Forecast, By End User (2023-2030) 15. Company Profile: Key Players 15.1. Thermax Limited 15.1.1. Company Overview 15.1.2. Business Portfolio 15.1.3. Financial Overview 15.1.4. SWOT Analysis 15.1.5. Strategic Analysis 15.1.6. Recent Developments 15.2. Wartsila Corporation 15.3. Clarke Energy Limited 15.4. Vedanta Limited 15.5. GE Vernova 15.6. Reliance Industries limited 15.7. Jindal Power & Steel Ltd 15.8. Ultratech Cement Limited. 15.9. Doosan Corporation 15.10. Holcim 15.11. Siemens 15.12. Mitsubishi Heavy Industries, Ltd. 15.13. Schneider Electric 15.14. Hindalco Industries Ltd. 16. Key Findings 17. Industry Recommendations 18. Captive Power Generation Market: Research Methodology
  • INQUIRE BEFORE BUYING
MMRLogo
America's Fastest Growing Market Research Firm