
Amusement Parks Market- Industry Structure Evaluation, Demand Drivers Analysis, Regional Growth Analysis and Identification, Competitive Positioning Review & Global Market Size Forecast to 2032
Overview
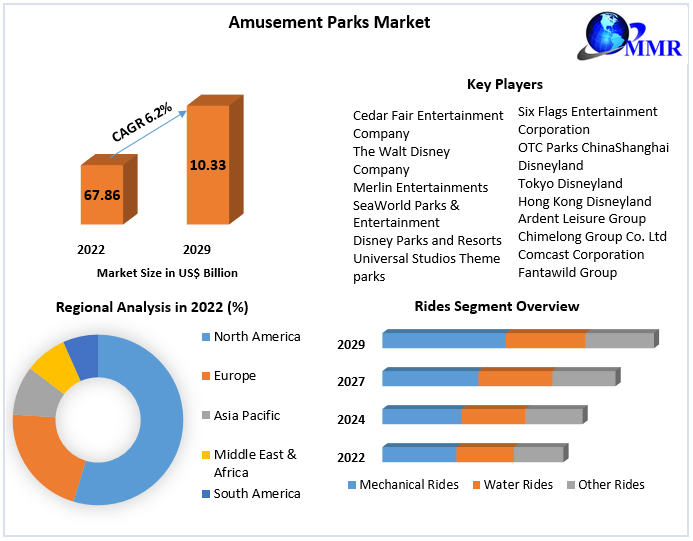
The Amusement Parks Market size was valued at USD 59.2 Billion in 2025 and the total Amusement Parks revenue is expected to grow at a CAGR of 6.4% from 2025 to 2032, reaching nearly USD 91.39 Billion.
An increase in per capita income, favorable demographics, limited options for other outdoor entertainment avenues, and changing lifestyles are major factors driving the amusement parks market growth. Millennials prefer spending money on experiences more than buying assets and amusement parks are giving more thrilling experiences as the millennials want. Social media platforms like Instagram and Facebook are nudging people to seek out more such outdoor experiences. Infrastructure developments like Metro Rail and Ring roads have enhanced connectivity to popular amusement parks. As a result, the amusement parks industry is offering lucrative growth opportunities and sales revenue growth during the forecast period.
Amusement parks in Europe are major tourist attractions, drawing millions of visitors annually. To enhance visitor engagement, European parks are incorporating advanced technologies such as virtual reality (VR), augmented reality (AR), and interactive experiences (IoT). The amusement parks market is propelled by increased tourism spending, a rising middle class, and urbanization. The ticket segment holds a significant share of about 52%, with expected growth driven by dynamic pricing models, online promotions, and a variety of ticket options. Parks are adopting digital ticketing and flexible packages to improve accessibility and convenience. Italy is a key player, with its market growth supported by higher disposable income and increased consumer spending on leisure and entertainment. The popularity of theme-based parks is another critical factor driving the European amusement parks market, as consumers allocate more of their income to leisure activities.
The Indian amusement parks market is growing rapidly and become a key region for industry stakeholders and investors. With about 300 amusement parks and 2,500 indoor amusement centers across the country, the sector is expected to reach a turnover of Rs 25,000 crore by 2032. Industry experts highlight the potential for job creation and investment opportunities, particularly in theme-based parks featuring religious and mythological themes enhanced by technological innovations like laser shows. The Indian Association of Amusement Parks and Industries (IAAPI) emphasizes the sector's role in driving tourism and collaborating with related industries. Current turnover stands at Rs 11,500 crore, reflecting substantial growth potential in the amusement parks market during the forecast period.
 To know about the Research Methodology :- Request Free Sample Report
Amusement Parks Market Trends:
Increasing adoption of Virtual Reality in Amusement Parks
Amusement parks are increasingly integrating VR to offer dynamic, immersive experiences that surpass traditional rides. VR technology enables parks to create virtual worlds, update experiences regularly, and align with seasonal and cultural trends, fostering repeat visits. This appeals particularly to tech-savvy consumers seeking interactive, personalized experiences amid travel restrictions and economic uncertainties. Strategically, VR enhances operational efficiency with remote updates, reducing downtime and costs compared to physical rides. Its cost-effectiveness democratizes advanced attractions, benefiting parks of all sizes globally. Leading regions like North America and Asia Pacific showcase robust adoption, driving innovation, brand differentiation, and revenue growth. Thus, increasing adoption of VR in amusement Parks is a key trend driving the revenue share of the amusement parks market.
Amusement Parks Market Dynamics:
Millennials Preference For Theme Parks
With work-life balance becoming increasingly important, a growing number of individuals are seeking new and inventive kinds of leisure, relaxation, and enjoyment to spend time with friends and family. A significant percentage of such people and their children receive the joy and excitement that they seek at theme parks, becoming popular choices all over the world. Theme parks are getting smarter with technological innovations. In addition, theme parks often provide personalized and customized experiences increasing the customer base. Theme parks increasingly use sophisticated data analytics to transform visits into tailored adventures, ensuring every guest's experience is unique. Social media augments exposure, with platforms like Instagram and TikTok enhancing park visibility and visitor engagement. Major players like Disney and Universal Studios dominate, leveraging innovative attractions and immersive experiences to attract global audiences. Thus, the growing preference for theme parks driving the amusement parks market size.
India Is Expected To Be The Lucrative Country In Amusement Parks Markets
The amusement parks market in India is at a nascent stage compared to its global counterparts. However, the region is expected to grow at a significant CAGR and offer lucrative growth opportunities for the amusement parks market players during the forecast period. Historically, amusement parks like Appu Ghar have paved the way since 1984, yet the industry remains small, constituting only 1% of the global market. Despite this, India hosts around 150 amusement and theme parks, with notable names such as Imagicaa, Wonderla, Nicco Park, EsselWorld, Water Kingdom, and Ramoji Film City attracting significant steps, primarily from domestic visitors.
Leading market players Disney and Universal Studios, have set a benchmark with their expansive services and complicated tourist reports, drawing both domestic and global travelers. For example, Disney Parks stated a huge growth in per-capita spending post-pandemic, indicative of sturdy customer demand for awesome enjoyment studies. In assessment, Indian parks have historically catered predominantly to the local population and have yet to faucet into the potential of worldwide tourism.
The growth prospects for India's amusement parks industry are promising. Increasing disposable incomes, favorable demographics, and shifting consumer preferences towards experiential travel are driving demand. Indian consumers are increasingly seeking out leisure activities that offer unique experiences and entertainment options, which amusement parks are well-positioned to provide. Moreover, the shortage of huge out-of-door entertainment alternatives in city areas further complements the enchantment of amusement parks as destinations for family outings and leisure sports.
To capitalize on this growth potential, industry players are urged to innovate continuously. Learning from global counterparts, Indian parks can enhance their offerings by introducing diverse themes, expanding ride portfolios, and improving infrastructure. Embracing technologies like augmented reality (AR) and virtual reality (VR) can further enrich visitor experiences and differentiate parks in a competitive market.
Government initiatives are also pivotal. Policies that support the development of amusement parks, such as leasing unused industrial land as seen in Goa, are expected to stimulate the Indian amusement parks market growth and boost employment opportunities in local communities. Moreover, partnerships with hospitality providers to develop on-site accommodations can enhance visitor convenience and extend their length of stay, thereby benefiting both the parks and local economies.
Amusement Parks Market Segment Analysis:
Based on the Service, the Mechanical Rides segment held the largest revenue share of 70.13% of the global amusement parks market in 2025. The segment is further expected to grow at a CAGR of 4.20% and maintain its dominance during the forecast period. This growth is attributed to the widespread popularity of mechanical rides which range from roller coasters to carousels, across all age groups as well as their ability to provide thrilling experiences. This attracts large numbers of visitors, thereby supporting the amusement parks market growth. Mechanical rides segment growth also benefits from continuous innovation in ride design and technology, enhancing safety, & comfort features, and overall experience for park visitors. The appeal of mechanical rides lies in their diverse range, catering to different thrill levels and preferences, ensuring broad audience appeal and sustained market demand.
This diversity, coupled with ongoing investments in new attractions and refurbishments, reinforces mechanical rides' pivotal role in driving revenue growth and increasing the global footprint of the amusement parks market. However, the water rides segment witnessed a moderate growth rate in the historic period. This is due to the water riders operating seasonally due to weather conditions. In Europe, for example, these rides often close during winter. Nevertheless, rising demand for thrilling and immersive water-based experiences is expected to boost the segment's growth. In addition, the growing demand for water-based rides during the summer season is further expected to propel the water amusement parks market revenue share.
Recent Industry Developments
| Exact Date | Company | Development | Impact |
|---|---|---|---|
| 22 May 2025 | Comcast Corporation (Universal Destinations & Experiences) | Opened the new Universal Epic Universe theme park at Universal Orlando Resort featuring five immersive themed lands and advanced ride technologies. | The launch significantly expands global theme park capacity and immersive entertainment offerings, intensifying competition with major park operators. |
| 16 May 2025 | The Walt Disney Company | Launched the Disneyland Resort 70th Anniversary celebration introducing new shows, entertainment experiences, and themed attractions. | The initiative strengthens visitor engagement and tourism inflow, supporting revenue growth across Disney’s global amusement park operations. |
| 16 November 2025 | Six Flags Entertainment Corporation | Announced the official opening schedule for Six Flags Qiddiya City in Saudi Arabia, confirming the park would open by the end of 2025. | The project marks Six Flags’ expansion into the Middle East, strengthening the region’s position as an emerging global amusement tourism hub. |
| 24 November 2025 | The Walt Disney Company | Announced the upcoming launch of the World of Frozen themed land at Disneyland Paris as part of the Disney Adventure World expansion. | The expansion introduces new attractions, dining, and entertainment zones, boosting Europe’s amusement park visitor experience. |
Amusement Parks Market Regional Insights:
North America led the global amusement parks market with the highest market share of 38.3% in 2025 and is expected to grow at a CAGR of 5.55% during the forecast period. Americans' love for amusement parks is fueled by nostalgia and the desire for thrilling experiences. With over 400 parks attracting 300 million visitors annually and generating significant revenue in the global amusement parks industry in the region. The 1893 Chicago World’s Fair, with its Ferris wheel, inspired modern parks. Today, visitors seek high-tech thrills, 3-D worlds, and personal encounters with popular characters. Orlando, Florida, a top destination, sees 56 million visitors yearly, drawn by its diverse theme parks.
The allure of staycations lies in their accessibility, cost-effectiveness, and reduced administrative burdens. With more time and money saved from not traveling abroad, families are rediscovering the joys of local amusement parks. These parks offer a variety of experiences, from thrilling rides and themed attractions to immersive environments, making them perfect for both short-day trips and extended visits.
Major market players within the amusement parks market, such as Disney, Universal Studios, and Six Flags, have adapted to this trend by enhancing their offerings and ensuring safety measures to draw local vacationers. Investments in new rides, themed events, and seasonal festivals cater to the developing demand for high-quality products and nearby leisure alternatives. Additionally, the emphasis on outdoor sports aligns with the multiplied choice for being active and immersed in nature, a key element of the staycation trend. Moreover, supporting local businesses is another component driving the North American enjoyment parks market size. Visitors to enjoyment parks make contributions drastically to the local financial system, reaping rewards from hotels, eating places, and stores within the vicinity. The expanded foot site visitors no longer simply support these businesses but also encourage the improvement of new attractions and facilities, similarly boosting the local tourism sector.
Amusement Parks Market MMR Key Findings:
Around 1,000 Americans over the age of 18 are excited about staycations per month.
Over 67% of Americans are planning a staycation every year.
Americans living in the Middle Atlantic region, in states such as New York and Pennsylvania, are most likely to take staycations.
Europe's amusement parks market held the second dominant position in 2025 and is expected to grow at a significant CAGR during the forecast period. According to the Association of German Amusement Parks, leisure and theme parks are a popular destination not only in Germany but all across the European continent, with visitor numbers rising for years and positive sales forecasts. With an annual visitor volume of around 39 million, almost every second German goes to a theme park once a year on average. Besides Germany, countries like France, Denmark, and Spain have seen a remarkable surge in their amusement parks market size, driven by increasing visitor numbers and a growing adoption of innovative digital experiences during the forecast period.
In addition, with the integration of digital technologies to enhance visitor experiences, the European amusement parks market is evolving significantly. Parks are adopting virtual reality (VR) and augmented reality (AR) in attractions like roller coasters, providing immersive experiences that blend digital and physical worlds. Technologies such as wearables and smartphone apps facilitate ticketing, navigation, and personalized interactions. As parks embrace "smart destination" concepts, there's a growing need for employees with both digital skills for technology integration and strong social skills for guest interaction. Continuous training is crucial to adapt to future advancements in immersive computing and digital guest experiences.
Amusement Parks Market Conclusion:
The amusement park industry is a profitable and dynamic sector with promising boom potential. From the large revenue projections to the evolving vacationer tendencies and innovative technologies, the enterprise keeps drawing hundreds of thousands of site visitors all across the world. With a robust awareness of safety, upkeep, and traveler revel, leisure parks are key monetary drivers, presenting employment opportunities, riding client spending, and contributing considerably to local and worldwide economies. As the enterprise navigates the challenges of the post-pandemic landscape, it is poised for a sturdy healing and expansion in the coming years, especially in areas just like the Asia-Pacific.
Amusement Parks Market Scope: Inquire before buying
| Amusement Parks Market | |||
|---|---|---|---|
| Report Coverage | Details | ||
| Base Year: | 2025 | Forecast Period: | 2026-2032 |
| Historical Data: | 2020 to 2025 | Market Size in 2025: | 59.2 USD Billion |
| Forecast Period 2026-2032 CAGR: | 6.4% | Market Size in 2032: | 91.39 USD Billion |
| Segments Covered: | by Rides | Mechanical Rides Water Rides Other Rides |
|
| by Type | Theme Parks Water Parks Amusement Parks Adventure Parks |
||
| by Revenue Source | Ticket Sales Food & Beverages Merchandise Others |
||
| by Age | Up to 18 Years 19 to 35 Years 36 to 50 Years 51 to 65 Years More than 65 Years |
||
Amusement Parks Market, by Region
Asia Pacific (China, South Korea, Japan, India, Australia, Indonesia, Malaysia, Vietnam, Taiwan, Bangladesh, Pakistan and Rest of APAC)
Europe (UK, France, Germany, Italy, Spain, Sweden, Austria and Rest of Europe)
North America (United States, Canada and Mexico)
Middle East and Africa (South Africa, GCC, Egypt, Nigeria and Rest of ME&A)
South America (Brazil, Argentina Rest of South America)
Key players / Competitors profiles covered in the Amusement Parks Market report in strategic perspective
Ardent Leisure Group
Aspro Group
Cedar Fair Entertainment Company
Comcast
Efteling
Fantawild
Fuji-Q Highland
Hershey Entertainment & Resorts Company
IMG Worlds of Adventure
Merlin Entertainments
Portaventura Caribe Aquatic Park
SeaWorld Parks & Entertainment, Inc
Six Flags Entertainment Corporation
The Walt Disney Company
UniversalParks&Resorts
ChimelongGroup
ParquesReunidos
VillageRoadshowThemeParks
OceanParkCorporation
LagotronicsProjects
CompagnieDesAlpes
EverlandResort
EuropaPark
LotteWorld
NagashimaResort
HappyValleyShenzhen
SunacChinaHoldings
DubaiParksandResorts
GentingSkyWorlds
FAQs:
1. What are the growth drivers for the Amusement Parks market?
Ans. The increasing disposable incomes, rising tourism, technological advancements in attractions, and growing popularity of family-friendly entertainment options are expected to be the major drivers for the Amusement Parks market.
2. What are the factors restraining the global Amusement Parks market growth during the forecast period?
Ans. The high operational costs, regulatory challenges, and fluctuating consumer spending due to economic uncertainties are expected to be the major factors restraining the global Amusement Parks market growth during the forecast period.
3. Which region is expected to lead the global Amusement Parks market during the forecast period?
Ans. North America is expected to lead the global Amusement Parks market during the forecast period.
4. What segments are covered in the Amusement Parks Market report?
Ans. The segments covered in the Amusement Parks market report are Service, Age, Revenue Source, and Region.