Global Activated Carbon Market by Type, Application, Raw Material, Region – Global Market Size Estimation, Industry-Wide Analysis, Competitive Landscape Assessment & Long-Term Forecast to 2032

8.86%
CAGR (2026-2032)
11.62 USD Bn.
Market Size
322
Report Pages
144
Market Tables

Overview

The Activated Carbon Market size was valued at USD 11.62 Billion in 2025 and the total Activated Carbon revenue is expected to grow at a CAGR of 8.86% from 2026 to 2032, reaching nearly USD 21.05 Billion.

Global Activated Carbon Market Overview:

Activated carbon (also known as activated charcoal) is a type of carbon that has been processed to produce small, low-volume pores that enhance the amount of surface area accessible for adsorption or chemical reactions. According to gas adsorption, one gram of activated carbon has a surface area of almost 3,000 m2 thanks to its high degree of microporosity. The high surface area alone can provide an activation level sufficient for practical application.

Charcoal is the most common source of activated carbon. Air purification, decaffeination, solvent recovery, gold purification, metal extraction, water purification, sewage treatment, medication, air filters in respirators, teeth whitening, hydrogen chloride synthesis, and more applications use activated carbon.Activated Carbon Market
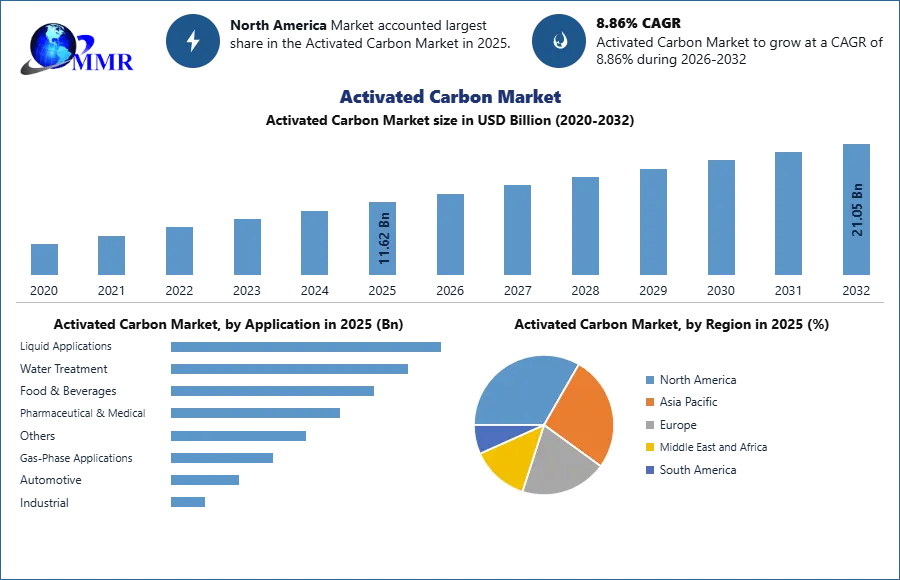
To know about the Research Methodology :- Request Free Sample Report

Activated Carbon Market Dynamics:

Activated Carbon Is In High Demand As The Need For Pollution Control Grows:

Adsorption is the process of transferring gaseous contaminants from an air stream to the solid surface of an adsorbent. The most common adsorbent is activated carbon; however, zeolites, polymers, and other adsorbents can also be consumed. Activated carbon has unique strengths that enable it to remove VOCs, odors, and other gaseous contaminants from the atmosphere. It does it differently than other air purifiers, such as High-efficiency particulate absorbing filters (HEPA), which solely filter particle pollution from the air.

The Environmental Protection Agency (EPA) has defined Maximum Achievable Control Technology (MACT) standards, which require sources to reach certain emission limits based on the best-performing facilities' emission levels. The European Commission has also issued directives to restrict industrial emissions, such as the IPPC Directive (Directive 2008/1/EC). Its main premise is to use the best available techniques (BAT). BAT refers to the greatest technology available on the market that is affordable to everyone and can be implemented to prevent mercury pollutants.Activated Carbon Market 1
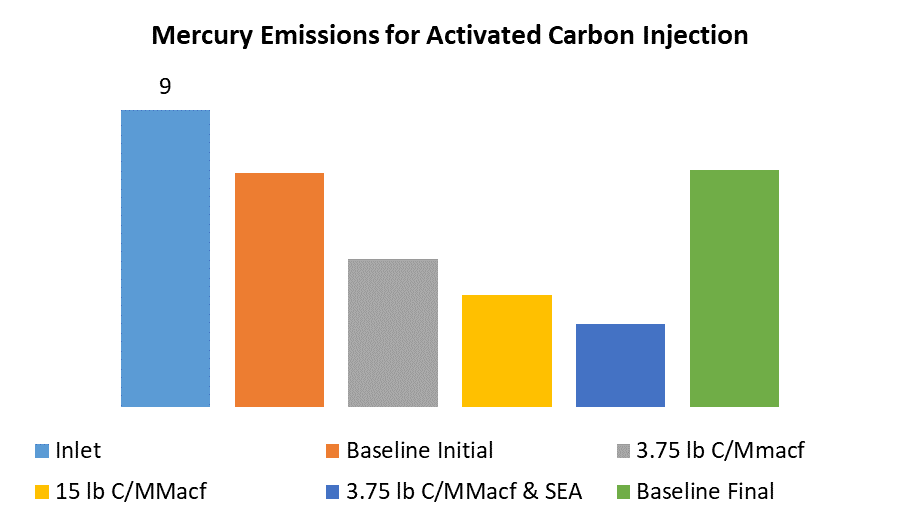
For example, in nations like Canada and the United States, new legislation will take effect in that may compel coal-fired power stations to install specific mercury-control technologies. The European Union, as well as nations such as Australia and Japan, are developing programs to better monitor mercury emissions from coal-fired power plants, to adopt standards in the near future.

Activated Carbon Prices Are Rising Because Of A Scarcity Of Raw Materials:

Coconut shells are becoming a more important raw material for activated carbon producers in the Asia Pacific. Natural disasters have a substantial impact on the activated carbon market's value chain, particularly in terms of raw materials. Thus, the cost of raw materials, particularly for coconut shell charcoal, has surged. The cost of coal-based activated carbon has also risen as a result of rising energy demands, particularly in China, where coal demand for industrial industries such as power, cement, and iron and steel plants continue to surge.

For example,

• Because of a significant increase in raw material costs, Jacobi Group has decided on a general 10% price increase on all coconut-based activated carbons. The price hikes took effect on April 1, for shipments made on or after that date.

• Cabot Norit Activated Carbon raised pricing globally for all activated carbon products beginning on or after October 1, or as customer contracts allow. Depending on the activated carbon product and locality, price hikes ranged from 3% to 8%.

This has resulted in a scarcity of acceptable coal grades for the production of activated carbon. In the Asia Pacific, coal is the most common raw material generally consumed for the activated carbon production, particularly in India, Sri Lanka, Indonesia, and the Philippines. However, the scarcity of raw materials is impacting the operational effectiveness of activated carbon producers, leading to a 50–60% reduction in production capacity, resulting in an increase in activated carbon prices.

Activated Carbon Manufacturers May Be Able To Profit From Reactivated Carbon:

The demand for activated carbon has risen dramatically as a result of severe air quality rules and the growing number of municipal and industrial wastewater treatment plants. The increasing pressure on activated carbon manufacturers because of the high production cost of activated carbon is a major factor in the industry. As a result, producers of activated carbon are concentrating their efforts on reactivated carbon. The cost of reactivated carbon is 20-30% less than that of virgin activated carbon.

It is an economic substitute to activated carbon. Traditional activated carbon is more environmentally friendly than reactivated carbon. When compared to the manufacture of virgin material, the thermal reactivation method reduces carbon dioxide emissions by five times. Reactivated carbon is preferred by municipal water treatment plants in Europe. The used activated carbon can be recycled for reuse after reactivation, avoiding the costs and long-term liabilities associated with disposal. Because it is efficient and non-hazardous to the environment, reactivated carbon overcomes the pricing dilemma. This is a significant opportunity for market operators to increase profitability.

Low Industrial Growth Led To Inefficient Economic Conditions:

Globally, weak economic conditions have had a direct impact on industrial expansion to some extent. For air purification, water treatment, decolorization of chemical products, solvent purification, odor elimination, and other applications, activated carbon is widely used in the chemical, petrochemical, and food & beverage, pharmaceutical, mining, and automotive industries. Similarly, fluctuations in crude oil prices have an impact on the value chain of the chemical, petrochemical, and related industries, affecting their growth. Low industrial activity has an impact on the growth of the activated carbon market since the demand for activated carbon is directly related to operational activities in these industries.

Key Trends:

Carbon costs have risen in several countries, but they still range from US $1/t CO2e to US $119/t CO2e.
The most significant price rises over the last year happened in Asia, with increases in the Korean ETS (Emission Trading Scheme) and Chinese pilots because of limited trade and a reduced allowance scarcity due to higher output, respectively. As part of an annual update based on the price in the EU ETS, prices in Switzerland tripled, moving up to EU allowance pricing, while Portugal's carbon tax rate nearly doubled to €24/t CO2e (US $26/t CO2e) in the run-up to the link with the EU ETS.

• Increasingly carbon pricing measures are being implemented to assist governments in meeting more aggressive regional or national climate targets.
In Europe, the EU Green Deal and its aim to achieve carbon neutrality by 2050 strengthened the case for more aggressive climate action and broader use of carbon pricing. Several nations have set additional climate goals and plan to investigate national carbon pricing efforts to supplement the EU ETS by covering new industries. In Germany plans to implement a national carbon market for heat and road travel. Luxembourg likewise intends to impose a carbon price on sectors not covered by the EU ETS in. Similarly, Austria announced plans to implement a carbon price for non-ETS industries, albeit the specifics of the program have yet to be finalized.

Global Activated Carbon Market Segment Analysis:

Based on Type, the activated carbon market is segmented as, powdered activated carbon, granulated activated carbon, and others (pellet-shaped, and bead-shaped. In 2025 the powdered activated carbon segment was dominant of the overall market share in terms of revenue. When compared to granular activated carbon, powdered activated carbon (PAC) has a smaller particle size and so has a higher surface-to-volume ratio. As a result, PAC is commonly introduced to process units such as quick mix basins, clarifiers, and gravity filters directly.

Activated carbon is traditionally manufactured as powders or small granules less than 1.0 mm in diameter with an average diameter of 0.15 mm to 0.25 mm. The efficiency of PAC in adsorbing tastes and odors is dependent on proper mixing, contact time, dosage, and the source and severity of the odor or taste problem. PAC is consumed in a variety of applications, including wastewater treatment.Activated Carbon Market 1

Based on Application, the activated carbon market is segmented as follows, liquid phase applications (water treatment, food & beverages, pharmaceutical & medical, and others), gas-phase applications (automotive, industrial (air purification, flue gas cleaning, mercury control, solvent recovery), and others). In 2025, the liquid phase applications segment was dominant of the overall market in terms of revenue. Potable water treatment, groundwater treatment, decolorization, industrial water treatment, precious metal (gold) recovery, and chemical and pharmaceutical wastewater treatment are among applications where activated carbon is used in the liquid phase. Activated carbon demand is expected to grow throughout the forecast period, particularly for developing applications such as boiler feedwater treatment, medicinal therapies for chronic kidney disease, and the electronic industry's manufacturing of ultrapure water.

Global Activated Carbon Market Regional Insights:

In 2025, in terms of revenue, the Asia Pacific region was dominating, accounting for more than 39.26% of the overall market. The Asia Pacific region's economic expansion has been driven by factors such as the ready supply of raw materials and labor, as well as advanced technologies and innovations. China and Japan, the two economic titans of the Asia Pacific region, were the world's second and third largest economies in according to the World Bank.Activated Carbon Market 2


High GDP rates in comparison to mature countries in North America and Europe, as well as rising end-use industries including chemicals, petrochemicals, and food and beverages, are expected to drive demand. Haycarb Plc. (Sri Lanka) and Osaka Gas Co. Ltd. (Japan) are two of the region's top activated carbon producers, controlling the supply chain.

Recent Industry Developments (2025–2026)

Exact Date Company Development Impact
15 January 2026 Liquid Phase Adsorption A new global strategic initiative was launched to optimize Liquid Phase Adsorption techniques for municipal water treatment. Enhances the adsorption efficiency of granular activated carbon in large-scale filtration infrastructure.
07 October 2025 Kuraray Co., Ltd. Announced a strategic expansion of activated carbon production capacity specifically targeting the Asia-Pacific water treatment sector. Strengthens its market leadership in the region, which currently accounts for over 43% of global market share.
18 August 2025 Calgon Carbon Corporation Implemented new PFAS Adsorption Treatment protocols using advanced granular activated carbon to comply with updated US EPA standards. Positions the company as a key provider for regulatory-driven upgrades in municipal water utilities across North America.
05 March 2025 Ingevity Launched a new line of automotive evaporative emission control canisters utilizing high-mesopore activated carbon. Drives growth in the gas-phase segment as automotive manufacturers seek to meet stricter global emission regulations.
12 February 2025 Jacobi Carbons Group Unveiled its 2025 sustainability roadmap featuring steam-efficient rotary-kiln reactivation technologies to reduce energy consumption. Reduces operational costs by 20-30% compared to virgin carbon production, catering to the rising demand for reactivated carbon.

The objective of the report is to present a comprehensive analysis of the market to the stakeholders in the industry. The past and current status of the industry with the forecasted market size and trends are presented in the report with the analysis of complicated data in simple language. The report covers all the aspects of the industry with a dedicated study of key players that include market leaders, followers, and new entrants.

PORTER, PESTEL analysis with the potential impact of micro-economic factors of the market have been presented in the report. External as well as internal factors that are supposed to affect the business positively or negatively have been analyzed, which will give a clear futuristic view of the industry to the decision-makers.

The report also helps in understanding the global market dynamics, structure by analyzing the market segments and projecting the global market size. Clear representation of competitive analysis of key players by product, price, financial position, product portfolio, growth strategies, and regional presence in the global market makes the report investor's guide.

Global Activated Carbon Market Scope: Inquire before buying

Activated Carbon Market
Report Coverage Details
Base Year: 2025 Forecast Period: 2026-2032
Historical Data: 2020 to 2025 Market Size in 2025: 11.62 USD Billion
Forecast Period 2026-2032 CAGR: 8.86% Market Size in 2032: 21.05 USD Billion
Segments Covered: by Type Powdered Activated Carbon
Granulated Activated Carbon
Others
by Application Liquid Applications
Water Treatment
Food & Beverages
Pharmaceutical & Medical
Others
Gas-Phase Applications
Automotive
Industrial
Others
by Raw Material Coal Based
Coconut Shell Based
Wood/Coal
Others (Petroleum Pitch, etc.)

Global Activated Carbon Market, by Region

North America (United States, Canada and Mexico)
Europe (UK, France, Germany, Italy, Spain, Sweden, Austria, Turkey, Russia and Rest of Europe)
Asia Pacific (China, India, Japan, South Korea, Australia, ASEAN and Rest of APAC)
Middle East and Africa (South Africa, GCC, Egypt, Nigeria and Rest of ME&A)
South America (Brazil, Argentina, Columbia and Rest of South America)

Key players/ competitors profile covered in brief in Activated Carbon Market report in strategic perspective

  1. Osaka Gas Chemicals Co., Ltd.
  2. Cabot Corporation
  3. Kuraray Co., Ltd.
  4. Haycarb PLC
  5. Kureha Corporation
  6. Jacobi Carbons AB
  7. Calgon Carbon Corporation
  8. CarboTech AC GmbH
  9. Ingevity Corporation
  10. Donau Carbon GmbH
  11. Puragen Activated Carbons
  12. Carbon Activated Corporation
  13. Boyce Carbon
  14. Silcarbon Aktivkohle GmbH
  15. DESOTEC Activated Carbon
  16. Albemarle Corporation
  17. BASF SE
  18. Evoqua Water Technologies LLC
  19. Norit
  20. Suneeta Carbons
  21. Micbac India
  22. Nanping Yuanli Active Carbon Co., Ltd.
  23. Xylem Inc.
  24. CPL Activated Carbons
  25. Advanced Carbon Technologies

Table of Contents

1. Activated Carbon Market Introduction
1.1. Study Assumption and Market Definition
1.2. Scope of the Study
1.3. Executive Summary
2. Global Activated Carbon Market: Competitive Landscape
2.1. MMR Competition Matrix
2.2. Competitive Landscape
2.3. Key Players Benchmarking
2.3.1. Company Name
2.3.2. Business Segment
2.3.3. End-user Segment
2.3.4. Revenue (2025)
2.3.5. Company Locations
2.4. Leading Activated Carbon Market Companies, by market capitalization
2.5. Market Structure
2.5.1. Market Leaders
2.5.2. Market Followers
2.5.3. Emerging Players
2.6. Mergers and Acquisitions Details
3. Activated Carbon Market: Dynamics
3.1. Activated Carbon Market Trends by Region
3.1.1. North America Activated Carbon Market Trends
3.1.2. Europe Activated Carbon Market Trends
3.1.3. Asia Pacific Activated Carbon Market Trends
3.1.4. Middle East and Africa Activated Carbon Market Trends
3.1.5. South America Activated Carbon Market Trends
3.2. Activated Carbon Market Dynamics by Region
3.2.1. North America
3.2.1.1. North America Activated Carbon Market Drivers
3.2.1.2. North America Activated Carbon Market Restraints
3.2.1.3. North America Activated Carbon Market Opportunities
3.2.1.4. North America Activated Carbon Market Challenges
3.2.2. Europe
3.2.2.1. Europe Activated Carbon Market Drivers
3.2.2.2. Europe Activated Carbon Market Restraints
3.2.2.3. Europe Activated Carbon Market Opportunities
3.2.2.4. Europe Activated Carbon Market Challenges
3.2.3. Asia Pacific
3.2.3.1. Asia Pacific Activated Carbon Market Drivers
3.2.3.2. Asia Pacific Activated Carbon Market Restraints
3.2.3.3. Asia Pacific Activated Carbon Market Opportunities
3.2.3.4. Asia Pacific Activated Carbon Market Challenges
3.2.4. Middle East and Africa
3.2.4.1. Middle East and Africa Activated Carbon Market Drivers
3.2.4.2. Middle East and Africa Activated Carbon Market Restraints
3.2.4.3. Middle East and Africa Activated Carbon Market Opportunities
3.2.4.4. Middle East and Africa Activated Carbon Market Challenges
3.2.5. South America
3.2.5.1. South America Activated Carbon Market Drivers
3.2.5.2. South America Activated Carbon Market Restraints
3.2.5.3. South America Activated Carbon Market Opportunities
3.2.5.4. South America Activated Carbon Market Challenges
3.3. PORTER's Five Forces Analysis
3.4. PESTLE Analysis
3.5. Technology Roadmap
3.6. Regulatory Landscape by Region
3.6.1. North America
3.6.2. Europe
3.6.3. Asia Pacific
3.6.4. Middle East and Africa
3.6.5. South America
3.7. Key Opinion Leader Analysis For Activated Carbon Industry
3.8. Analysis of Government Schemes and Initiatives For Activated Carbon Industry
3.9. Activated Carbon Market Trade Analysis
3.10. The Global Pandemic Impact on Activated Carbon Market
4. Activated Carbon Market: Global Market Size and Forecast by Segmentation (in USD Billion) 2025-2032
4.1. Activated Carbon Market Size and Forecast, by Type (2025-2032)
4.1.1. Powdered Activated Carbon
4.1.2. Granulated Activated Carbon
4.1.3. Others
4.2. Activated Carbon Market Size and Forecast, by Application (2025-2032)
4.2.1. Liquid Applications
4.2.2. Water Treatment
4.2.3. Food & Beverages
4.2.4. Pharmaceutical & Medical
4.2.5. Others
4.2.6. Gas-Phase Applications
4.2.7. Automotive
4.2.8. Industrial
4.3. Activated Carbon Market Size and Forecast, by Raw Material (2025-2032)
4.3.1. Coal Based
4.3.2. Coconut Shell Based
4.3.3. Wood/Coal
4.3.4. Others (Petroleum Pitch, etc.)
4.4. Activated Carbon Market Size and Forecast, by Region (2025-2032)
4.4.1. North America
4.4.2. Europe
4.4.3. Asia Pacific
4.4.4. Middle East and Africa
4.4.5. South America
5. North America Activated Carbon Market Size and Forecast by Segmentation (in USD Billion) 2025-2032
5.1. North America Activated Carbon Market Size and Forecast, by Type (2025-2032)
5.1.1. Powdered Activated Carbon
5.1.2. Granulated Activated Carbon
5.1.3. Others
5.2. North America Activated Carbon Market Size and Forecast, by Application (2025-2032)
5.2.1. Liquid Applications
5.2.2. Water Treatment
5.2.3. Food & Beverages
5.2.4. Pharmaceutical & Medical
5.2.5. Others
5.2.6. Gas-Phase Applications
5.2.7. Automotive
5.2.8. Industrial
5.3. North America Activated Carbon Market Size and Forecast, by Raw Material (2025-2032)
5.3.1. Coal Based
5.3.2. Coconut Shell Based
5.3.3. Wood/Coal
5.3.4. Others (Petroleum Pitch, etc.)
5.4. North America Activated Carbon Market Size and Forecast, by Country (2025-2032)
5.4.1. United States
5.4.1.1. United States Activated Carbon Market Size and Forecast, by Type (2025-2032)
5.4.1.1.1. Powdered Activated Carbon
5.4.1.1.2. Granulated Activated Carbon
5.4.1.1.3. Others
5.4.1.2. United States Activated Carbon Market Size and Forecast, by Application (2025-2032)
5.4.1.2.1. Liquid Applications
5.4.1.2.2. Water Treatment
5.4.1.2.3. Food & Beverages
5.4.1.2.4. Pharmaceutical & Medical
5.4.1.2.5. Others
5.4.1.2.6. Gas-Phase Applications
5.4.1.2.7. Automotive
5.4.1.2.8. Industrial
5.4.1.3. United States Activated Carbon Market Size and Forecast, by Raw Material (2025-2032)
5.4.1.3.1. Coal Based
5.4.1.3.2. Coconut Shell Based
5.4.1.3.3. Wood/Coal
5.4.1.3.4. Others (Petroleum Pitch, etc.)
5.4.2. Canada
5.4.2.1. Canada Activated Carbon Market Size and Forecast, by Type (2025-2032)
5.4.2.1.1. Powdered Activated Carbon
5.4.2.1.2. Granulated Activated Carbon
5.4.2.1.3. Others
5.4.2.2. Canada Activated Carbon Market Size and Forecast, by Application (2025-2032)
5.4.2.2.1. Liquid Applications
5.4.2.2.2. Water Treatment
5.4.2.2.3. Food & Beverages
5.4.2.2.4. Pharmaceutical & Medical
5.4.2.2.5. Others
5.4.2.2.6. Gas-Phase Applications
5.4.2.2.7. Automotive
5.4.2.2.8. Industrial
5.4.2.3. Canada Activated Carbon Market Size and Forecast, by Raw Material (2025-2032)
5.4.2.3.1. Coal Based
5.4.2.3.2. Coconut Shell Based
5.4.2.3.3. Wood/Coal
5.4.2.3.4. Others (Petroleum Pitch, etc.)
5.4.3. Mexico
5.4.3.1. Mexico Activated Carbon Market Size and Forecast, by Type (2025-2032)
5.4.3.1.1. Powdered Activated Carbon
5.4.3.1.2. Granulated Activated Carbon
5.4.3.1.3. Others
5.4.3.2. Mexico Activated Carbon Market Size and Forecast, by Application (2025-2032)
5.4.3.2.1. Liquid Applications
5.4.3.2.2. Water Treatment
5.4.3.2.3. Food & Beverages
5.4.3.2.4. Pharmaceutical & Medical
5.4.3.2.5. Others
5.4.3.2.6. Gas-Phase Applications
5.4.3.2.7. Automotive
5.4.3.2.8. Industrial
5.4.3.3. Mexico Activated Carbon Market Size and Forecast, by Raw Material (2025-2032)
5.4.3.3.1. Coal Based
5.4.3.3.2. Coconut Shell Based
5.4.3.3.3. Wood/Coal
5.4.3.3.4. Others (Petroleum Pitch, etc.)
6. Europe Activated Carbon Market Size and Forecast by Segmentation (in USD Billion) 2025-2032
6.1. Europe Activated Carbon Market Size and Forecast, by Type (2025-2032)
6.2. Europe Activated Carbon Market Size and Forecast, by Application (2025-2032)
6.3. Europe Activated Carbon Market Size and Forecast, by Raw Material (2025-2032)
6.4. Europe Activated Carbon Market Size and Forecast, by Country (2025-2032)
6.4.1. United Kingdom
6.4.1.1. United Kingdom Activated Carbon Market Size and Forecast, by Type (2025-2032)
6.4.1.2. United Kingdom Activated Carbon Market Size and Forecast, by Application (2025-2032)
6.4.1.3. United Kingdom Activated Carbon Market Size and Forecast, by Raw Material (2025-2032)
6.4.2. France
6.4.2.1. France Activated Carbon Market Size and Forecast, by Type (2025-2032)
6.4.2.2. France Activated Carbon Market Size and Forecast, by Application (2025-2032)
6.4.2.3. France Activated Carbon Market Size and Forecast, by Raw Material (2025-2032)
6.4.3. Germany
6.4.3.1. Germany Activated Carbon Market Size and Forecast, by Type (2025-2032)
6.4.3.2. Germany Activated Carbon Market Size and Forecast, by Application (2025-2032)
6.4.3.3. Germany Activated Carbon Market Size and Forecast, by Raw Material (2025-2032)
6.4.4. Italy
6.4.4.1. Italy Activated Carbon Market Size and Forecast, by Type (2025-2032)
6.4.4.2. Italy Activated Carbon Market Size and Forecast, by Application (2025-2032)
6.4.4.3. Italy Activated Carbon Market Size and Forecast, by Raw Material (2025-2032)
6.4.5. Spain
6.4.5.1. Spain Activated Carbon Market Size and Forecast, by Type (2025-2032)
6.4.5.2. Spain Activated Carbon Market Size and Forecast, by Application (2025-2032)
6.4.5.3. Spain Activated Carbon Market Size and Forecast, by Raw Material (2025-2032)
6.4.6. Sweden
6.4.6.1. Sweden Activated Carbon Market Size and Forecast, by Type (2025-2032)
6.4.6.2. Sweden Activated Carbon Market Size and Forecast, by Application (2025-2032)
6.4.6.3. Sweden Activated Carbon Market Size and Forecast, by Raw Material (2025-2032)
6.4.7. Austria
6.4.7.1. Austria Activated Carbon Market Size and Forecast, by Type (2025-2032)
6.4.7.2. Austria Activated Carbon Market Size and Forecast, by Application (2025-2032)
6.4.7.3. Austria Activated Carbon Market Size and Forecast, by Raw Material (2025-2032)
6.4.8. Rest of Europe
6.4.8.1. Rest of Europe Activated Carbon Market Size and Forecast, by Type (2025-2032)
6.4.8.2. Rest of Europe Activated Carbon Market Size and Forecast, by Application (2025-2032)
6.4.8.3. Rest of Europe Activated Carbon Market Size and Forecast, by Raw Material (2025-2032)
7. Asia Pacific Activated Carbon Market Size and Forecast by Segmentation (in USD Billion) 2025-2032
7.1. Asia Pacific Activated Carbon Market Size and Forecast, by Type (2025-2032)
7.2. Asia Pacific Activated Carbon Market Size and Forecast, by Application (2025-2032)
7.3. Asia Pacific Activated Carbon Market Size and Forecast, by Raw Material (2025-2032)
7.4. Asia Pacific Activated Carbon Market Size and Forecast, by Country (2025-2032)
7.4.1. China
7.4.1.1. China Activated Carbon Market Size and Forecast, by Type (2025-2032)
7.4.1.2. China Activated Carbon Market Size and Forecast, by Application (2025-2032)
7.4.1.3. China Activated Carbon Market Size and Forecast, by Raw Material (2025-2032)
7.4.2. S Korea
7.4.2.1. S Korea Activated Carbon Market Size and Forecast, by Type (2025-2032)
7.4.2.2. S Korea Activated Carbon Market Size and Forecast, by Application (2025-2032)
7.4.2.3. S Korea Activated Carbon Market Size and Forecast, by Raw Material (2025-2032)
7.4.3. Japan
7.4.3.1. Japan Activated Carbon Market Size and Forecast, by Type (2025-2032)
7.4.3.2. Japan Activated Carbon Market Size and Forecast, by Application (2025-2032)
7.4.3.3. Japan Activated Carbon Market Size and Forecast, by Raw Material (2025-2032)
7.4.4. India
7.4.4.1. India Activated Carbon Market Size and Forecast, by Type (2025-2032)
7.4.4.2. India Activated Carbon Market Size and Forecast, by Application (2025-2032)
7.4.4.3. India Activated Carbon Market Size and Forecast, by Raw Material (2025-2032)
7.4.5. Australia
7.4.5.1. Australia Activated Carbon Market Size and Forecast, by Type (2025-2032)
7.4.5.2. Australia Activated Carbon Market Size and Forecast, by Application (2025-2032)
7.4.5.3. Australia Activated Carbon Market Size and Forecast, by Raw Material (2025-2032)
7.4.6. Indonesia
7.4.6.1. Indonesia Activated Carbon Market Size and Forecast, by Type (2025-2032)
7.4.6.2. Indonesia Activated Carbon Market Size and Forecast, by Application (2025-2032)
7.4.6.3. Indonesia Activated Carbon Market Size and Forecast, by Raw Material (2025-2032)
7.4.7. Malaysia
7.4.7.1. Malaysia Activated Carbon Market Size and Forecast, by Type (2025-2032)
7.4.7.2. Malaysia Activated Carbon Market Size and Forecast, by Application (2025-2032)
7.4.7.3. Malaysia Activated Carbon Market Size and Forecast, by Raw Material (2025-2032)
7.4.8. Vietnam
7.4.8.1. Vietnam Activated Carbon Market Size and Forecast, by Type (2025-2032)
7.4.8.2. Vietnam Activated Carbon Market Size and Forecast, by Application (2025-2032)
7.4.8.3. Vietnam Activated Carbon Market Size and Forecast, by Raw Material (2025-2032)
7.4.9. Taiwan
7.4.9.1. Taiwan Activated Carbon Market Size and Forecast, by Type (2025-2032)
7.4.9.2. Taiwan Activated Carbon Market Size and Forecast, by Application (2025-2032)
7.4.9.3. Taiwan Activated Carbon Market Size and Forecast, by Raw Material (2025-2032)
7.4.10. Rest of Asia Pacific
7.4.10.1. Rest of Asia Pacific Activated Carbon Market Size and Forecast, by Type (2025-2032)
7.4.10.2. Rest of Asia Pacific Activated Carbon Market Size and Forecast, by Application (2025-2032)
7.4.10.3. Rest of Asia Pacific Activated Carbon Market Size and Forecast, by Raw Material (2025-2032)
8. Middle East and Africa Activated Carbon Market Size and Forecast by Segmentation (in USD Billion) 2025-2032
8.1. Middle East and Africa Activated Carbon Market Size and Forecast, by Type (2025-2032)
8.2. Middle East and Africa Activated Carbon Market Size and Forecast, by Application (2025-2032)
8.3. Middle East and Africa Activated Carbon Market Size and Forecast, by Raw Material (2025-2032)
8.4. Middle East and Africa Activated Carbon Market Size and Forecast, by Country (2025-2032)
8.4.1. South Africa
8.4.1.1. South Africa Activated Carbon Market Size and Forecast, by Type (2025-2032)
8.4.1.2. South Africa Activated Carbon Market Size and Forecast, by Application (2025-2032)
8.4.1.3. South Africa Activated Carbon Market Size and Forecast, by Raw Material (2025-2032)
8.4.2. GCC
8.4.2.1. GCC Activated Carbon Market Size and Forecast, by Type (2025-2032)
8.4.2.2. GCC Activated Carbon Market Size and Forecast, by Application (2025-2032)
8.4.2.3. GCC Activated Carbon Market Size and Forecast, by Raw Material (2025-2032)
8.4.3. Nigeria
8.4.3.1. Nigeria Activated Carbon Market Size and Forecast, by Type (2025-2032)
8.4.3.2. Nigeria Activated Carbon Market Size and Forecast, by Application (2025-2032)
8.4.3.3. Nigeria Activated Carbon Market Size and Forecast, by Raw Material (2025-2032)
8.4.4. Rest of ME&A
8.4.4.1. Rest of ME&A Activated Carbon Market Size and Forecast, by Type (2025-2032)
8.4.4.2. Rest of ME&A Activated Carbon Market Size and Forecast, by Application (2025-2032)
8.4.4.3. Rest of ME&A Activated Carbon Market Size and Forecast, by Raw Material (2025-2032)
9. South America Activated Carbon Market Size and Forecast by Segmentation (in USD Billion) 2025-2032
9.1. South America Activated Carbon Market Size and Forecast, by Type (2025-2032)
9.2. South America Activated Carbon Market Size and Forecast, by Application (2025-2032)
9.3. South America Activated Carbon Market Size and Forecast, by Raw Material (2025-2032)
9.4. South America Activated Carbon Market Size and Forecast, by Country (2025-2032)
9.4.1. Brazil
9.4.1.1. Brazil Activated Carbon Market Size and Forecast, by Type (2025-2032)
9.4.1.2. Brazil Activated Carbon Market Size and Forecast, by Application (2025-2032)
9.4.1.3. Brazil Activated Carbon Market Size and Forecast, by Raw Material (2025-2032)
9.4.2. Argentina
9.4.2.1. Argentina Activated Carbon Market Size and Forecast, by Type (2025-2032)
9.4.2.2. Argentina Activated Carbon Market Size and Forecast, by Application (2025-2032)
9.4.2.3. Argentina Activated Carbon Market Size and Forecast, by Raw Material (2025-2032)
9.4.3. Rest Of South America
9.4.3.1. Rest Of South America Activated Carbon Market Size and Forecast, by Type (2025-2032)
9.4.3.2. Rest Of South America Activated Carbon Market Size and Forecast, by Application (2025-2032)
9.4.3.3. Rest Of South America Activated Carbon Market Size and Forecast, by Raw Material (2025-2032)
10. Company Profile: Key Players
10.1. Osaka Gas Chemicals Co. Ltd.
10.1.1. Company Overview
10.1.2. Business Portfolio
10.1.3. Financial Overview
10.1.4. SWOT Analysis
10.1.5. Strategic Analysis
10.1.6. Scale of Operation (small, medium, and large)
10.1.7. Details on Partnership
10.1.8. Regulatory Accreditations and Certifications Received by Them
10.1.9. Awards Received by the Firm
10.1.10. Recent Developments
10.2. Cabot Corporation
10.3. Kuraray Co. Ltd.
10.4. Haycarb PLC
10.5. Kureha Corporation
10.6. Jacobi Carbons AB
10.7. Calgon Carbon Corporation
10.8. CarboTech AC GmbH
10.9. Ingevity Corporation
10.10. Donau Carbon GmbH
10.11. Puragen Activated Carbons
10.12. Carbon Activated Corporation
10.13. Boyce Carbon
10.14. Silcarbon Aktivkohle GmbH
10.15. DESOTEC Activated Carbon
10.16. Albemarle Corporation
10.17. BASF SE
10.18. Evoqua Water Technologies LLC
10.19. Norit
10.20. Suneeta Carbons
10.21. Micbac India
10.22. Nanping Yuanli Active Carbon Co. Ltd.
10.23. Xylem Inc.
10.24. CPL Activated Carbons
10.25. Advanced Carbon Technologies
11. Key Findings
12. Industry Recommendations
13. Activated Carbon Market: Research Methodology
14. Terms and Glossary

Custom Market Research Services

We Will Customise The Research For You, In Case The Report Listed Above Does Not Meet With Your Requirements