
Data Center Power Consumption Market Size by Power Consumption Component, Power Source, Data Center Type, Workload Type and Region
Overview
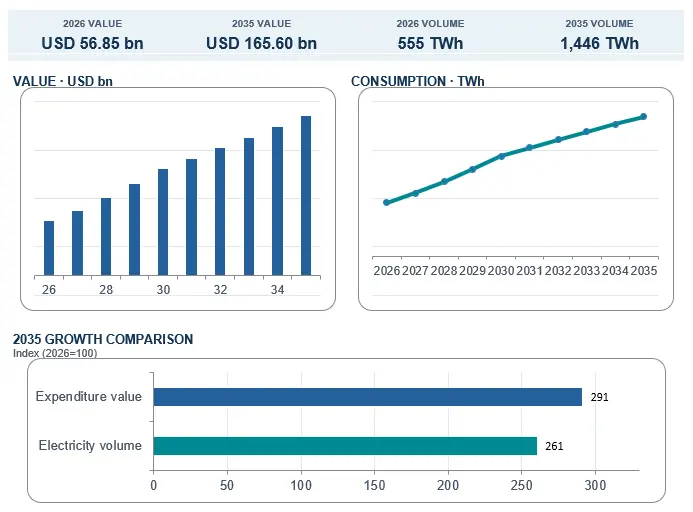
The Global Data Center Power Consumption Market was valued at USD 56.9 billion in 2026 and is projected to reach USD 165.6 billion by 2035, growing at a CAGR of 12.6% from 2026 to 2035.
|
2026 VALUE |
2035 VALUE |
2026 VOLUME |
2035 VOLUME |
VALUE CAGR |
VOLUME CAGR |
|
USD 56.9 Bn |
USD 165.6 Bn |
555 TWh |
1,446 TWh |
12.6% |
11.2% |
The market represents the total monetary value of electricity consumed by hyperscale, colocation, enterprise, and service-provider data centers. It includes electricity expenditure for servers, AI computing, data storage, networking, cooling, and supporting infrastructure. Market growth is driven by increasing AI workloads, cloud computing expansion, hyperscale investments, and rising demand for high-performance computing. Global data center electricity consumption reached 555 TWh in 2026, highlighting the importance of electricity procurement and operational efficiency.
North America is a leading regional market, supported by extensive hyperscale infrastructure and AI investments in the United States. China, India, Japan, and Singapore are strengthening Asia Pacific demand, while Germany, the United Kingdom, and France support European growth through cloud infrastructure expansion and energy-efficient data center development. Major companies include Amazon Web Services, Microsoft, Google, Meta Platforms, Equinix, Digital Realty, and NTT Global Data Centers. Operators are increasingly adopting liquid cooling, renewable electricity procurement, and energy-efficient technologies to control electricity costs.
The MMR report is designed to compare consumption economics, site-level operating characteristics, power procurement routes, geographic constraints and the implications of AI-driven rack density. It connects commercial energy expenditure to decisions on location, capacity, efficiency, tariff exposure and power contracting without treating operator capacity as equivalent to consumed electricity.
Global Data Center Power Consumption Market Growth Outlook
To know about the Research Methodology :- Request Free Sample Report
Annual Global Data Center Power Consumption Market forecast: value and volume
| Year | Volume (TWh) | Value (USD bn) | Weighted price (USD/MWh) | YoY volume growth |
| 2026 | 555.0 | 56.85 | 102.4 | — |
| 2027 | 654.6 | 67.66 | 103.4 | 17.9% |
| 2028 | 773.5 | 80.73 | 104.4 | 18.2% |
| 2029 | 902.6 | 95.20 | 105.5 | 16.7% |
| 2030 | 1,036.9 | 110.65 | 106.7 | 14.9% |
| 2031 | 1,122.7 | 121.47 | 108.2 | 8.3% |
| 2032 | 1,206.7 | 132.41 | 109.7 | 7.5% |
| 2033 | 1,287.8 | 143.33 | 111.3 | 6.7% |
| 2034 | 1,367.9 | 154.42 | 112.9 | 6.2% |
| 2035 | 1,446.0 | 165.60 | 114.5 | 5.7% |
Global electricity demand–supply analysis
Sufficient annual electricity generation does not guarantee deliverable peak power. Firm MW, transmission access and transformer availability govern when new campuses can operate.
Global electricity demand is projected to increase from 28,600 TWh in 2025 to 30,700 TWh in 2027. New generation cannot remove local network bottlenecks without corresponding transmission and distribution investment.
Data-centre demand and supply constraint chain
| Planning Test | Potential Constraint | Result for Forecast / Investment |
| Annual Energy (TWh) | Electricity generation availability, fuel-price volatility, supply shortages, and exposure to changing electricity tariffs. | Changes electricity acquisition costs and operating expenditure but does not necessarily prevent data center commissioning if adequate power capacity is available. |
| Peak Firm Power (MW) | Insufficient dispatchable generation capacity, reliability requirements, peak-load limitations, and inadequate reserve margins. | Determines whether a data center can receive dependable electricity supply and whether additional firm generation, storage, or backup capacity is required. |
| Network Import Capacity (MW) | Grid congestion, transformer capacity limitations, transmission bottlenecks, and lengthy interconnection queues. | Defers facility commissioning, restricts operational capacity, or redirects investment toward locations with stronger grid infrastructure. |
| Water and Environmental Permits | Cooling-water availability, land-use restrictions, generator emissions, environmental impact requirements, and community opposition. | Requires facility redesign, alternative cooling technologies, additional environmental safeguards, or revised project timelines. Approval conditions may increase development costs without necessarily cancelling projects. |
| Electricity Contracting and Demand Flexibility | Power purchase agreement (PPA) duration, electricity price volatility, transmission congestion, on-site generation requirements, and limited demand-response flexibility. | Alters project financing, electricity cost hedging, procurement strategies, and operational flexibility. Long-term contracts and flexible workloads can reduce exposure to electricity price and supply risks. |
Country-wise Data Center Power Demand, source dependence and supply risks
The United States leads modelled data center electricity consumption in 2026 at 244 TWh, followed by China at 128 TWh. Grid congestion, power availability and rising AI infrastructure demand create high supply risks in major markets, including India, Germany and the United Kingdom. Meanwhile, France and Canada benefit from nuclear and hydropower resources. Regional electricity generation mixes, supply constraints and energy costs influence data center investment and expansion strategies.
| Country | 2026 TWh (model) | National electricity mix (qualitative) | Supply risk (model) | Main investment / policy issue |
| United States | 244 | Gas, nuclear, coal, wind/solar | High | PJM/Virginia and other clusters |
| China | 128 | Coal-led; growing renewables, hydro, nuclear | High | AI clusters and east-to-west computing |
| India | 14 | Coal-led generation; rapid solar/wind capacity | High | Mumbai/Chennai and new campuses |
| Germany | 23 | Renewables, gas, coal; imports | High | Frankfurt corridor |
| United Kingdom | 12 | Gas, wind, nuclear, imports | High | London/South East congestion and high |
| France | 11 | Nuclear-led; hydro/renewables | Medium | RTE grid and low-carbon supply |
| Ireland | 8 | Gas, wind, imports | High | CRU requires linked generation/storage and |
| Netherlands | 6 | Gas, wind/solar, imports | High | Amsterdam grid congestion |
| Japan | 19 | LNG/coal, nuclear, solar | Medium–High | Power costs and grid regions |
| South Korea | 10 | Nuclear, coal, LNG, renewables | Medium–High | Seoul concentration |
| Singapore | 8 | Natural gas-led; imported low-carbon plans | High | Land/energy scarcity |
| Australia | 6 | Coal/gas with fast wind/solar expansion | Medium | Grid congestion and east-coast supply |
| Canada | 14 | Hydro, nuclear, natural gas | Medium | Provincial hydro availability |
| United Arab Emirates | 4 | Gas, nuclear, solar | Medium | Cooling load and new AI |
| Saudi Arabia | 3 | Gas/oil; expanding renewables | Medium–High | Heat-driven cooling and generation diversification |
| Brazil | 9 | Hydro, wind, solar, thermal balancing | Medium | Hydrology / grid access |
Country-wise national electricity generation dependence matrix
| Country | Coal | Gas | Nuclear | Hydro | Wind / solar | Oil |
| United States | M | H | M | L | M | L |
| China | H | L | L | M | M | L |
| India | H | L | L | M | M | L |
| Germany | M | M | — | L | H | L |
| United Kingdom | L | H | M | L | H | L |
| France | L | L | H | M | M | L |
| Ireland | L | H | — | L | H | L |
| Netherlands | L | H | — | L | H | L |
| Japan | H | H | M | L | M | L |
| South Korea | H | H | H | L | L | L |
| Singapore | L | H | — | — | L | L |
| Australia | H | M | — | L | H | L |
| Canada | L | M | M | H | M | L |
| United Arab Emirates | L | H | M | L | M | L |
| Saudi Arabia | L | H | — | — | L | H |
| Brazil | L | M | L | H | H | L |
Market growth drivers and infrastructure restraints
AI computing, cloud expansion and workload intensity
AI-focused data-center electricity consumption increased about 50% in 2025, against approximately 17% overall. The model assumes AI workloads rise from 24% of facility use in 2026 to 45% in 2035; these are not measured shares.
Enterprise digitalization, storage and regional investment
Cloud migration and data storage sustain baseline electricity use alongside AI. Actual consumption depends on equipment installation, commissioning and utilization rather than announced campus capacity alone.
Grid, cost, water and permitting restraints
Connection queues, price volatility, water limits and permits can delay commissioning or force redesign. They do not automatically eliminate computing demand.
Environmental opposition, community resistance and permitting outcomes
Community objections concern water, noise, emissions, land, grid upgrades and electricity bills. Outcomes include permit conditions, redesign, delay or rejection rather than uniform cancellation.
United States: Virginia Digital Gateway and Arizona Project Blue
A July 29, 2026 Virginia court order voided Digital Gateway rezoning approvals, restoring former zoning. Any renewed proposal requires rezoning; the ruling affects proposed rather than operating capacity.
Tucson declined to support Project Blue in 2025 amid water concerns. Development continued outside the city under revised cooling and water arrangements; opposition did not conclusively cancel the project.
Chile: cooling-system and environmental impact assessment
Environmental scrutiny of Google's Cerrillos proposal in Chile prompted reconsideration of cooling-water arrangements. Alternative cooling designs can change energy requirements and permit timing.
Ireland: grid adequacy and changing planning decisions
Ireland's data-center connection policy emphasizes firm capacity, storage and renewables. A Dublin extension obtained conditional permission on appeal in September 2026; approval does not establish commissioning.
Environmental opposition and infrastructure risk impact matrix
| Risk type | Documented example | Current effect | Forecast channel |
| Land use / process | Virginia Digital Gateway, court order 2026 | Rezoning voided; resubmission required | Delayed / uncertain site probability |
| Cooling water / community | Arizona Project Blue, Tucson 2025–26 | City water access rejected; project evolved | Cooling design / siting costs |
| Water / climate review | Chile Cerrillos, environmental court 2024 | Cooling redesigned; review reset | Permitting timeline and PUE trade-off |
| Firm capacity / policy | Ireland CRU 2025; Dublin appeal 2026 | Connection conditions; appeal approval | More firm capacity and local planning |
Emerging technology trends and future opportunities
Direct-to-chip cooling is deployed commercially; immersion cooling is more specialized. Efficiency gains depend on equipment loads, climate, water availability and heat reuse.
Meta's nuclear agreements cover up to 6.6 GW of existing and proposed capacity by 2035. The figure is not electricity already delivered; proposed reactors still face licensing and construction risks.
Data Center Power Consumption Market by Segment
By power consumption component
The component model allocates metered electricity to seven mutually exclusive end uses: conventional CPU-based servers; accelerated GPU/AI servers; data storage; networking; cooling and environmental control; power conversion and distribution losses; and other auxiliary loads. Conventional and accelerated server classes are distinguished by the equipment performing the workload, preventing the same GPU server from appearing in two categories.
|
TOTAL FACILITY ELECTRICITY METER |
||||||
|
IT / COMPUTING LOADS |
FACILITY / OVERHEAD LOADS |
|||||
|
CPU |
AI/GPU |
STORAGE |
NETWORKING |
COOLING |
POWER |
AUXILIARY |
By power source
The source segmentation distinguishes grid-supplied electricity, directly supplied renewable electricity and directly supplied non-renewable electricity. Classification is based on the physical supply pathway into the facility rather than the marketing label of a power purchase agreement. A renewable PPA settled through the public grid remains grid-supplied; a dedicated direct-wire solar or wind connection is classified as direct-supplied renewable. On-site gas generation used to serve the facility belongs in direct non-renewable supply, while battery discharge is attributed to the electricity source that charged it. This structure prevents double counting of renewable claims, grid imports and storage throughput.
|
GRID-SUPPLIED |
DIRECT RENEWABLE |
DIRECT NON-RENEWABLE |
|
Utility / grid-metered |
Direct-wire or on-site |
On-site gas / other |
|
Includes grid-delivered |
Count electricity at |
Exclude exported power; |
Data Center Power Consumption Market Regional Insights
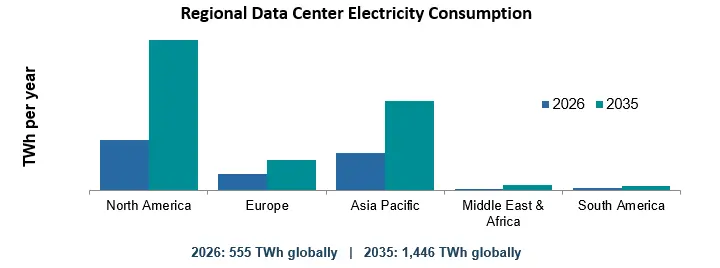
North America holds a prominent position in the data center power consumption market, driven by hyperscale infrastructure, cloud computing, and AI workloads. The United States leads regional demand, with major data center hubs in Northern Virginia, Texas, California, and the Midwest. Canada supports growth through cloud services, colocation facilities, and access to hydroelectric power. Electricity availability, grid connectivity, cooling efficiency, and long-term power contracts influence operating costs and expansion decisions.
Europe's market is driven by cloud adoption, AI computing, enterprise digitalization, and data localization requirements. Germany, the United Kingdom, France, the Netherlands, and Ireland are key markets, while Nordic countries benefit from cooler climates and renewable electricity access. Data center operators increasingly focus on energy-efficient cooling, waste-heat recovery, renewable power procurement, and energy consumption monitoring to control costs and improve sustainability.
Asia Pacific is a major growth market, supported by digitalization, cloud services, e-commerce, and AI infrastructure investments. China, Japan, South Korea, India, Singapore, and Malaysia contribute to regional demand. India's expanding hyperscale and colocation infrastructure strengthens its market position. Rising computing density, electricity requirements, grid capacity constraints, cooling needs, and renewable energy integration are shaping regional development.
The Middle East and Africa market is supported by investments in cloud computing, digital services, and AI infrastructure. The UAE and Saudi Arabia are expanding data center capacity, while South Africa remains a key regional colocation hub. Kenya and Nigeria are developing digital infrastructure markets. High temperatures, cooling requirements, electricity reliability, grid availability, and backup power systems significantly influence operating costs and facility development.
South America's data center power consumption market is driven by cloud adoption, digital payments, enterprise digitalization, and connectivity investments. Brazil leads regional activity, particularly around São Paulo, while Chile and Colombia are developing data center hubs. Hydroelectric power provides Brazil with opportunities for renewable electricity procurement. Grid capacity, electricity tariffs, financing costs, and the expansion of AI and colocation infrastructure influence future power demand.
Competitive Landscape and Business Strategies – Data Center Power Consumption Market
Competition in the data center power consumption market is driven by electricity availability, infrastructure expansion, AI computing requirements, energy efficiency, and long-term power procurement. Cloud service providers are increasing their computing capacity to support enterprise applications, generative AI, and large-scale data processing, while colocation operators are investing in high-density facilities and reliable power infrastructure. Companies are strengthening their competitive positions through renewable electricity procurement, advanced cooling systems, efficient power distribution, and strategic partnerships with utilities and energy providers. The ability to secure adequate electricity supply and manage rising power requirements is becoming an important differentiator as data center workloads increase in scale and complexity.
| Strategic group | Key players | Primary competitive strategies |
| Hyperscale cloud and AI infrastructure | Amazon Web Services (AWS), Microsoft, Google, Meta, Oracle | Expand AI and cloud computing capacity, secure long-term electricity supply, improve server utilization, and deploy energy-efficient infrastructure. |
| Colocation and interconnection | Equinix, Digital Realty, NTT Global Data Centers, CoreSite | Strengthen network connectivity, improve power reliability, support high-density computing, and optimize facility energy performance. |
| Wholesale and hyperscale facility development | QTS, Vantage Data Centers, CyrusOne, STACK Infrastructure, Aligned Data Centers | Develop large-scale campuses, secure power-ready sites, expand high-density infrastructure, and integrate advanced cooling and electrical systems. |
| Regional data center platforms | AirTrunk, NEXTDC, CtrlS, Data4, Scala Data Centers | Expand across regional digital hubs, strengthen local connectivity, develop scalable facilities, and address regional electricity and sustainability requirements. |
Technology and efficiency outlook
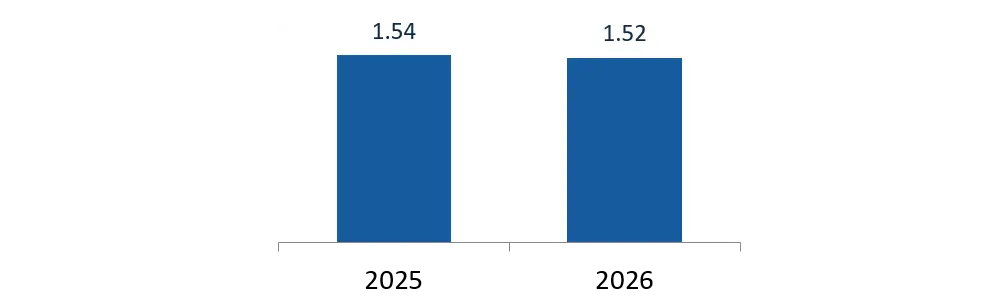
Power usage effectiveness remains an important operational metric, but comparable analysis also requires energy per useful compute outcome, IT utilization, water usage effectiveness, emissions intensity and absolute imported kWh. Uptime Institute reported a 2026 survey average PUE of 1.52, compared with 1.54 for 2025. That modest change highlights the importance of facility-specific efficiency measurement. Direct-to-chip liquid cooling, warm-water loops, heat reuse, improved voltage architecture and predictive controls can affect expenditure, but their commercial value depends on site climate, utilization and implementation cost.
The relevant research question is not merely how much new capacity is announced, but when a facility begins importing electricity, at what utilization, from which supply route and under which price structure. This separates actionable consumption forecasts from speculative project pipelines.
Recent Developments in the Data Center Power Consumption Market
| Date / Company | Recent Development | Market Implication |
| 4 March 2026 – U.S. Technology Companies | Amazon, Google, Meta, Microsoft, OpenAI, Oracle, and xAI signed the White House Ratepayer Protection Pledge, committing to secure or develop power supplies and cover associated power infrastructure upgrades for their data centers. | Strengthens dedicated electricity procurement, grid infrastructure investment, and energy cost management by data center operators. |
| 16 April 2026 – International Energy Agency (IEA) | The IEA estimated global data center electricity consumption at 485 TWh in 2025 and projected demand to reach approximately 950 TWh by 2030. | Highlights growing requirements for electricity generation, transmission capacity, cooling infrastructure, and efficient power management. |
| 4 June 2026 – Google and Intersect | Google announced the Meitner Energy Center in Texas, combining a new data center with dedicated energy generation to support electricity requirements. | Encourages integrated data center and power-generation projects to improve electricity availability and reduce grid pressure. |
| 9 June 2026 – Meta and Reliance Industries | Meta announced an agreement to lease a 168 MW AI-enabled data center in Jamnagar, Gujarat, alongside renewable energy partnerships supporting nearly 1 GW of capacity. | Strengthens India's data center expansion and increases demand for reliable electricity, AI-ready infrastructure, and renewable power procurement. |
| 22 June 2026 – Microsoft | Microsoft announced a new data center campus in Pecos, Texas, expected to expand its global data center capacity by approximately 2 GW over five to seven years. | Demonstrates the increasing infrastructure requirements of AI and cloud computing, particularly for power distribution, cooling, and grid connectivity. |
Data Center Power Consumption Market Scope: Inquire before buying
| Report Coverage | Details | ||
| Base Year | 2026 | Forecast Period | 2026–2035 |
| Historical Data | 2021–2025 | Market Value in 2026 | USD 56.85 Billion |
| Value CAGR (2026–2035) | 12.61% | Market Value in 2035 | USD 165.60 Billion |
| Consumption in 2026 | 555 TWh | Consumption in 2035 | 1,446 TWh |
| Volume CAGR (2026–2035) | 11.23% | Market Measurement | Value (USD Bn) and Volume (TWh) |
| Segments Covered | ||
| Segments Covered | By Power Consumption Component | Conventional Servers (CPU-Based Computing); Accelerated Servers (GPU/AI Computing); Data Storage Systems; Networking Equipment; Cooling and Environmental Control Systems; Power Distribution and Conversion Losses; Other Facility Auxiliary Loads |
| By Power Source | Grid-Supplied Electricity; Direct-Supplied Renewable Electricity; Direct-Supplied Non-Renewable Electricity. | |
| By Data Center Type | Hyperscale Data Centers; Colocation Data Centers; Enterprise Data Centers; Standalone Edge and Micro Data Centers | |
| By Data Center Power Capacity | Below 1 MW; 1 MW to Below 10 MW; 10 MW to Below 50 MW; 50 MW and Above | |
| By Workload Type | Artificial Intelligence and Machine Learning; Conventional Enterprise and Cloud Computing; Non-AI High-Performance Computing; Dedicated Data Storage and Network Services | |
| By Region | North America; Europe; Asia Pacific; Middle East and Africa; South America | |
Global Data Center Power Consumption Market, Key Players
1. Amazon Web Services (AWS)
2. Microsoft Corporation
3. Alphabet Inc. (Google)
4. Meta Platforms, Inc.
5. Oracle Corporation
6. Equinix, Inc.
7. Digital Realty Trust, Inc.
8. NTT Global Data Centers
9. QTS Data Centers
10. CyrusOne
11. Vantage Data Centers
12. STACK Infrastructure
13. EdgeConneX
14. Aligned Data Centers
15. CloudHQ
16. CoreSite
17. Iron Mountain Data Centers
18. Flexential
19. DataBank
20. Cologix
21. Switch, Inc.
22. Compass Datacenters
23. Data4
24. atNorth
25. Green Mountain
26. Kao Data
27. Telehouse
28. Global Switch
29. Colt Data Centre Services
30. AirTrunk
31. NEXTDC Limited
32. ST Telemedia Global Data Centres
33. GDS Holdings Limited
34. VNET Group, Inc.
35. CtrlS Datacenters Ltd.
36. Sify Technologies Limited
37. Nxtra Data Limited
38. Princeton Digital Group
39. China Telecom Corporation Limited
40. China Mobile Limited
41. Khazna Data Centers
42. Africa Data Centres
43. Scala Data Centers
44. Cirion Technologies
45. Elea Data Centers
46. Alibaba Cloud
47. Tencent Cloud
48. Baidu AI Cloud
49. IBM Cloud
50. OVHcloud
Frequently Asked Questions (FAQs) – Global Data Center Power Consumption Market
1. What is the Global Data Center Power Consumption Market size in 2026?
The Global Data Center Power Consumption Market is estimated at USD 56.85 billion in 2026, with annual electricity consumption of approximately 555 TWh. These research-derived estimates include electricity used by IT equipment, cooling systems, power distribution and other essential facility operations.
2. What is the projected Global Data Center Power Consumption Market size by 2035?
The market is projected to reach USD 165.60 billion by 2035, growing at a CAGR of 12.61% from 2026 to 2035. Global data center electricity consumption is forecast to reach approximately 1,446 TWh, driven by expanding AI infrastructure, hyperscale facilities and cloud computing workloads.
3. Which region dominates the Global Data Center Power Consumption Market?
North America holds the largest modelled share of global data center electricity consumption in 2026, supported by extensive hyperscale infrastructure, cloud service providers and AI computing investments. The United States remains the primary contributor, with estimated electricity consumption of 244 TWh in 2026.
4. What are the major factors driving data center electricity consumption growth?
The major growth drivers include increasing AI and machine learning workloads, deployment of high-density GPU servers, hyperscale data center expansion, enterprise digital transformation and growing cloud computing requirements. Advanced cooling systems and supporting power infrastructure also contribute to facility electricity demand.
5. What are the major challenges affecting the Global Data Center Power Consumption Market?
The market faces challenges from grid congestion, electricity price volatility, insufficient dependable power capacity, lengthy grid connection procedures and environmental regulations. Water availability, cooling requirements and community opposition can further influence data center locations, operational expenditure and commissioning schedules.