
Asia Pacific Positive Material Identification Market Size – Industry Structure Evaluation, Demand Drivers Analysis, Country-wise Growth Analysis and Identification, Competitive Positioning Review & Market Size Forecast to 2027
Overview
Asia Pacific Positive Material Identification Market is expected to reach US$ 24.54 Bn by 2026, at a CAGR of 3.65% during the forecast period.
Thanks to developing economies in Asia-Pacific are expected to witness rapid growth during 2019-2027. Growing awareness about innovative quality control techniques, economic growth, and increasing interest of foreign investors are factors driving the positive material identification market in the Asia Pacific.
To know about the Research Methodology :- Request Free Sample Report
Economies such as Japan, China, and India are poised to be highly promising markets for X-ray fluorescence spectrometers in upcoming years. By technique, X-Ray Fluorescence (XRF) accounted for the largest market share in 2019, with a market value of US$ XX Mn; the regional market is expected to register a CAGR of XX % during 2019-2027. Using portable XRF analyzers, the major company offers scrap traders in India all the needed data to make fast, informed decisions about material purchases along with the input and speed required to sort large quantities of materials, and henceforth utilize sales opportunities efficiently. XRF analyzers are extensively used and mainly referred to as a rapid characterization tool in various analytical labs across the forensics, metallurgy, polymers, environmental analysis, archaeology, electronics, and mining applications, among others.
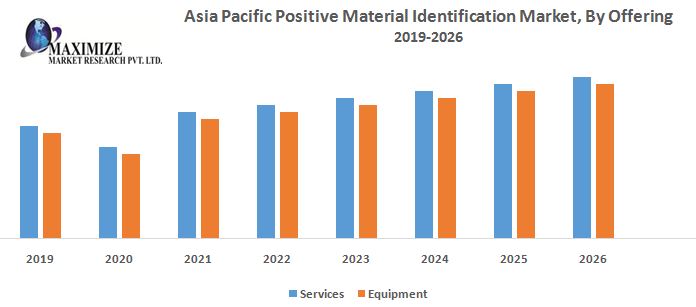
In APAC, equipment segment was valued US$ XX Mn in 2019 and is expected to reach US$ XX Mn by 2027 at a CAGR of XX % over the forecast period. Thanks to the growing implementation of this equipment for the improvement of processes in many Asian industries. However, the services segment is expected to grow at the largest CAGR of XX % during the forecast period owing to the increasing concentration of the third-party service providers in the PMI market.
Based on the industry the market is segmented into aerospace &defence, oil & gas, metals & heavy machinery, infrastructure, automotive, scrap recycling, chemicals power generation pharmaceutical. In APAC, the oil & gas industry segment is projected to reach US$ XX Mn by 2027. China is the world's most populated country i.e. nearly XX billion people in 2019 with a fast-growing economy that has led it to be the largest energy consumer and producer in the world. Rapidly growing energy demand has made China influential in world oil & gas markets. In the China industry segment, the oil & gas industry accounted for US$ XX Mn in 2019 and is expected to grow at a CAGR of XX % over the forecast period 2019-2027, to account for US$ XX Mn. in 2027.
In APAC, the automotive industry is expected to grow at the largest CAGR of 8.22% during the forecast period. Globally, the Indian automobile industry became the fourth largest in the globe in 2017 and was the seventh-largest manufacturer of commercial vehicles in 2018. India is renowned as a worldwide hub for economical and scalable automobile engineering. India’s automotive sector provides significant cost benefits and has an edge over other economies in terms of necessary manufacturing infrastructure and low labor costs.
Overall, APAC will continue to dominate the positive material identification market, because of the spread of the prominent players in this region. Companies are involved in adopting sustainable strategies to gain competitive edges such as new product launch, product up-gradation and collaborative agreements. Bruker is a major company in APAC. Bruker S1 TITAN handheld XRF analyser is among the lightest (1.50 kg, with battery) portable tube-based XRF analyser on the market nowadays. The innovative S1 TITAN contains features like an integrated touch-screen color display and a 50-kV X-ray tube.
Key players of the Asia Pacific Positive Material Identification market include:
• TSI Incorporated
• TUV SUD
• Bruker
• SGS
• Hitachi
• Acuren
• Global Sources
• Applus+
• LMATS
• Inspectahire
• Thermo Fisher
• Olympus
• Ametek
• Shimadzu
Key Target Audience:
• PMI testing equipment rental providers
• Raw material and component providers
• Original equipment manufacturers (OEMs)
• End-users/enterprise-users
• Research institutes and organizations
• Government bodies, venture capitalists, and private equity firms
• Market research and consulting firms
• Enterprise data center professionals
The scope of the Asia Pacific Positive Material Identification Market: Inquire before buying
The research report segments Asia Pacific Positive Material Identification market based on technique, offering, form factor, industry, and geography.
Asia Pacific Positive Material Identification Market, By Offering:
• Services
• Equipment
Asia Pacific Positive Material Identification Market, By Technique:
• Optical Emission Spectrometry (OES)
• X-Ray Fluorescence (XRF)
Asia Pacific Positive Material Identification Market, By Form Factor:
• Benchtop Analyzers
• Portable Analyzers
Asia Pacific Positive Material Identification Market, By Industry:
• Aerospace & Defense
• Oil & Gas
• Metals & Heavy Machinery
• Infrastructure
• Automotive
• Scrap Recycling
• Chemicals
• Power Generation
• Pharmaceutical
Asia Pacific Positive Material Identification Market, By Geography:
• Asia Pacific
o China
o Japan
o India
o South Korea
o Australia
o Others
Geographic Analysis
• Breakdown of China Positive Material Identification market
• Breakdown of Japan Positive Material Identification market
• Breakdown of India Positive Material Identification market
• Breakdown of South Korea Positive Material Identification market
• Breakdown of Australia Positive Material Identification market
• Breakdown of Others Positive Material Identification market
Available Customizations
Maximize Market Research offers customizations of reports according to the specific requirement of our clients