1. Vegetable Carbon Market Introduction
1.1. Study Assumption and Market Definition
1.2. Scope of the Study
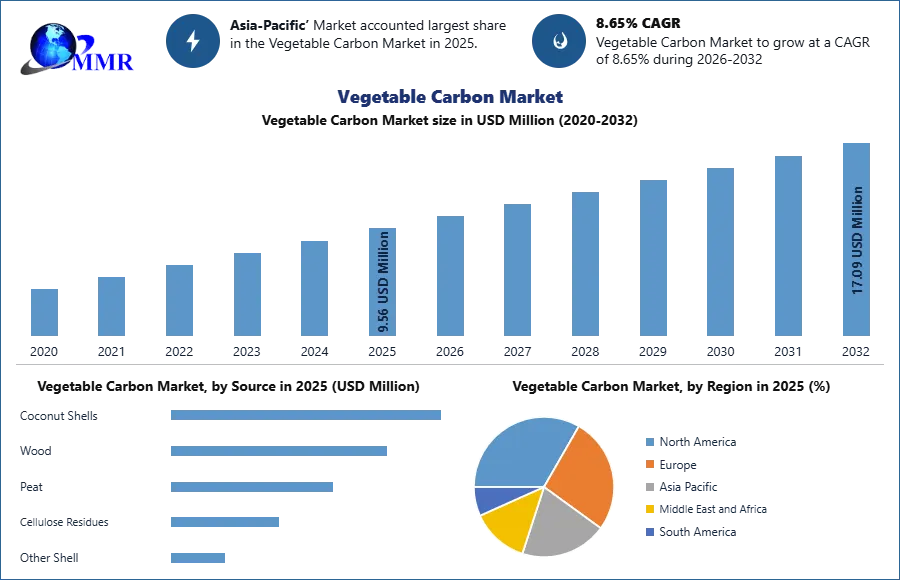
1.3. Executive Summary
2. Global Vegetable Carbon Market: Competitive Landscape
2.1. MMR Competition Matrix
2.2. Competitive Landscape
2.3. Key Players Benchmarking
2.3.1. Company Name
2.3.2. Business Segment
2.3.3. End-user Segment
2.3.4. Revenue (2025)
2.3.5. Company Locations
2.4. Leading Vegetable Carbon Market Companies, by market capitalization
2.5. Market Structure
2.5.1. Market Leaders
2.5.2. Market Followers
2.5.3. Emerging Players
2.6. Mergers and Acquisitions Details
3. Vegetable Carbon Market: Dynamics
3.1. Vegetable Carbon Market Trends by Region
3.1.1. North America Vegetable Carbon Market Trends
3.1.2. Europe Vegetable Carbon Market Trends
3.1.3. Asia Pacific Vegetable Carbon Market Trends
3.1.4. Middle East and Africa Vegetable Carbon Market Trends
3.1.5. South America Vegetable Carbon Market Trends
3.2. Vegetable Carbon Market Dynamics by Region
3.2.1. North America
3.2.1.1. North America Vegetable Carbon Market Drivers
3.2.1.2. North America Vegetable Carbon Market Restraints
3.2.1.3. North America Vegetable Carbon Market Opportunities
3.2.1.4. North America Vegetable Carbon Market Challenges
3.2.2. Europe
3.2.2.1. Europe Vegetable Carbon Market Drivers
3.2.2.2. Europe Vegetable Carbon Market Restraints
3.2.2.3. Europe Vegetable Carbon Market Opportunities
3.2.2.4. Europe Vegetable Carbon Market Challenges
3.2.3. Asia Pacific
3.2.3.1. Asia Pacific Vegetable Carbon Market Drivers
3.2.3.2. Asia Pacific Vegetable Carbon Market Restraints
3.2.3.3. Asia Pacific Vegetable Carbon Market Opportunities
3.2.3.4. Asia Pacific Vegetable Carbon Market Challenges
3.2.4. Middle East and Africa
3.2.4.1. Middle East and Africa Vegetable Carbon Market Drivers
3.2.4.2. Middle East and Africa Vegetable Carbon Market Restraints
3.2.4.3. Middle East and Africa Vegetable Carbon Market Opportunities
3.2.4.4. Middle East and Africa Vegetable Carbon Market Challenges
3.2.5. South America
3.2.5.1. South America Vegetable Carbon Market Drivers
3.2.5.2. South America Vegetable Carbon Market Restraints
3.2.5.3. South America Vegetable Carbon Market Opportunities
3.2.5.4. South America Vegetable Carbon Market Challenges
3.3. PORTER's Five Forces Analysis
3.4. PESTLE Analysis
3.5. Technology Roadmap
3.6. Regulatory Landscape by Region
3.6.1. North America
3.6.2. Europe
3.6.3. Asia Pacific
3.6.4. Middle East and Africa
3.6.5. South America
3.7. Key Opinion Leader Analysis For Vegetable Carbon Industry
3.8. Analysis of Government Schemes and Initiatives For Vegetable Carbon Industry
3.9. Vegetable Carbon Market Trade Analysis
3.10. The Global Pandemic Impact on Vegetable Carbon Market
4. Vegetable Carbon Market: Global Market Size and Forecast by Segmentation (in USD Million) 2025-2032
4.1. Vegetable Carbon Market Size and Forecast, by Source (2025-2032)
4.1.1. Coconut Shells
4.1.2. Wood
4.1.3. Peat
4.1.4. Cellulose Residues
4.1.5. Other Shell
4.2. Vegetable Carbon Market Size and Forecast, by Form (2025-2032)
4.2.1. Powder (PAC / food colour grade)
4.2.2. Granular (GAC)
4.3. Vegetable Carbon Market Size and Forecast, by End User (2025-2032)
4.3.1. Food & Beverages
4.3.2. Cosmetics
4.3.3. Pharmaceuticals
4.4. Vegetable Carbon Market Size and Forecast, by Application (2025-2032)
4.4.1. Food Colour (E153 / Vegetable Black)
4.4.2. Decolorization & Purification (food/pharma processing)
4.4.3. Water Treatment / Air Purification / Industrial Adsorption
4.5. Vegetable Carbon Market Size and Forecast, by Distribution Channel (2025-2032)
4.5.1. Hypermarkets & Supermarkets
4.5.2. Food Specialty Stores
4.5.3. Pharmacy
4.5.4. Cosmetic Discounters
4.5.5. Others
4.6. Vegetable Carbon Market Size and Forecast, by Region (2025-2032)
4.6.1. North America
4.6.2. Europe
4.6.3. Asia Pacific
4.6.4. Middle East and Africa
4.6.5. South America
5. North America Vegetable Carbon Market Size and Forecast by Segmentation (in USD Million) 2025-2032
5.1. North America Vegetable Carbon Market Size and Forecast, by Source (2025-2032)
5.1.1. Coconut Shells
5.1.2. Wood
5.1.3. Peat
5.1.4. Cellulose Residues
5.1.5. Other Shell
5.2. North America Vegetable Carbon Market Size and Forecast, by Form (2025-2032)
5.2.1. Powder (PAC / food colour grade)
5.2.2. Granular (GAC)
5.3. North America Vegetable Carbon Market Size and Forecast, by End User (2025-2032)
5.3.1. Food & Beverages
5.3.2. Cosmetics
5.3.3. Pharmaceuticals
5.4. North America Vegetable Carbon Market Size and Forecast, by Application (2025-2032)
5.4.1. Food Colour (E153 / Vegetable Black)
5.4.2. Decolorization & Purification (food/pharma processing)
5.4.3. Water Treatment / Air Purification / Industrial Adsorption
5.5. North America Vegetable Carbon Market Size and Forecast, by Distribution Channel (2025-2032)
5.5.1. Hypermarkets & Supermarkets
5.5.2. Food Specialty Stores
5.5.3. Pharmacy
5.5.4. Cosmetic Discounters
5.5.5. Others
5.6. North America Vegetable Carbon Market Size and Forecast, by Country (2025-2032)
5.6.1. United States
5.6.1.1. United States Vegetable Carbon Market Size and Forecast, by Source (2025-2032)
5.6.1.1.1. Coconut Shells
5.6.1.1.2. Wood
5.6.1.1.3. Peat
5.6.1.1.4. Cellulose Residues
5.6.1.1.5. Other Shell
5.6.1.2. United States Vegetable Carbon Market Size and Forecast, by Form (2025-2032)
5.6.1.2.1. Powder (PAC / food colour grade)
5.6.1.2.2. Granular (GAC)
5.6.1.3. United States Vegetable Carbon Market Size and Forecast, by End User (2025-2032)
5.6.1.3.1. Food & Beverages
5.6.1.3.2. Cosmetics
5.6.1.3.3. Pharmaceuticals
5.6.1.4. United States Vegetable Carbon Market Size and Forecast, by Application (2025-2032)
5.6.1.4.1. Food Colour (E153 / Vegetable Black)
5.6.1.4.2. Decolorization & Purification (food/pharma processing)
5.6.1.4.3. Water Treatment / Air Purification / Industrial Adsorption
5.6.1.5. United States Vegetable Carbon Market Size and Forecast, by Distribution Channel (2025-2032)
5.6.1.5.1. Hypermarkets & Supermarkets
5.6.1.5.2. Food Specialty Stores
5.6.1.5.3. Pharmacy
5.6.1.5.4. Cosmetic Discounters
5.6.1.5.5. Others
5.6.2. Canada
5.6.2.1. Canada Vegetable Carbon Market Size and Forecast, by Source (2025-2032)
5.6.2.1.1. Coconut Shells
5.6.2.1.2. Wood
5.6.2.1.3. Peat
5.6.2.1.4. Cellulose Residues
5.6.2.1.5. Other Shell
5.6.2.2. Canada Vegetable Carbon Market Size and Forecast, by Form (2025-2032)
5.6.2.2.1. Powder (PAC / food colour grade)
5.6.2.2.2. Granular (GAC)
5.6.2.3. Canada Vegetable Carbon Market Size and Forecast, by End User (2025-2032)
5.6.2.3.1. Food & Beverages
5.6.2.3.2. Cosmetics
5.6.2.3.3. Pharmaceuticals
5.6.2.4. Canada Vegetable Carbon Market Size and Forecast, by Application (2025-2032)
5.6.2.4.1. Food Colour (E153 / Vegetable Black)
5.6.2.4.2. Decolorization & Purification (food/pharma processing)
5.6.2.4.3. Water Treatment / Air Purification / Industrial Adsorption
5.6.2.5. Canada Vegetable Carbon Market Size and Forecast, by Distribution Channel (2025-2032)
5.6.2.5.1. Hypermarkets & Supermarkets
5.6.2.5.2. Food Specialty Stores
5.6.2.5.3. Pharmacy
5.6.2.5.4. Cosmetic Discounters
5.6.2.5.5. Others
5.6.3. Mexico
5.6.3.1. Mexico Vegetable Carbon Market Size and Forecast, by Source (2025-2032)
5.6.3.1.1. Coconut Shells
5.6.3.1.2. Wood
5.6.3.1.3. Peat
5.6.3.1.4. Cellulose Residues
5.6.3.1.5. Other Shell
5.6.3.2. Mexico Vegetable Carbon Market Size and Forecast, by Form (2025-2032)
5.6.3.2.1. Powder (PAC / food colour grade)
5.6.3.2.2. Granular (GAC)
5.6.3.3. Mexico Vegetable Carbon Market Size and Forecast, by End User (2025-2032)
5.6.3.3.1. Food & Beverages
5.6.3.3.2. Cosmetics
5.6.3.3.3. Pharmaceuticals
5.6.3.4. Mexico Vegetable Carbon Market Size and Forecast, by Application (2025-2032)
5.6.3.4.1. Food Colour (E153 / Vegetable Black)
5.6.3.4.2. Decolorization & Purification (food/pharma processing)
5.6.3.4.3. Water Treatment / Air Purification / Industrial Adsorption
5.6.3.5. Mexico Vegetable Carbon Market Size and Forecast, by Distribution Channel (2025-2032)
5.6.3.5.1. Hypermarkets & Supermarkets
5.6.3.5.2. Food Specialty Stores
5.6.3.5.3. Pharmacy
5.6.3.5.4. Cosmetic Discounters
5.6.3.5.5. Others
6. Europe Vegetable Carbon Market Size and Forecast by Segmentation (in USD Million) 2025-2032
6.1. Europe Vegetable Carbon Market Size and Forecast, by Source (2025-2032)
6.2. Europe Vegetable Carbon Market Size and Forecast, by Form (2025-2032)
6.3. Europe Vegetable Carbon Market Size and Forecast, by End User (2025-2032)
6.4. Europe Vegetable Carbon Market Size and Forecast, by Application (2025-2032)
6.5. Europe Vegetable Carbon Market Size and Forecast, by Distribution Channel (2025-2032)
6.6. Europe Vegetable Carbon Market Size and Forecast, by Country (2025-2032)
6.6.1. United Kingdom
6.6.1.1. United Kingdom Vegetable Carbon Market Size and Forecast, by Source (2025-2032)
6.6.1.2. United Kingdom Vegetable Carbon Market Size and Forecast, by Form (2025-2032)
6.6.1.3. United Kingdom Vegetable Carbon Market Size and Forecast, by End User (2025-2032)
6.6.1.4. United Kingdom Vegetable Carbon Market Size and Forecast, by Application (2025-2032)
6.6.1.5. United Kingdom Vegetable Carbon Market Size and Forecast, by Distribution Channel (2025-2032)
6.6.2. France
6.6.2.1. France Vegetable Carbon Market Size and Forecast, by Source (2025-2032)
6.6.2.2. France Vegetable Carbon Market Size and Forecast, by Form (2025-2032)
6.6.2.3. France Vegetable Carbon Market Size and Forecast, by End User (2025-2032)
6.6.2.4. France Vegetable Carbon Market Size and Forecast, by Application (2025-2032)
6.6.2.5. France Vegetable Carbon Market Size and Forecast, by Distribution Channel (2025-2032)
6.6.3. Germany
6.6.3.1. Germany Vegetable Carbon Market Size and Forecast, by Source (2025-2032)
6.6.3.2. Germany Vegetable Carbon Market Size and Forecast, by Form (2025-2032)
6.6.3.3. Germany Vegetable Carbon Market Size and Forecast, by End User (2025-2032)
6.6.3.4. Germany Vegetable Carbon Market Size and Forecast, by Application (2025-2032)
6.6.3.5. Germany Vegetable Carbon Market Size and Forecast, by Distribution Channel (2025-2032)
6.6.4. Italy
6.6.4.1. Italy Vegetable Carbon Market Size and Forecast, by Source (2025-2032)
6.6.4.2. Italy Vegetable Carbon Market Size and Forecast, by Form (2025-2032)
6.6.4.3. Italy Vegetable Carbon Market Size and Forecast, by End User (2025-2032)
6.6.4.4. Italy Vegetable Carbon Market Size and Forecast, by Application (2025-2032)
6.6.4.5. Italy Vegetable Carbon Market Size and Forecast, by Distribution Channel (2025-2032)
6.6.5. Spain
6.6.5.1. Spain Vegetable Carbon Market Size and Forecast, by Source (2025-2032)
6.6.5.2. Spain Vegetable Carbon Market Size and Forecast, by Form (2025-2032)
6.6.5.3. Spain Vegetable Carbon Market Size and Forecast, by End User (2025-2032)
6.6.5.4. Spain Vegetable Carbon Market Size and Forecast, by Application (2025-2032)
6.6.5.5. Spain Vegetable Carbon Market Size and Forecast, by Distribution Channel (2025-2032)
6.6.6. Sweden
6.6.6.1. Sweden Vegetable Carbon Market Size and Forecast, by Source (2025-2032)
6.6.6.2. Sweden Vegetable Carbon Market Size and Forecast, by Form (2025-2032)
6.6.6.3. Sweden Vegetable Carbon Market Size and Forecast, by End User (2025-2032)
6.6.6.4. Sweden Vegetable Carbon Market Size and Forecast, by Application (2025-2032)
6.6.6.5. Sweden Vegetable Carbon Market Size and Forecast, by Distribution Channel (2025-2032)
6.6.7. Austria
6.6.7.1. Austria Vegetable Carbon Market Size and Forecast, by Source (2025-2032)
6.6.7.2. Austria Vegetable Carbon Market Size and Forecast, by Form (2025-2032)
6.6.7.3. Austria Vegetable Carbon Market Size and Forecast, by End User (2025-2032)
6.6.7.4. Austria Vegetable Carbon Market Size and Forecast, by Application (2025-2032)
6.6.7.5. Austria Vegetable Carbon Market Size and Forecast, by Distribution Channel (2025-2032)
6.6.8. Rest of Europe
6.6.8.1. Rest of Europe Vegetable Carbon Market Size and Forecast, by Source (2025-2032)
6.6.8.2. Rest of Europe Vegetable Carbon Market Size and Forecast, by Form (2025-2032)
6.6.8.3. Rest of Europe Vegetable Carbon Market Size and Forecast, by End User (2025-2032)
6.6.8.4. Rest of Europe Vegetable Carbon Market Size and Forecast, by Application (2025-2032)
6.6.8.5. Rest of Europe Vegetable Carbon Market Size and Forecast, by Distribution Channel (2025-2032)
7. Asia Pacific Vegetable Carbon Market Size and Forecast by Segmentation (in USD Million) 2025-2032
7.1. Asia Pacific Vegetable Carbon Market Size and Forecast, by Source (2025-2032)
7.2. Asia Pacific Vegetable Carbon Market Size and Forecast, by Form (2025-2032)
7.3. Asia Pacific Vegetable Carbon Market Size and Forecast, by End User (2025-2032)
7.4. Asia Pacific Vegetable Carbon Market Size and Forecast, by Application (2025-2032)
7.5. Asia Pacific Vegetable Carbon Market Size and Forecast, by Distribution Channel (2025-2032)
7.6. Asia Pacific Vegetable Carbon Market Size and Forecast, by Country (2025-2032)
7.6.1. China
7.6.1.1. China Vegetable Carbon Market Size and Forecast, by Source (2025-2032)
7.6.1.2. China Vegetable Carbon Market Size and Forecast, by Form (2025-2032)
7.6.1.3. China Vegetable Carbon Market Size and Forecast, by End User (2025-2032)
7.6.1.4. China Vegetable Carbon Market Size and Forecast, by Application (2025-2032)
7.6.1.5. China Vegetable Carbon Market Size and Forecast, by Distribution Channel (2025-2032)
7.6.2. S Korea
7.6.2.1. S Korea Vegetable Carbon Market Size and Forecast, by Source (2025-2032)
7.6.2.2. S Korea Vegetable Carbon Market Size and Forecast, by Form (2025-2032)
7.6.2.3. S Korea Vegetable Carbon Market Size and Forecast, by End User (2025-2032)
7.6.2.4. S Korea Vegetable Carbon Market Size and Forecast, by Application (2025-2032)
7.6.2.5. S Korea Vegetable Carbon Market Size and Forecast, by Distribution Channel (2025-2032)
7.6.3. Japan
7.6.3.1. Japan Vegetable Carbon Market Size and Forecast, by Source (2025-2032)
7.6.3.2. Japan Vegetable Carbon Market Size and Forecast, by Form (2025-2032)
7.6.3.3. Japan Vegetable Carbon Market Size and Forecast, by End User (2025-2032)
7.6.3.4. Japan Vegetable Carbon Market Size and Forecast, by Application (2025-2032)
7.6.3.5. Japan Vegetable Carbon Market Size and Forecast, by Distribution Channel (2025-2032)
7.6.4. India
7.6.4.1. India Vegetable Carbon Market Size and Forecast, by Source (2025-2032)
7.6.4.2. India Vegetable Carbon Market Size and Forecast, by Form (2025-2032)
7.6.4.3. India Vegetable Carbon Market Size and Forecast, by End User (2025-2032)
7.6.4.4. India Vegetable Carbon Market Size and Forecast, by Application (2025-2032)
7.6.4.5. India Vegetable Carbon Market Size and Forecast, by Distribution Channel (2025-2032)
7.6.5. Australia
7.6.5.1. Australia Vegetable Carbon Market Size and Forecast, by Source (2025-2032)
7.6.5.2. Australia Vegetable Carbon Market Size and Forecast, by Form (2025-2032)
7.6.5.3. Australia Vegetable Carbon Market Size and Forecast, by End User (2025-2032)
7.6.5.4. Australia Vegetable Carbon Market Size and Forecast, by Application (2025-2032)
7.6.5.5. Australia Vegetable Carbon Market Size and Forecast, by Distribution Channel (2025-2032)
7.6.6. Indonesia
7.6.6.1. Indonesia Vegetable Carbon Market Size and Forecast, by Source (2025-2032)
7.6.6.2. Indonesia Vegetable Carbon Market Size and Forecast, by Form (2025-2032)
7.6.6.3. Indonesia Vegetable Carbon Market Size and Forecast, by End User (2025-2032)
7.6.6.4. Indonesia Vegetable Carbon Market Size and Forecast, by Application (2025-2032)
7.6.6.5. Indonesia Vegetable Carbon Market Size and Forecast, by Distribution Channel (2025-2032)
7.6.7. Malaysia
7.6.7.1. Malaysia Vegetable Carbon Market Size and Forecast, by Source (2025-2032)
7.6.7.2. Malaysia Vegetable Carbon Market Size and Forecast, by Form (2025-2032)
7.6.7.3. Malaysia Vegetable Carbon Market Size and Forecast, by End User (2025-2032)
7.6.7.4. Malaysia Vegetable Carbon Market Size and Forecast, by Application (2025-2032)
7.6.7.5. Malaysia Vegetable Carbon Market Size and Forecast, by Distribution Channel (2025-2032)
7.6.8. Vietnam
7.6.8.1. Vietnam Vegetable Carbon Market Size and Forecast, by Source (2025-2032)
7.6.8.2. Vietnam Vegetable Carbon Market Size and Forecast, by Form (2025-2032)
7.6.8.3. Vietnam Vegetable Carbon Market Size and Forecast, by End User (2025-2032)
7.6.8.4. Vietnam Vegetable Carbon Market Size and Forecast, by Application (2025-2032)
7.6.8.5. Vietnam Vegetable Carbon Market Size and Forecast, by Distribution Channel (2025-2032)
7.6.9. Taiwan
7.6.9.1. Taiwan Vegetable Carbon Market Size and Forecast, by Source (2025-2032)
7.6.9.2. Taiwan Vegetable Carbon Market Size and Forecast, by Form (2025-2032)
7.6.9.3. Taiwan Vegetable Carbon Market Size and Forecast, by End User (2025-2032)
7.6.9.4. Taiwan Vegetable Carbon Market Size and Forecast, by Application (2025-2032)
7.6.9.5. Taiwan Vegetable Carbon Market Size and Forecast, by Distribution Channel (2025-2032)
7.6.10. Rest of Asia Pacific
7.6.10.1. Rest of Asia Pacific Vegetable Carbon Market Size and Forecast, by Source (2025-2032)
7.6.10.2. Rest of Asia Pacific Vegetable Carbon Market Size and Forecast, by Form (2025-2032)
7.6.10.3. Rest of Asia Pacific Vegetable Carbon Market Size and Forecast, by End User (2025-2032)
7.6.10.4. Rest of Asia Pacific Vegetable Carbon Market Size and Forecast, by Application (2025-2032)
7.6.10.5. Rest of Asia Pacific Vegetable Carbon Market Size and Forecast, by Distribution Channel (2025-2032)
8. Middle East and Africa Vegetable Carbon Market Size and Forecast by Segmentation (in USD Million) 2025-2032
8.1. Middle East and Africa Vegetable Carbon Market Size and Forecast, by Source (2025-2032)
8.2. Middle East and Africa Vegetable Carbon Market Size and Forecast, by Form (2025-2032)
8.3. Middle East and Africa Vegetable Carbon Market Size and Forecast, by End User (2025-2032)
8.4. Middle East and Africa Vegetable Carbon Market Size and Forecast, by Application (2025-2032)
8.5. Middle East and Africa Vegetable Carbon Market Size and Forecast, by Distribution Channel (2025-2032)
8.6. Middle East and Africa Vegetable Carbon Market Size and Forecast, by Country (2025-2032)
8.6.1. South Africa
8.6.1.1. South Africa Vegetable Carbon Market Size and Forecast, by Source (2025-2032)
8.6.1.2. South Africa Vegetable Carbon Market Size and Forecast, by Form (2025-2032)
8.6.1.3. South Africa Vegetable Carbon Market Size and Forecast, by End User (2025-2032)
8.6.1.4. South Africa Vegetable Carbon Market Size and Forecast, by Application (2025-2032)
8.6.1.5. South Africa Vegetable Carbon Market Size and Forecast, by Distribution Channel (2025-2032)
8.6.2. GCC
8.6.2.1. GCC Vegetable Carbon Market Size and Forecast, by Source (2025-2032)
8.6.2.2. GCC Vegetable Carbon Market Size and Forecast, by Form (2025-2032)
8.6.2.3. GCC Vegetable Carbon Market Size and Forecast, by End User (2025-2032)
8.6.2.4. GCC Vegetable Carbon Market Size and Forecast, by Application (2025-2032)
8.6.2.5. GCC Vegetable Carbon Market Size and Forecast, by Distribution Channel (2025-2032)
8.6.3. Nigeria
8.6.3.1. Nigeria Vegetable Carbon Market Size and Forecast, by Source (2025-2032)
8.6.3.2. Nigeria Vegetable Carbon Market Size and Forecast, by Form (2025-2032)
8.6.3.3. Nigeria Vegetable Carbon Market Size and Forecast, by End User (2025-2032)
8.6.3.4. Nigeria Vegetable Carbon Market Size and Forecast, by Application (2025-2032)
8.6.3.5. Nigeria Vegetable Carbon Market Size and Forecast, by Distribution Channel (2025-2032)
8.6.4. Rest of ME&A
8.6.4.1. Rest of ME&A Vegetable Carbon Market Size and Forecast, by Source (2025-2032)
8.6.4.2. Rest of ME&A Vegetable Carbon Market Size and Forecast, by Form (2025-2032)
8.6.4.3. Rest of ME&A Vegetable Carbon Market Size and Forecast, by End User (2025-2032)
8.6.4.4. Rest of ME&A Vegetable Carbon Market Size and Forecast, by Application (2025-2032)
8.6.4.5. Rest of ME&A Vegetable Carbon Market Size and Forecast, by Distribution Channel (2025-2032)
9. South America Vegetable Carbon Market Size and Forecast by Segmentation (in USD Million) 2025-2032
9.1. South America Vegetable Carbon Market Size and Forecast, by Source (2025-2032)
9.2. South America Vegetable Carbon Market Size and Forecast, by Form (2025-2032)
9.3. South America Vegetable Carbon Market Size and Forecast, by End User (2025-2032)
9.4. South America Vegetable Carbon Market Size and Forecast, by Application (2025-2032)
9.5. South America Vegetable Carbon Market Size and Forecast, by Distribution Channel (2025-2032)
9.6. South America Vegetable Carbon Market Size and Forecast, by Country (2025-2032)
9.6.1. Brazil
9.6.1.1. Brazil Vegetable Carbon Market Size and Forecast, by Source (2025-2032)
9.6.1.2. Brazil Vegetable Carbon Market Size and Forecast, by Form (2025-2032)
9.6.1.3. Brazil Vegetable Carbon Market Size and Forecast, by End User (2025-2032)
9.6.1.4. Brazil Vegetable Carbon Market Size and Forecast, by Application (2025-2032)
9.6.1.5. Brazil Vegetable Carbon Market Size and Forecast, by Distribution Channel (2025-2032)
9.6.2. Argentina
9.6.2.1. Argentina Vegetable Carbon Market Size and Forecast, by Source (2025-2032)
9.6.2.2. Argentina Vegetable Carbon Market Size and Forecast, by Form (2025-2032)
9.6.2.3. Argentina Vegetable Carbon Market Size and Forecast, by End User (2025-2032)
9.6.2.4. Argentina Vegetable Carbon Market Size and Forecast, by Application (2025-2032)
9.6.2.5. Argentina Vegetable Carbon Market Size and Forecast, by Distribution Channel (2025-2032)
9.6.3. Rest Of South America
9.6.3.1. Rest Of South America Vegetable Carbon Market Size and Forecast, by Source (2025-2032)
9.6.3.2. Rest Of South America Vegetable Carbon Market Size and Forecast, by Form (2025-2032)
9.6.3.3. Rest Of South America Vegetable Carbon Market Size and Forecast, by End User (2025-2032)
9.6.3.4. Rest Of South America Vegetable Carbon Market Size and Forecast, by Application (2025-2032)
9.6.3.5. Rest Of South America Vegetable Carbon Market Size and Forecast, by Distribution Channel (2025-2032)
10. Company Profile: Key Players
10.1. Jacobi Carbons Group
10.1.1. Company Overview
10.1.2. Business Portfolio
10.1.3. Financial Overview
10.1.4. SWOT Analysis
10.1.5. Strategic Analysis
10.1.6. Scale of Operation (small, medium, and large)
10.1.7. Details on Partnership
10.1.8. Regulatory Accreditations and Certifications Received by Them
10.1.9. Awards Received by the Firm
10.1.10. Recent Developments
10.2. Haycarb PLC
10.3. Kuraray Co.Ltd. (Calgon Carbon Corporation)
10.4. Cenapro Chemical Corporation
10.5. Philippine-Japan Active Carbon Corporation
10.6. Donau Carbon GmbH
10.7. CarboTech AC GmbH
10.8. Silcarbon Aktivkohle GmbH
10.9. Carbon Activated Corporation
10.10. Boyce Carbon
10.11. Active Char Products Pvt. Ltd.
10.12. Kalpaka Chemicals Pvt. Ltd.
10.13. Eurocarb Products Ltd.
10.14. Zhulin Activated Carbon Group
10.15. Hainan Xingguang Activated Carbon Co.
10.16. MICBAC India Pvt. Ltd.
10.17. Cabot Corporation
10.18. Aqualine International
10.19. Camfil Group
10.20. Ecologix Environmental Systems
11. Key Findings
12. Industry Recommendations
13. Vegetable Carbon Market: Research Methodologyc