Pla Cup Market Global Industry Analysis, Trends, and Forecast (2025-2032)

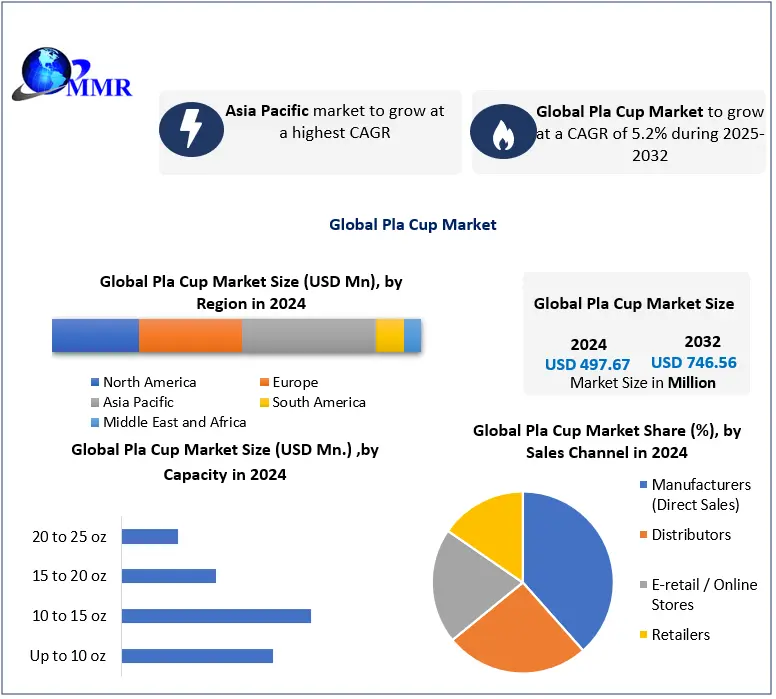
Global Pla Cup Market size was valued at USD 497.67 Mn in 2024, and the total Pla Cup Market revenue is expected to grow at a CAGR of 5.2% from 2025 to 2032, reaching nearly USD 746.56 Mn.

PLA Cup Market Overview:

PLA cups are unusual biodegradable cups made from polylactic acid, a biopolymer (PLA). PLA is a bio-based plastic manufactured from starchy plants such as corn. PLA cups are simple to make and are a great alternative to traditional plastic cups because of their high recyclability and environmental friendliness. Pla Cup Market 2025-2032To know about the Research Methodology :- Request Free Sample Report The global proliferation of COVID-19 has had a negative impact on biodegradable cup sales. The foodservice industry's demand for biodegradable cups has decreased as a result of government-imposed food supply-chain delays and travel restrictions. The closure of cafeterias, quick service restaurants, and motels during the pandemic had a significant impact on sales of biodegradable cups. However, during the COVID-19, the growth of takeaways and online food delivery services resulted in movement restrictions, necessitating the use of biodegradable cups. As the biodegradable cup market begins to rebound post-COVID, the market is expected to gain traction in the next years.

PLA Cup Market Dynamics:

Some of the primary reasons predicted to boost growth in the global PLA cup market during the forecast period include rapid expansion of end-use verticals such as restaurants, hotels, and cafés, increased government attempts to limit the use of plastic products, and various benefits of PLA cups. Because of their biodegradability and recyclability, PLA cups have emerged as a viable alternative to plastic cups such as PP and PET. These cups are simple to recycle and thus contribute to the reduction of plastic pollution. End consumers are exhibiting a strong preference for PLA cups over other options in order to meet rising customer demand for environmentally friendly products as well as tight government laws. PLA cups can endure a wide range of temperatures, making them suitable for serving both cold and hot food and beverage items. During the projected period, the growing number of food service outlets and increased consumer spending on alcoholic and fruit beverages are expected to provide profitable growth possibilities for PLA cup producers. Similarly, several governments attempt to limit plastic pollution and encourage the adoption of biodegradable products would aid market expansion in the future years. PLA cup manufacturers employ a variety of advertising strategies to inform consumers about the advantages of using PLA cups. To achieve a competitive advantage in the market, they are introducing printable items and establishing new recycling operations. There's no denying that environmentally friendly items like PLA cups are slowly but steadily gaining over end-use sectors. Various factors, on the other hand, are projected to slow market expansion throughout the projection period. The cheap availability of alternative products and the low penetration of PLA cups in low-income areas are two of these factors. Similarly, PLA cups' high production costs compared to alternatives like PP cups are constraining market growth.

PLA Cup Market Segment Analysis:

Based on Application, The PLA Cup Market is segmented into Restaurants, Bars, Cafes and Others. Restaurant segment is dominating in the market with the largest market share. The application options remained limited until PLA could successfully resist use temperatures ranging from 80°C to 120°C. Purac, a Dutch lactide maker with 80 years of lactic acid production history, has created a heat-resistant PLA technology that might open up a huge market as a biobased alternative to polystyrene (PS) and polypropylene (PP). So, PLA Cups can be used with drinks having high temperatures such as hot coffees. So, they are becoming more common in the Cafes as they serve a variety or hot and cold drinks. Hence, Café segmented is expected to grow at a higher CAGR during the forecast period. The most critical point to emphasize right now is that PLA is easily recyclable. When the material is widely used, the waste stream that results will entice recycling companies to use this precious material as building blocks for new applications. Based on End Use, Global Pla Cup Market is segmented into Insider Threat Detection, Fraud Detection, Continuous Authentication, User & Entity Monitoring, Threat Hunting, Others. Insider Threat Detection segment dominates the Global Pla Cup Market in 2024 and is expected to hold the largest market share over the forecast period. Dominance due to the increasing frequency of internal data breaches and security incidents. Organizations across sectors such as finance, healthcare, and government face growing risks from employees or contractors misusing access privileges. UEBA solutions help detect anomalous behavior, unauthorized access, and potential sabotage in real time, making them critical for data protection and compliance. With stricter cybersecurity regulations and zero-trust frameworks being adopted globally, companies prioritize insider threat detection to safeguard sensitive assets, ensuring it leads all other UEBA applications.

PLA Cup Market Regional Insights:

Asia Pacific PLA cup market is expected to grow at a considerably higher CAGR between 2024 and 2030 owing to a rapid expansion in the number of food service outlets and increased government support for encouraging the usage of eco-friendly products. Growing consumer knowledge of the benefits of PLA cups, expanding government support, simple availability of PLA cups at reduced prices, and rapid expansion of end-use industries are all expected to drive up demand for PLA cups in fast-growing countries like India and China. Similarly, factors such as population growth and lifestyle changes. During the projected period, rising disposable income and expanding acceptance of PLA cups at weddings and events are expected to drive market growth. Due to the quick expansion of end use verticals, increased consumer spending, rising preference towards eco-friendly products, and strong presence of leading market players, North America is likely to give tremendous potential prospects for PLA cup manufacturers throughout the forecast period. Because of its biodegradable nature, most end users in industrialized countries such as the United States are switching to PLA cups. These PLA cups are used to serve a range of beverages. During the projection period, rising consumer spending on alcoholic and fruit beverages is likely to enhance PLA cup sales across North America. Similarly, strict limitations on plastic usage to safeguard the environment from pollution, combined with a high quality of living, will generate growth opportunities in the North American PLA cup market in the next years. The objective of the report is to present a comprehensive analysis of the PLA Cup market to the stakeholders in the industry. The past and current status of the industry with the forecasted market size and trends are presented in the report with the analysis of complicated data in simple language. The report covers all the aspects of the industry with a dedicated study of key players that include market leaders, followers, and new entrants. PORTER, PESTEL analysis with the potential impact of micro-economic factors of the market have been presented in the report. External as well as internal factors that are supposed to affect the business positively or negatively have been analyzed, which will give a clear futuristic perspective of the industry to the decision-makers. The report also helps in understanding the PLA Cup market dynamics, structure by analyzing the market segments and project the PLA Cup market size. Clear representation of competitive analysis of key players by product, price, financial position, product portfolio, growth strategies, and regional presence in the PLA Cup market make the report investor’s guide.

PLA Cup Market Scope: Inquiry Before Buying

Global PLA Cup Market
Report Coverage Details
Base Year: 2024 Forecast Period: 2025-2032
Historical Data: 2019 to 2024 Market Size in 2024: USD 497.67 Mn.
Forecast Period 2025 to 2032 CAGR: 5.2% Market Size in 2032: USD 746.56 Mn.
Segments Covered: by Capacity Up to 10 oz 10 to 15 oz 15 to 20 oz 20 to 25 oz
by Sales Channel Manufacturers (Direct Sales) Distributors E retail / Online Stores Retailers
by Application Restaurants Cafes Bars & Lounges Hotels & Motels Catering Services Others
by End-User Insider Threat Detection Fraud Detection Continuous Authentication User & Entity Monitoring Threat Hunting Others

PLA Cup Market, by Region

North America (United States, Canada and Mexico) Europe (UK, France, Germany, Italy, Spain, Sweden, Austria and Rest of Europe) Asia Pacific (China, South Korea, Japan, India, Australia, Indonesia, Malaysia, Vietnam, Taiwan, Bangladesh, Pakistan and Rest of APAC) Middle East and Africa (South Africa, GCC, Egypt, Nigeria and Rest of ME&A) South America (Brazil, Argentina Rest of South America

PLA Cup Market, Key Players

1. Biopac Ltd (U.K.) 2. Celebration Paper & Plastics Ltd. (U.K.) 3. Avani Eco Hub (Indonesia) 4. Eco-Products, Inc. (U.S.) 5. Betterearth Llc (U.S.) 6. Green Paper Products (U.S.) 7. Genpak, LLC (U.S.) 8. Dart Container Corporation (U.S.) 9. Pactiv LLC (U.S.) 10. Lollicup USA Inc. (U.S.) 11. Eco-Products, Inc. (U.S.) 12. Go-Pak UK LTD (U.K.)

Frequently Asked Questions:

1. What is the forecast period considered for the PLA Cup market report? Ans. The forecast period for the PLA Cup market is 2025-2032. 2. What segments are covered in the PLA Cup Market Report? Ans. PLA Cup Market is segmented by Capacity, Sales Channel, Application and End User. 3. What is the compound annual growth rate (CAGR) of the PLA Cup market for the forecast period? Ans. 5.2% is the compound annual growth rate (CAGR) of the PLA Cup market for the forecast period 4. Which is the dominating segment by application in the PLA Cup market? Ans. Restaurants segment. 5. Who are the major players in PLA Cup market? Ans. Biopac Ltd (U.K.), Celebration Paper & Plastics Ltd. (U.K.), Avani Eco Hub (Indonesia), Eco-Products, Inc. (U.S.), Betterearth Llc (U.S.), Green Paper Products (U.S.), Genpak, LLC (U.S.), Dart Container Corporation (U.S.), Pactiv LLC (U.S.).
1. PLA Cup Market Introduction 1.1. Study Assumption and Market Definition 1.2. Scope of the Study 1.3. Executive Summary 2. Global PLA Cup Market: Competitive Landscape 2.1. MMR Competition Matrix 2.2. Competitive Landscape 2.3. Key Players Benchmarking 2.3.1. Company Name 2.3.2. Business Segment 2.3.3. End-user Segment 2.3.4. Revenue (2024) 2.3.5. Company Locations 2.4. Leading PLA Cup Market Companies, by market capitalization 2.5. Market Structure 2.5.1. Market Leaders 2.5.2. Market Followers 2.5.3. Emerging Players 2.6. Mergers and Acquisitions Details 3. PLA Cup Market: Dynamics 3.1. PLA Cup Market Trends by Region 3.1.1. North America PLA Cup Market Trends 3.1.2. Europe PLA Cup Market Trends 3.1.3. Asia Pacific PLA Cup Market Trends 3.1.4. Middle East and Africa PLA Cup Market Trends 3.1.5. South America PLA Cup Market Trends 3.2. PLA Cup Market Dynamics by Region 3.2.1. North America 3.2.1.1. North America PLA Cup Market Drivers 3.2.1.2. North America PLA Cup Market Restraints 3.2.1.3. North America PLA Cup Market Opportunities 3.2.1.4. North America PLA Cup Market Challenges 3.2.2. Europe 3.2.2.1. Europe PLA Cup Market Drivers 3.2.2.2. Europe PLA Cup Market Restraints 3.2.2.3. Europe PLA Cup Market Opportunities 3.2.2.4. Europe PLA Cup Market Challenges 3.2.3. Asia Pacific 3.2.3.1. Asia Pacific PLA Cup Market Drivers 3.2.3.2. Asia Pacific PLA Cup Market Restraints 3.2.3.3. Asia Pacific PLA Cup Market Opportunities 3.2.3.4. Asia Pacific PLA Cup Market Challenges 3.2.4. Middle East and Africa 3.2.4.1. Middle East and Africa PLA Cup Market Drivers 3.2.4.2. Middle East and Africa PLA Cup Market Restraints 3.2.4.3. Middle East and Africa PLA Cup Market Opportunities 3.2.4.4. Middle East and Africa PLA Cup Market Challenges 3.2.5. South America 3.2.5.1. South America PLA Cup Market Drivers 3.2.5.2. South America PLA Cup Market Restraints 3.2.5.3. South America PLA Cup Market Opportunities 3.2.5.4. South America PLA Cup Market Challenges 3.3. PORTER’s Five Forces Analysis 3.4. PESTLE Analysis 3.5. Technology Roadmap 3.6. Regulatory Landscape by Region 3.6.1. North America 3.6.2. Europe 3.6.3. Asia Pacific 3.6.4. Middle East and Africa 3.6.5. South America 3.7. Key Opinion Leader Analysis For PLA Cup Industry 3.8. Analysis of Government Schemes and Initiatives For PLA Cup Industry 3.9. PLA Cup Market Trade Analysis 3.10. The Global Pandemic Impact on PLA Cup Market 4. PLA Cup Market: Global Market Size and Forecast by Segmentation by Demand and Supply Side (by Value in USD Million) 2024-2032 4.1. PLA Cup Market Size and Forecast, by Capacity (2024-2032) 4.1.1. Up to 10 oz 4.1.2. 10 to 15 oz 4.1.3. 15 to 20 oz 4.1.4. 20 to 25 oz 4.2. PLA Cup Market Size and Forecast, by Sales Channel (2024-2032) 4.2.1. Manufacturers (Direct Sales) 4.2.2. Distributors 4.2.3. E retail / Online Stores 4.2.4. Retailers 4.3. PLA Cup Market Size and Forecast, by Application (2024-2032) 4.3.1. Restaurants 4.3.2. Cafes 4.3.3. Bars & Lounges 4.3.4. Hotels & Motels 4.3.5. Catering Services 4.3.6. Others 4.4. PLA Cup Market Size and Forecast, by End User (2024-2032) 4.4.1. Insider Threat Detection 4.4.2. Fraud Detection 4.4.3. Continuous Authentication 4.4.4. User & Entity Monitoring 4.4.5. Threat Hunting 4.4.6. Others 4.5. PLA Cup Market Size and Forecast, by Region (2024-2032) 4.5.1. North America 4.5.2. Europe 4.5.3. Asia Pacific 4.5.4. Middle East and Africa 4.5.5. South America 5. North America PLA Cup Market Size and Forecast by Segmentation (by Value in USD Million) 2024-2032 5.1. North America PLA Cup Market Size and Forecast, by Capacity (2024-2032) 5.1.1. Up to 10 oz 5.1.2. 10 to 15 oz 5.1.3. 15 to 20 oz 5.1.4. 20 to 25 oz 5.2. North America PLA Cup Market Size and Forecast, by Sales Channel (2024-2032) 5.2.1. Manufacturers (Direct Sales) 5.2.2. Distributors 5.2.3. E retail / Online Stores 5.2.4. Retailers 5.3. North America PLA Cup Market Size and Forecast, by Application (2024-2032) 5.3.1. Restaurants 5.3.2. Cafes 5.3.3. Bars & Lounges 5.3.4. Hotels & Motels 5.3.5. Catering Services 5.3.6. Others 5.4. North America PLA Cup Market Size and Forecast, by End User (2024-2032) 5.4.1. Insider Threat Detection 5.4.2. Fraud Detection 5.4.3. Continuous Authentication 5.4.4. User & Entity Monitoring 5.4.5. Threat Hunting 5.4.6. Others 5.5. North America PLA Cup Market Size and Forecast, by Country (2024-2032) 5.5.1. United States 5.5.1.1. United States PLA Cup Market Size and Forecast, by Capacity (2024-2032) 5.5.1.1.1. Up to 10 oz 5.5.1.1.2. 10 to 15 oz 5.5.1.1.3. 15 to 20 oz 5.5.1.1.4. 20 to 25 oz 5.5.1.2. United States PLA Cup Market Size and Forecast, by Sales Channel (2024-2032) 5.5.1.2.1. Manufacturers (Direct Sales) 5.5.1.2.2. Distributors 5.5.1.2.3. E retail / Online Stores 5.5.1.2.4. Retailers 5.5.1.3. United States PLA Cup Market Size and Forecast, by Application (2024-2032) 5.5.1.3.1. Restaurants 5.5.1.3.2. Cafes 5.5.1.3.3. Bars & Lounges 5.5.1.3.4. Hotels & Motels 5.5.1.3.5. Catering Services 5.5.1.3.6. Others 5.5.1.4. United States PLA Cup Market Size and Forecast, by End User (2024-2032) 5.5.1.4.1. Insider Threat Detection 5.5.1.4.2. Fraud Detection 5.5.1.4.3. Continuous Authentication 5.5.1.4.4. User & Entity Monitoring 5.5.1.4.5. Threat Hunting 5.5.1.4.6. Others 5.5.2. Canada 5.5.2.1. Canada PLA Cup Market Size and Forecast, by Capacity (2024-2032) 5.5.2.1.1. Up to 10 oz 5.5.2.1.2. 10 to 15 oz 5.5.2.1.3. 15 to 20 oz 5.5.2.1.4. 20 to 25 oz 5.5.2.2. Canada PLA Cup Market Size and Forecast, by Sales Channel (2024-2032) 5.5.2.2.1. Manufacturers (Direct Sales) 5.5.2.2.2. Distributors 5.5.2.2.3. E retail / Online Stores 5.5.2.2.4. Retailers 5.5.2.3. Canada PLA Cup Market Size and Forecast, by Application (2024-2032) 5.5.2.3.1. Restaurants 5.5.2.3.2. Cafes 5.5.2.3.3. Bars & Lounges 5.5.2.3.4. Hotels & Motels 5.5.2.3.5. Catering Services 5.5.2.3.6. Others 5.5.2.4. Canada PLA Cup Market Size and Forecast, by End User (2024-2032) 5.5.2.4.1. Insider Threat Detection 5.5.2.4.2. Fraud Detection 5.5.2.4.3. Continuous Authentication 5.5.2.4.4. User & Entity Monitoring 5.5.2.4.5. Threat Hunting 5.5.2.4.6. Others 5.5.3. Mexico 5.5.3.1. Mexico PLA Cup Market Size and Forecast, by Capacity (2024-2032) 5.5.3.1.1. Up to 10 oz 5.5.3.1.2. 10 to 15 oz 5.5.3.1.3. 15 to 20 oz 5.5.3.1.4. 20 to 25 oz 5.5.3.2. Mexico PLA Cup Market Size and Forecast, by Sales Channel (2024-2032) 5.5.3.2.1. Manufacturers (Direct Sales) 5.5.3.2.2. Distributors 5.5.3.2.3. E retail / Online Stores 5.5.3.2.4. Retailers 5.5.3.3. Mexico PLA Cup Market Size and Forecast, by Application (2024-2032) 5.5.3.3.1. Restaurants 5.5.3.3.2. Cafes 5.5.3.3.3. Bars & Lounges 5.5.3.3.4. Hotels & Motels 5.5.3.3.5. Catering Services 5.5.3.3.6. Others 5.5.3.4. Mexico PLA Cup Market Size and Forecast, by End User (2024-2032) 5.5.3.4.1. Insider Threat Detection 5.5.3.4.2. Fraud Detection 5.5.3.4.3. Continuous Authentication 5.5.3.4.4. User & Entity Monitoring 5.5.3.4.5. Threat Hunting 5.5.3.4.6. Others 6. Europe PLA Cup Market Size and Forecast by Segmentation (by Value in USD Million) 2024-2032 6.1. Europe PLA Cup Market Size and Forecast, by Capacity (2024-2032) 6.2. Europe PLA Cup Market Size and Forecast, by Sales Channel (2024-2032) 6.3. Europe PLA Cup Market Size and Forecast, by Application (2024-2032) 6.4. Europe PLA Cup Market Size and Forecast, by End User (2024-2032) 6.5. Europe PLA Cup Market Size and Forecast, by Country (2024-2032) 6.5.1. United Kingdom 6.5.1.1. United Kingdom PLA Cup Market Size and Forecast, by Capacity (2024-2032) 6.5.1.2. United Kingdom PLA Cup Market Size and Forecast, by Sales Channel (2024-2032) 6.5.1.3. United Kingdom PLA Cup Market Size and Forecast, by Application (2024-2032) 6.5.1.4. United Kingdom PLA Cup Market Size and Forecast, by End User (2024-2032) 6.5.2. France 6.5.2.1. France PLA Cup Market Size and Forecast, by Capacity (2024-2032) 6.5.2.2. France PLA Cup Market Size and Forecast, by Sales Channel (2024-2032) 6.5.2.3. France PLA Cup Market Size and Forecast, by Application (2024-2032) 6.5.2.4. France PLA Cup Market Size and Forecast, by End User (2024-2032) 6.5.3. Germany 6.5.3.1. Germany PLA Cup Market Size and Forecast, by Capacity (2024-2032) 6.5.3.2. Germany PLA Cup Market Size and Forecast, by Sales Channel (2024-2032) 6.5.3.3. Germany PLA Cup Market Size and Forecast, by Application (2024-2032) 6.5.3.4. Germany PLA Cup Market Size and Forecast, by End User (2024-2032) 6.5.4. Italy 6.5.4.1. Italy PLA Cup Market Size and Forecast, by Capacity (2024-2032) 6.5.4.2. Italy PLA Cup Market Size and Forecast, by Sales Channel (2024-2032) 6.5.4.3. Italy PLA Cup Market Size and Forecast, by Application (2024-2032) 6.5.4.4. Italy PLA Cup Market Size and Forecast, by End User (2024-2032) 6.5.5. Spain 6.5.5.1. Spain PLA Cup Market Size and Forecast, by Capacity (2024-2032) 6.5.5.2. Spain PLA Cup Market Size and Forecast, by Sales Channel (2024-2032) 6.5.5.3. Spain PLA Cup Market Size and Forecast, by Application (2024-2032) 6.5.5.4. Spain PLA Cup Market Size and Forecast, by End User (2024-2032) 6.5.6. Sweden 6.5.6.1. Sweden PLA Cup Market Size and Forecast, by Capacity (2024-2032) 6.5.6.2. Sweden PLA Cup Market Size and Forecast, by Sales Channel (2024-2032) 6.5.6.3. Sweden PLA Cup Market Size and Forecast, by Application (2024-2032) 6.5.6.4. Sweden PLA Cup Market Size and Forecast, by End User (2024-2032) 6.5.7. Austria 6.5.7.1. Austria PLA Cup Market Size and Forecast, by Capacity (2024-2032) 6.5.7.2. Austria PLA Cup Market Size and Forecast, by Sales Channel (2024-2032) 6.5.7.3. Austria PLA Cup Market Size and Forecast, by Application (2024-2032) 6.5.7.4. Austria PLA Cup Market Size and Forecast, by End User (2024-2032) 6.5.8. Rest of Europe 6.5.8.1. Rest of Europe PLA Cup Market Size and Forecast, by Capacity (2024-2032) 6.5.8.2. Rest of Europe PLA Cup Market Size and Forecast, by Sales Channel (2024-2032) 6.5.8.3. Rest of Europe PLA Cup Market Size and Forecast, by Application (2024-2032) 6.5.8.4. Rest of Europe PLA Cup Market Size and Forecast, by End User (2024-2032) 7. Asia Pacific PLA Cup Market Size and Forecast by Segmentation (by Value in USD Million) 2024-2032 7.1. Asia Pacific PLA Cup Market Size and Forecast, by Capacity (2024-2032) 7.2. Asia Pacific PLA Cup Market Size and Forecast, by Sales Channel (2024-2032) 7.3. Asia Pacific PLA Cup Market Size and Forecast, by Application (2024-2032) 7.4. Asia Pacific PLA Cup Market Size and Forecast, by End User (2024-2032) 7.5. Asia Pacific PLA Cup Market Size and Forecast, by Country (2024-2032) 7.5.1. China 7.5.1.1. China PLA Cup Market Size and Forecast, by Capacity (2024-2032) 7.5.1.2. China PLA Cup Market Size and Forecast, by Sales Channel (2024-2032) 7.5.1.3. China PLA Cup Market Size and Forecast, by Application (2024-2032) 7.5.1.4. China PLA Cup Market Size and Forecast, by End User (2024-2032) 7.5.2. S Korea 7.5.2.1. S Korea PLA Cup Market Size and Forecast, by Capacity (2024-2032) 7.5.2.2. S Korea PLA Cup Market Size and Forecast, by Sales Channel (2024-2032) 7.5.2.3. S Korea PLA Cup Market Size and Forecast, by Application (2024-2032) 7.5.2.4. S Korea PLA Cup Market Size and Forecast, by End User (2024-2032) 7.5.3. Japan 7.5.3.1. Japan PLA Cup Market Size and Forecast, by Capacity (2024-2032) 7.5.3.2. Japan PLA Cup Market Size and Forecast, by Sales Channel (2024-2032) 7.5.3.3. Japan PLA Cup Market Size and Forecast, by Application (2024-2032) 7.5.3.4. Japan PLA Cup Market Size and Forecast, by End User (2024-2032) 7.5.4. India 7.5.4.1. India PLA Cup Market Size and Forecast, by Capacity (2024-2032) 7.5.4.2. India PLA Cup Market Size and Forecast, by Sales Channel (2024-2032) 7.5.4.3. India PLA Cup Market Size and Forecast, by Application (2024-2032) 7.5.4.4. India PLA Cup Market Size and Forecast, by End User (2024-2032) 7.5.5. Australia 7.5.5.1. Australia PLA Cup Market Size and Forecast, by Capacity (2024-2032) 7.5.5.2. Australia PLA Cup Market Size and Forecast, by Sales Channel (2024-2032) 7.5.5.3. Australia PLA Cup Market Size and Forecast, by Application (2024-2032) 7.5.5.4. Australia PLA Cup Market Size and Forecast, by End User (2024-2032) 7.5.6. Indonesia 7.5.6.1. Indonesia PLA Cup Market Size and Forecast, by Capacity (2024-2032) 7.5.6.2. Indonesia PLA Cup Market Size and Forecast, by Sales Channel (2024-2032) 7.5.6.3. Indonesia PLA Cup Market Size and Forecast, by Application (2024-2032) 7.5.6.4. Indonesia PLA Cup Market Size and Forecast, by End User (2024-2032) 7.5.7. Malaysia 7.5.7.1. Malaysia PLA Cup Market Size and Forecast, by Capacity (2024-2032) 7.5.7.2. Malaysia PLA Cup Market Size and Forecast, by Sales Channel (2024-2032) 7.5.7.3. Malaysia PLA Cup Market Size and Forecast, by Application (2024-2032) 7.5.7.4. Malaysia PLA Cup Market Size and Forecast, by End User (2024-2032) 7.5.8. Vietnam 7.5.8.1. Vietnam PLA Cup Market Size and Forecast, by Capacity (2024-2032) 7.5.8.2. Vietnam PLA Cup Market Size and Forecast, by Sales Channel (2024-2032) 7.5.8.3. Vietnam PLA Cup Market Size and Forecast, by Application (2024-2032) 7.5.8.4. Vietnam PLA Cup Market Size and Forecast, by End User (2024-2032) 7.5.9. Taiwan 7.5.9.1. Taiwan PLA Cup Market Size and Forecast, by Capacity (2024-2032) 7.5.9.2. Taiwan PLA Cup Market Size and Forecast, by Sales Channel (2024-2032) 7.5.9.3. Taiwan PLA Cup Market Size and Forecast, by Application (2024-2032) 7.5.9.4. Taiwan PLA Cup Market Size and Forecast, by End User (2024-2032) 7.5.10. Rest of Asia Pacific 7.5.10.1. Rest of Asia Pacific PLA Cup Market Size and Forecast, by Capacity (2024-2032) 7.5.10.2. Rest of Asia Pacific PLA Cup Market Size and Forecast, by Sales Channel (2024-2032) 7.5.10.3. Rest of Asia Pacific PLA Cup Market Size and Forecast, by Application (2024-2032) 7.5.10.4. Rest of Asia Pacific PLA Cup Market Size and Forecast, by End User (2024-2032) 8. Middle East and Africa PLA Cup Market Size and Forecast by Segmentation (by Value in USD Million) 2024-2032 8.1. Middle East and Africa PLA Cup Market Size and Forecast, by Capacity (2024-2032) 8.2. Middle East and Africa PLA Cup Market Size and Forecast, by Sales Channel (2024-2032) 8.3. Middle East and Africa PLA Cup Market Size and Forecast, by Application (2024-2032) 8.4. Middle East and Africa PLA Cup Market Size and Forecast, by End User (2024-2032) 8.5. Middle East and Africa PLA Cup Market Size and Forecast, by Country (2024-2032) 8.5.1. South Africa 8.5.1.1. South Africa PLA Cup Market Size and Forecast, by Capacity (2024-2032) 8.5.1.2. South Africa PLA Cup Market Size and Forecast, by Sales Channel (2024-2032) 8.5.1.3. South Africa PLA Cup Market Size and Forecast, by Application (2024-2032) 8.5.1.4. South Africa PLA Cup Market Size and Forecast, by End User (2024-2032) 8.5.2. GCC 8.5.2.1. GCC PLA Cup Market Size and Forecast, by Capacity (2024-2032) 8.5.2.2. GCC PLA Cup Market Size and Forecast, by Sales Channel (2024-2032) 8.5.2.3. GCC PLA Cup Market Size and Forecast, by Application (2024-2032) 8.5.2.4. GCC PLA Cup Market Size and Forecast, by End User (2024-2032) 8.5.3. Nigeria 8.5.3.1. Nigeria PLA Cup Market Size and Forecast, by Capacity (2024-2032) 8.5.3.2. Nigeria PLA Cup Market Size and Forecast, by Sales Channel (2024-2032) 8.5.3.3. Nigeria PLA Cup Market Size and Forecast, by Application (2024-2032) 8.5.3.4. Nigeria PLA Cup Market Size and Forecast, by End User (2024-2032) 8.5.4. Rest of ME&A 8.5.4.1. Rest of ME&A PLA Cup Market Size and Forecast, by Capacity (2024-2032) 8.5.4.2. Rest of ME&A PLA Cup Market Size and Forecast, by Sales Channel (2024-2032) 8.5.4.3. Rest of ME&A PLA Cup Market Size and Forecast, by Application (2024-2032) 8.5.4.4. Rest of ME&A PLA Cup Market Size and Forecast, by End User (2024-2032) 9. South America PLA Cup Market Size and Forecast by Segmentation (by Value in USD Million) 2024-2032 9.1. South America PLA Cup Market Size and Forecast, by Capacity (2024-2032) 9.2. South America PLA Cup Market Size and Forecast, by Sales Channel (2024-2032) 9.3. South America PLA Cup Market Size and Forecast, by Application(2024-2032) 9.4. South America PLA Cup Market Size and Forecast, by End User (2024-2032) 9.5. South America PLA Cup Market Size and Forecast, by Country (2024-2032) 9.5.1. Brazil 9.5.1.1. Brazil PLA Cup Market Size and Forecast, by Capacity (2024-2032) 9.5.1.2. Brazil PLA Cup Market Size and Forecast, by Sales Channel (2024-2032) 9.5.1.3. Brazil PLA Cup Market Size and Forecast, by Application (2024-2032) 9.5.1.4. Brazil PLA Cup Market Size and Forecast, by End User (2024-2032) 9.5.2. Argentina 9.5.2.1. Argentina PLA Cup Market Size and Forecast, by Capacity (2024-2032) 9.5.2.2. Argentina PLA Cup Market Size and Forecast, by Sales Channel (2024-2032) 9.5.2.3. Argentina PLA Cup Market Size and Forecast, by Application (2024-2032) 9.5.2.4. Argentina PLA Cup Market Size and Forecast, by End User (2024-2032) 9.5.3. Rest Of South America 9.5.3.1. Rest Of South America PLA Cup Market Size and Forecast, by Capacity (2024-2032) 9.5.3.2. Rest Of South America PLA Cup Market Size and Forecast, by Sales Channel (2024-2032) 9.5.3.3. Rest Of South America PLA Cup Market Size and Forecast, by Application (2024-2032) 9.5.3.4. Rest Of South America PLA Cup Market Size and Forecast, by End User (2024-2032) 10. Company Profile: Key Players 10.1. Biopac Ltd (U.K.) 10.1.1. Company Overview 10.1.2. Business Portfolio 10.1.3. Financial Overview 10.1.4. SWOT Analysis 10.1.5. Strategic Analysis 10.1.6. Scale of Operation (small, medium, and large) 10.1.7. Details on Partnership 10.1.8. Regulatory Accreditations and Certifications Received by Them 10.1.9. Awards Received by the Firm 10.1.10. Recent Developments 10.2. Celebration Paper & Plastics Ltd. (U.K.) 10.3. Avani Eco Hub (Indonesia) 10.4. Eco-Products, Inc. (U.S.) 10.5. Betterearth Llc (U.S.) 10.6. Green Paper Products (U.S.) 10.7. Genpak, LLC (U.S.) 10.8. Dart Container Corporation (U.S.) 10.9. Pactiv LLC (U.S.) 10.10. Lollicup USA Inc. (U.S.) 10.11. Eco-Products, Inc. (U.S.) 10.12. Go-Pak UK LTD (U.K. 11. Key Findings 12. Industry Recommendations 13. PLA Cup Market: Research Methodology 14. Terms and Glossary
  • INQUIRE BEFORE BUYING
MMRLogo
America's Fastest Growing Market Research Firm