
North America Active Pharmaceutical Ingredients Market Size by Factor, Synthesis Type, - Segment-Level Market Assessment, Growth Opportunity Analysis, Competitive Mapping & Forecast to 2026
Overview
North America Active Pharmaceutical Ingredients Market is expected to reach US$ 98.35 Bn. at a CAGR of 5.84 during the forecast period 2027.
The report includes an analysis of the impact of COVID-19 lockdown on the revenue of market leaders, followers, and disruptors. Since the lockdown was implemented differently in various regions and countries; the impact of the same is also seen differently by regions and segments. The report has covered the current short-term and long-term impact on the market, and it would help the decision-makers to prepare the outline and strategies for companies by region.
To know about the Research Methodology:-Request Free Sample Report
North America Active Pharmaceutical Ingredients Market Dynamics:
The active pharmaceutical ingredient or API is that component of the drug, which produces the medicinal effects. Combination therapies are used by certain drugs which have multiple active ingredients for treating various health-related symptoms. All drugs are usually made up of two main components that are API and excipient. API is the central ingredient for drugs while the excipient is the substance that covers API. An excipient is used for delivering medication inside the human body system. Excipients by composition are chemically inactive substances that do not react with the API and delivers the drug directly inside the system. Manufacturers or pharmaceutical companies use certain pre-notified standards for determining how strong the API must be for each drug. The standard for API may vary extensively from one brand to another as companies may use different tests manufacturing drugs.
North America Active Pharmaceutical Ingredients Market Segment Analysis:
The active pharmaceuticals market for North America is divided into synthesis type, drug type, manufacturer type, therapeutic area, and geography. On the basis of synthesis type, the market for active pharmaceuticals is segmented into biotech and synthetic. The biotech segment monitored the highest growth due to high R&D for novel biosimilar drugs, and a shift in focus of traditional manufacturers towards biological drugs. Branded drugs, generic drugs, and over-the-counter (OTC) drugs formed the three segments on the basis of which drug type is demarcated for the active pharmaceutical ingredients market. The rise in drug prices coupled with higher spending on R&D activities have resulted in branded drugs forming the largest segment.
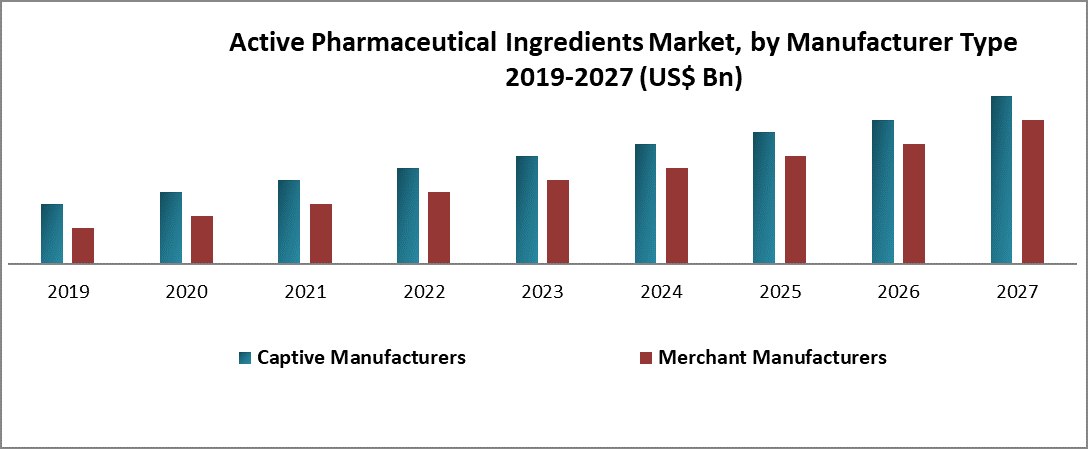
By manufacturer type, the market is bifurcated into captive and merchant manufacturers where the merchant manufacturers are expected to monitor the highest growth. There has been a rise in outsourcing of API/ drug molecule formulation from various drug manufacturers globally. Drug manufacturers opt for outsourcing to eliminate the need for heavy investment in the manufacturing process. These factors have resulted in the higher growth rate of merchant manufacturers.
North America Active Pharmaceutical Ingredients Market Country Insights:
The US and Canada are two main regions profiled under the North America active pharmaceuticals market. The rise in R&D infrastructure coupled with favorable government initiatives is some of the major factors that have propelled the market growth for active pharmaceuticals in North America. In addition, the technological developments within the drug manufacturing sector process have also boosted the growth of the active pharmaceutical ingredients market in North America.
Active Pharmaceutical Ingredients Market, Key Highlights:
• North America Active Pharmaceutical Ingredients market size analysis and forecast
• Comprehensive study and analysis of market drivers, restraints, and opportunities influencing the growth of the North America Active Pharmaceutical Ingredients market
• Active Pharmaceutical Ingredients market segmentation on the basis of synthesis type, drug type, manufacturer type, therapeutic area, and geography.
• Active Pharmaceutical Ingredients market strategic analysis with respect to individual growth trends, future prospects along the contribution of various sub-market stakeholders have been considered under the scope of the study.
• Active Pharmaceutical Ingredients market analysis and forecast for major countries have been provided.
• Profiling of key industry players, their strategic perspective, market positioning, and analysis of core competencies
• Competitive landscape of the key players operating in the Active Pharmaceutical Ingredients market including competitive developments, investments, and strategic expansion
For company profiles, 2016 has been considered as the base year. In cases, wherein information was unavailable for the base year, the years prior to it have been considered.
Active Pharmaceutical Ingredients Market, Research Methodology:
The market is estimated by triangulation of data points obtained from various sources and feeding them into a simulation model created individually for each market. The data points are obtained from paid and unpaid sources along with paid primary interviews with key opinion leaders (KOLs) in the market. KOLs from both, demand and supply sides were considered while conducting interviews to get an unbiased idea of the market. This exercise was done at the country level to get a fair idea of the market in countries considered for this study. Later this country-specific data was accumulated to come up with regional numbers and then arrive at market value for North America Active Pharmaceutical Ingredients Market.
Active Pharmaceutical Ingredients Market, Key Target Audience:
• Healthcare companies
• Corporate healthcare entities
• Government agencies
• Market research and consulting firms
• Venture capitalists
• Technical Students
Scope of the Active Pharmaceutical Ingredients Market Report: Inquire before buying
Active Pharmaceutical Ingredients Market, By Synthesis Type
• Biotech
• Monoclonal Antibodies
• Recombinant Proteins
• Vaccines
• Synthetic
Active Pharmaceutical Ingredients Market, By Drug Type
• Branded Drugs
• Generic Drugs
• Over-the-counter (OTC) Drugs
Active Pharmaceutical Ingredients Market, By Manufacturer Type
• Captive Manufacturers
• Merchant Manufacturers
Active Pharmaceutical Ingredients Market, By Therapeutic Area
• Cardiology
• Pulmonology
• Oncology
• Neurology
• Ophthalmology
• Orthopedics
• Others
Active Pharmaceutical Ingredients Market, By Geography:
• North America
• US
• Canada
Key Players Operating in the North America Active Pharmaceutical Ingredients Market:
• AbbVie Inc.
• Bristol-Myers Squibb Company
• Merck & Co., Inc.
• Eli Lilly and Company
• Sandoz
• Biospectra
• Sun Pharmaceuticals
• Mylan
• Dr. Reddy’s Laboratories
• Aurobindo Pharma
Available Customizations
Maximize Market Research offers customizations of reports according to the specific requirement of our clients