Sodium Hydrosulfite Market Size by Type, Product, Application, Region – Revenue Pool Analysis, Margin Structure Assessment, Capital Flow Trends, Competitive Benchmarking & Forecast to 2034

2.7%
CAGR (2026-2034)
1.2 USD Bn.
Forecast Market Size
306
Report Pages
130
Market Tables

Overview

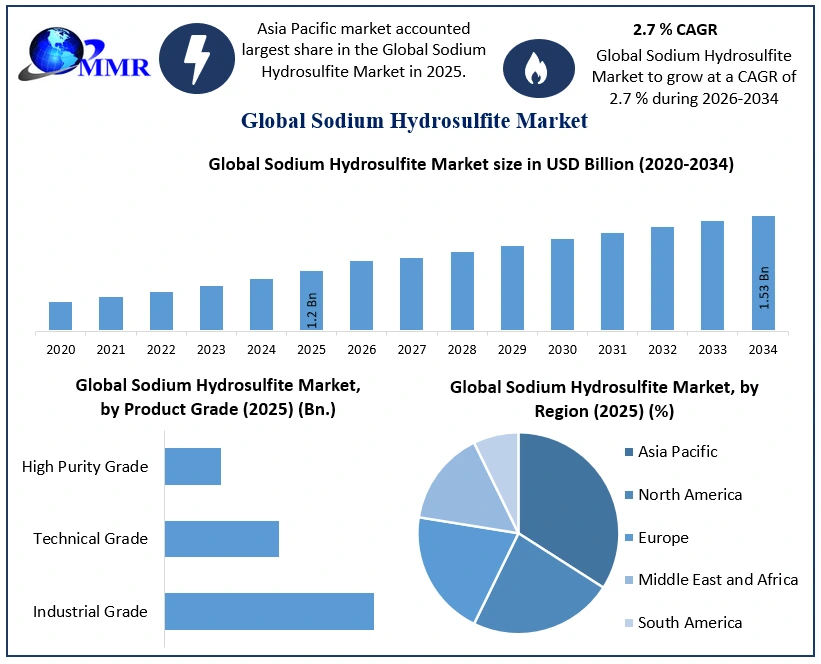
Sodium Hydrosulfite Market size was valued at USD 1.2 Billion in 2025 and is expected to reach  USD 1.53 Bn. by 2034 with the CAGR of 2.7% during the forecast period.

Sodium Hydrosulfite Market Definition:

Sodium Hydrosulfite (Na2S2O4) is a water soluble white crystalline powder, commonly known as Sodium dithionite used as a reducing and bleaching agent, especially in stripping textiles, printing and dyeing e.g. indigo dye. Annually, 550,000 tons of Sodium Hydrosulfite is produced worldwide in which China and Europe held the majority share. Regionally, Asia Pacific region is expected to dominate the market share in 2025. The report study has analyzed revenue impact of covid-19 pandemic on the sales revenue of market leaders, market followers and disrupters in the report and same is reflected in our analysis.
Sodium Hydrosulfite Market Growth Outlook

To know about the Research Methodology :- Request Free Sample Report

Sodium Hydrosulfite Market Dynamics:

This market study offers a comprehensive analysis of the business models, key influencing factors, market strategies, statistical analysis, Trends and respective market shares of some of the most prominent players in this landscape.

The surging demand for paper products in APAC is estimated to drive the growth of the global sodium hydrosulfite market during the forecast due to pervasive application as a reductive bleaching agent in the paper manufacturing process. The Asia Pacific is estimated to have the highest CAGR of 45% of and is the major regional market for the paper industry in the worldwide. The growth is also expanding by rising application in various industries such as textile, pharmaceutical, food additives, paper, wood pulp bleaching and kaolin bleaching. Apart from these, upsurge demand for cosmetics, kaolin bleaching with growing use and lucrative growth of textile dye is estimated to project large opportunity for further development in the global market.

However, Global Sodium Hydrosulfite market is estimated to have some severe challenges from the fluctuating phase of the paper and pulp industry to the high cost of raw materials in the upcoming year, thereby hindering the growth of the global market.

Sodium Hydrosulfite Market Segment Analysis:

The report covers the brief analytical segments of the Global Sodium Hydrosulfite Market thereby providing a wider view at the macro as well as micro levels.

Based on Product Grade, The global sodium hydrosulfite market is segmented by product grade into industrial grade, technical grade, and high purity grade. Industrial grade sodium hydrosulfite is widely used in textile processing, pulp and paper bleaching, mineral processing, and industrial wastewater treatment. Technical grade sodium hydrosulfite serves as a reducing agent in chemical manufacturing, dye production, leather processing, and various industrial applications. High purity grade sodium hydrosulfite is preferred in applications requiring controlled chemical composition, lower impurity levels, and consistent performance. Demand across grades depends on purity requirements, application conditions, and end-user industry specifications.

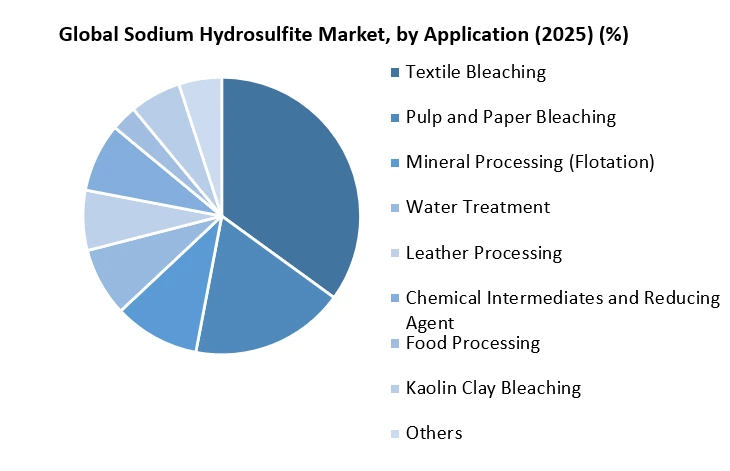
Based on Application,The global sodium hydrosulfite market serves several industries due to its strong reducing and bleaching properties. Textile bleaching represents a major application, where sodium hydrosulfite removes excess dye and improves fabric whiteness. Pulp and paper bleaching uses the chemical to brighten pulp while supporting paper production processes. Mineral processing applications use sodium hydrosulfite in flotation and mineral treatment, while water treatment applications benefit from its reducing properties for contaminant removal. It also supports leather processing, chemical intermediates, food processing, and kaolin clay bleaching. Other applications include industrial cleaning, dye reduction, and specialized chemical manufacturing.
Sodium Hydrosulfite Market by Application

Sodium Hydrosulfite Market, Regional Insights

In terms of region, Asia Pacific emerged as the largest market in 2025 and is expected to continue its dominance during the forecast period. APAC has emerged as the largest producer as well as the consumer of sodium hydrosulfite. Among which China is registered to have highest demand with more than 65% in the global market. Other Asian economy such as Japan, India, and Pakistan are also contributing significantly growth in the market. Chiefly driven by the rapid industrialization, growing demand from textile processing and presence of large manufactures in the region.
On the other hand, North America and Europe is also rapidly growing at the fastest rate over the forecast period by 2034 growing due to flourishing wood pulp bleaching industries.

Sodium Hydrosulfite Market Competitive Analysis:

Global Sodium Hydrosulfite Market is extremely uneven and the market vendors use various strategies such ascollaborations, expansions, acquisitions, and launch of new products, joint ventures, acquisitions, and others to upturn their ways in this market.
The objective of the report is to present a comprehensive analysis of the Sodium Hydrosulfite Market including all the stakeholders of the industry. The past and current status of the industry with forecasted market size and trends are presented in the report with the analysis of complicated data in simple language. The report covers all the aspects of the industry with a dedicated study of key players that includes market leaders, followers, and new entrants. PORTER, SVOR, PESTEL analysis with the potential impact of micro-economic factors of the market have been presented in the report. External as well as internal factors that are supposed to affect the business positively or negatively have been analyzed, which will give a clear futuristic view of the industry to the decision-makers.

Recent Industry Developments (2025–2026)

Exact Date Company Development Impact
22 February 2026 BASF SE Integrated mass-balance carbon tracking into its global sodium hydrosulfite and sulfite portfolios to support net-zero textile manufacturing. This allows downstream customers to verify Scope 3 emissions reductions, providing a significant competitive advantage in the European and North American markets.
12 January 2026 Shandong Huarong Group Commissioned a new high-purity production line in China, expanding regional sodium hydrosulfite capacity by an estimated 12%. The increased supply has led to price stabilization across the Asia-Pacific region, making high-yield pulp bleaching more cost-effective for packaging manufacturers.

The report also helps in understanding Global Sodium Hydrosulfite Market dynamics, structure by analyzing the market segments and projects the Global Sodium Hydrosulfite Market size. Clear representation of competitive analysis of key players By Product, price, financial position, Product portfolio, growth strategies, and regional presence in the Global Sodium Hydrosulfite Market make the report investor’s guide.

Sodium Hydrosulfite Market Scope: Inquire before buying

Sodium Hydrosulfite Market
Report Coverage Details
Base Year: 2025 Forecast Period: 2026-2034
Historical Data: 2020 to 2025 Market Size in 2025: USD 1.2 Bn.
Forecast Period 2026-2034 CAGR: 2.7% Market Size in 2034: USD 1.53 Bn.
Segments Covered: by Product Grade Industrial Grade
Technical Grade
High Purity Grade
by Form Powder
Liquid
by Production Process Zinc Process
Sodium Formate Process
Borol Process
Others
by Application Textile Bleaching
Pulp and Paper Bleaching
Mineral Processing (Flotation)
Water Treatment
Leather Processing
Chemical Intermediates and Reducing Agent
Food Processing
Kaolin Clay Bleaching
Others
by End-Use Industry Textile and Apparel
Pulp and Paper
Mining and Mineral Processing
Water and Wastewater Treatment
Leather and Tanning
Chemicals
Food and Beverage
Others
by Sales Channel Direct Sales
Distributors and Traders
Online

Sodium Hydrosulfite Market, by Region:

Asia Pacific (China, South Korea, Japan, India, Australia, Indonesia, Malaysia, Vietnam, Taiwan, Bangladesh, Pakistan and Rest of APAC)
Europe (UK, France, Germany, Italy, Spain, Sweden, Austria and Rest of Europe)
North America (United States, Canada and Mexico)
Middle East and Africa (South Africa, GCC, Egypt, Nigeria and Rest of ME&A)
South America (Brazil, Argentina Rest of South America)

Key Players / Competitors Profiles Covered in Brief in Global Sodium Hydrosulfite Market Report in Strategic Perspective:

  1. Yantai Jinhe Sodium Hydrosulfite Factory (Jinhe Group)

  2. Guangdong Zhongcheng Chemicals Inc.

  3. Hubei Yihua Chemical Industry Co., Ltd.

  4. Shandong Aojin Chemical Technology Co., Ltd.

  5. Jiangxi Hongan Chemical Co., Ltd.

  6. Qinyang Vidon Chemical Co., Ltd.

  7. Jinchangsheng Chemical

  8. Transpek-Silox Industry Pvt. Ltd.

  9. Gulshan Chemicals Pvt. Ltd.

  10. Demosha Chemicals Pty Ltd

  11. Silox Group (Belgium)

  12. Kanto Chemical Co.

  13. Gulshan Chemicals Pvt. Ltd.

  14. TCP Limited

Others

Frequently Asked Questions

1.Which region dominates the global sodium hydrosulfite market?
Ans: Asia Pacific dominates the global sodium hydrosulfite market in 2025 due to strong production capacity, textile manufacturing activities, pulp and paper demand, and the presence of major manufacturers, particularly in China.

2. What is the expected sodium hydrosulfite market size by 2034?
Ans: The global market is projected to reach approximately USD 1.53 billion by 2034, supported by increasing industrial applications and demand for reducing and bleaching agents.

3.Which product grade dominates the sodium hydrosulfite market?
Ans: Industrial grade represents a major product category because of its extensive use in textile bleaching, pulp and paper processing, mineral treatment, and other industrial applications.

4.Who are the key players in the global sodium hydrosulfite market?
Ans: Major companies include Yantai Jinhe Sodium Hydrosulfite Factory, Guangdong Zhongcheng Chemicals, Guangdi Maoming Chemical, Hubei Yihua Chemical Industry, Shandong Aojin Chemical Technology, Jiangxi Hongan Chemical, Transpek-Silox Industry, Gulshan Chemicals, and TCP Limited.

5. What is the outlook for the global sodium hydrosulfite market through 2034?
Ans: The market is expected to experience steady growth through 2034, supported by continued demand from textile, paper, chemical, mining, and water treatment industries, with Asia Pacific maintaining its leading regional position.

Table of Contents

1. GLOBAL SODIUM HYDROSULFITE MARKET INTRODUCTION 1.1 Executive Market Landscape and Industry Overview 1.1.1 Global Sodium Hydrosulfite Market Size Valuation Tracking and Projections (Value in USD Mn & Volume in Metric Tons), 2026–2034 1.1.2 Historical Market Evolution, Early-Stage Pilot Infrastructure, and Industrial Scale-Up Milestones 1.1.3 Current Global Industry Structure, Corporate Integration Trends, and Commercial Ecosystem Dynamics 1.1.4 Key Policy-Driven Growth Drivers Supporting Immediate Market Expansion 1.1.5 Major Macroeconomic Industry Challenges, Technology Bottlenecks, and Structural Market Constraints 1.1.6 Emerging High-Value Growth Opportunities Across the Forecast Period 1.1.7 Strategic Long-Term Investment and Market Development Outlook Through 2034 1.2 Global Sodium Hydrosulfite Market Dynamics & Strategic Predictive Frameworks 1.2.1 Global Sodium Hydrosulfite Market Trends 1.2.2 Global Sodium Hydrosulfite Market DROC Framework Analysis: 1.2.3 Drivers 1.2.4 Restraints 1.2.5 Opportunities 1.2.6 Challenges 1.2.7 PORTER’S Five Forces Analytical Framework: 1.2.8 Supplier Power 1.2.9 Buyer Power 1.2.10 Threat of New Entrants 1.2.11 Threat of Substitutes 1.2.12 Competitive Rivalry 1.2.13 PESTLE Analysis (Political, Economic, Social, Technological, Legal, and Environmental Indicators) 1.3 Market Penetration and Industry Adoption Analysis 1.3.1 Global Market Penetration Across Major Industrial Applications 1.3.2 End-Use Industry Adoption Trend and Growth Assessment 1.3.3 Emerging Regional Market Expansion Opportunity Analysis 1.3.4 Developed and Developing Market Adoption Comparison 1.3.5 Industrial Consumption Penetration Across Key End Users 1.3.6 Future Industry Adoption Potential Through Forecast Period 1.4 Industry Usage and End-Use Consumption Analysis 1.4.1 Textile Bleaching Industry Consumption and Demand Analysis 1.4.2 Pulp and Paper Manufacturing Industry Usage Analysis 1.4.3 Mineral Processing Industry Chemical Consumption Assessment 1.4.4 Water Treatment Industry Application Demand Evaluation 1.4.5 Leather Processing Industry Utilization Trend Assessment 1.4.6 Food Processing Industry Adoption Pattern Analysis 1.5 Market Ecosystem and Value Chain Analysis 1.5.1 Complete Industry Ecosystem Structure and Participant Analysis 1.5.2 Raw Material Supplier Network and Procurement Assessment 1.5.3 Manufacturing Value Chain Structure and Cost Analysis 1.5.4 Distribution Channel Performance and Efficiency Evaluation 1.5.5 Downstream Customer Relationship and Value Creation Assessment 1.5.6 Strategic Value Chain Optimization Opportunity Analysis 1.6 Raw Material Procurement and Supply Analysis 1.6.1 Raw Material Availability Across Global Manufacturing Regions 1.6.2 Feedstock Price Trends Influencing Production Economics 1.6.3 Supplier Landscape and Procurement Strategy Assessment 1.6.4 Raw Material Cost Structure Comparative Analysis 1.6.5 Supply Risk Assessment Across Major Feedstocks 1.7 Manufacturing Process and Production Analysis 2025 1.7.1 Commercial Manufacturing Process Technology Comparative Assessment 1.7.2 Global Production Capacity by Manufacturing Region 1.7.3 Capacity Utilization Trends Across Production Facilities 1.7.4 Manufacturing Cost Structure and Efficiency Analysis 1.7.5 Production Expansion Projects and Capacity Development Plans 1.7.6 Manufacturing Technology Innovation and Automation Trends 1.8 Product Grade Performance and Demand Analysis 1.8.1 Industrial Grade Market Demand and Growth Assessment 1.8.2 Technical Grade Consumption Pattern Across Industries 1.8.3 High Purity Grade Market Performance Evaluation 1.8.4 Product Grade Comparison by Industrial Applications 1.8.5 Product Quality Standards and Performance Benchmarking 1.8.6 Product Grade Demand Forecast Analysis 1.9 Application Performance and Consumption Analysis 1.9.1 Textile Bleaching Application Market Demand Assessment 1.9.2 Paper Manufacturing Application Consumption Trend Analysis 1.9.3 Mineral Beneficiation Application Market Growth Evaluation 1.9.4 Water Treatment Application Demand Performance Analysis 1.9.5 Chemical Processing Application Market Opportunity Assessment 1.9.6 Emerging Industrial Applications Supporting Future Market Growth 1.10 Pricing Structure and Cost Analysis 1.10.1 Historical Global Pricing Trend Analysis, 2020–2025 1.10.2 Regional Product Price Comparison Across Major Markets 1.10.3 Raw Material Cost Impact on Product Pricing 1.10.4 Manufacturing Cost Structure and Margin Assessment 1.10.5 Distributor Pricing Strategy and Market Evaluation 1.10.6 Future Product Price Forecast Through 2034 1.11 Supply Chain and Distribution Network Analysis 1.11.1 Global Supply Chain Structure and Performance Assessment 1.11.2 Regional Distribution Network Efficiency Comparative Analysis 1.11.3 Logistics Infrastructure and Transportation Cost Evaluation 1.11.4 Inventory Management and Warehouse Optimization Trends 1.11.5 Supply Chain Risk and Resilience Assessment 1.11.6 Distribution Strategy and Network Development Outlook 1.12 Import Export and Trade Flow Analysis 1.12.1 Global Export Performance by Major Producing Countries 1.12.2 Customer Satisfaction Drivers Influencing Repeat Purchases 1.12.3 Global Import Demand Across Key Consumer Markets 1.12.4 International Trade Flow Pattern and Trend Assessment 1.12.5 Country-Level Export Competitiveness Comparative Analysis 1.12.6 Import Dependency Assessment Across Major Regions 1.12.7 International Trade Opportunity and Risk Analysis 1.13 Demand Analysis by End-Use Industries 1.13.1 Textile Industry Demand Trends and Future Outlook 1.13.2 Paper Manufacturing Industry Consumption Growth Assessment 1.13.3 Mining Industry Chemical Demand Pattern Analysis 1.13.4 Water Treatment Industry Consumption Trend Evaluation 1.13.5 Leather Processing Industry Demand Growth Assessment 1.13.6 Emerging End-Use Industry Consumption Opportunity Analysis 1.14 Production Capacity and Utilization Analysis 1.14.1 Global Manufacturing Capacity Distribution Across Major Regions 1.14.2 Regional Capacity Utilization Trend and Performance Analysis 1.14.3 Historical Production Capacity Growth Analysis, 2020–2025 1.14.4 Planned Capacity Expansion Projects Through Forecast Period 1.14.5 Manufacturing Output Comparison Across Key Countries 1.14.6 Production Capacity Development Opportunity Assessment 1.15 Technology and Process Innovation Analysis 1.15.1 Conventional Production Technology Performance and Efficiency Analysis 1.15.2 Advanced Manufacturing Technology Adoption Trend Assessment 1.15.3 Process Automation Development Across Manufacturing Facilities 1.15.4 Digital Manufacturing Integration and Smart Factory Assessment 1.15.5 Sustainable Production Technology Innovation Landscape Analysis 1.15.6 Technology Advancement and Commercialization Roadmap 1.16 Regulatory Framework and Compliance Analysis 1.16.1 Global Chemical Regulatory Landscape and Compliance Requirements 1.16.2 Environmental Regulations Impacting Market Growth Prospects 1.16.3 Product Registration Standards Across Major Global Markets 1.16.4 Occupational Safety Regulations and Compliance Assessment 1.16.5 Transportation and Storage Regulatory Requirement Analysis 1.16.6 Regulatory Developments Influencing Industry Expansion 1.17 Sustainability and Environmental Impact Analysis 1.17.1 Sustainable Manufacturing Practices Across Global Production Facilities 1.17.2 Carbon Emission Reduction Initiatives and Industry Progress 1.17.3 Circular Economy Adoption Across Industrial Value Chains 1.17.4 Waste Management Practices and Environmental Compliance Assessment 1.17.5 Renewable Energy Integration Supporting Manufacturing Operations 1.17.6 Sustainability Strategies Enhancing Market Competitiveness 1.18 Investment and Capital Expenditure Analysis 1.18.1 Manufacturing Investment Trends Across Major Global Regions 1.18.2 Capital Expenditure Analysis by Production Facilities 1.18.3 Capacity Expansion Investment Opportunity Assessment 1.18.4 Greenfield and Brownfield Investment Trend Comparison 1.18.5 Infrastructure Development Supporting Manufacturing Growth Prospects 1.18.6 Investment Pipeline Through Forecast Period 1.19 Procurement and Purchasing Trend Analysis 1.19.1 Industrial Procurement Strategy Across End-Use Industries 1.19.2 Bulk Purchasing Trends Among Major Industrial Consumers 1.19.3 Supplier Selection Criteria and Evaluation Framework 1.19.4 Long-Term Procurement Contract Trend Assessment 1.19.5 Procurement Cost Optimization Strategy Comparative Analysis 1.19.6 Purchasing Behavior Across Global Markets 1.20 Customer Buying Criteria and Demand Analysis 1.20.1 Industrial Customer Purchasing Decision Factor Assessment 1.20.2 Product Quality Preference Across Major End Users 1.20.3 Price Sensitivity Analysis Among Industrial Buyers 1.20.4 Supplier Selection Preferences Across Global Industries 1.21 Global Sodium Hydrosulfite Market: Market Size and Forecast by Segmentation (by Value USD Billion and Volume in Metric Tons ) (2025-2034) 1.21.1 Global Sodium Hydrosulfite Market Size and Forecast, By Product Grade 1.21.2 Industrial Grade 1.21.3 Technical Grade 1.21.4 High Purity Grade 1.21.5 Global Sodium Hydrosulfite Market Size and Forecast, By Form 1.21.6 Powder 1.21.7 Liquid 1.21.8 Global Sodium Hydrosulfite Market Size and Forecast, By Production Process 1.21.9 Zinc Process 1.21.10 Sodium Formate Process 1.21.11 Borol Process 1.21.12 Others 1.21.13 Global Sodium Hydrosulfite Market Size and Forecast, By Application 1.21.14 Textile Bleaching 1.21.15 Pulp and Paper Bleaching 1.21.16 Mineral Processing (Flotation) 1.21.17 Water Treatment 1.21.18 Leather Processing 1.21.19 Chemical Intermediates and Reducing Agent 1.21.20 Food Processing 1.21.21 Kaolin Clay Bleaching 1.21.22 Others 1.21.23 Global Sodium Hydrosulfite Market Size and Forecast, By End-Use Industry 1.21.24 Textile and Apparel 1.21.25 Pulp and Paper 1.21.26 Mining and Mineral Processing 1.21.27 Water and Wastewater Treatment 1.21.28 Leather and Tanning 1.21.29 Chemicals 1.21.30 Food and Beverage 1.21.31 Others 1.21.32 Global Sodium Hydrosulfite Market Size and Forecast, By Sales Channel 1.21.33 Direct Sales 1.21.34 Distributors and Traders 1.21.35 Online/B2B Procurement Platforms 1.21.36 (Note: Segment-wise market size estimates for all regions and countries will follow the same structure throughout the final report.) 2. COMPETITIVE INTELLIGENCE & SODIUM HYDROSULFITE ECOSYSTEM 2.1 Competitive Landscape 2.1.1 MMR Competition Matrix 2.1.2 Competitive Positioning of Leading Sodium Hydrosulfite System Vendors [Revenue and Market Share (%)] 2.1.3 Key Players Benchmarking 2.1.4 Company Name 2.1.5 Headquarters 2.1.6 Product Portfolio 2.1.7 Market Share (%) 2.1.8 R&D Investment 2.1.9 Financial analysis 2.1.10 Gross profit 2.1.11 Y-O-Y % 2.1.12 Network Strength 2.1.13 Geographic Presence 2.1.14 Market Structure 2.1.15 Market Leaders 2.1.16 Market Followers 2.1.17 Emerging Players 2.1.18 Mergers & Acquisitions Details 2.1.19 Recent Key Developments 2.1.20 Key Players 2.1.21 Yantai Jinhe Sodium Hydrosulfite Factory (Jinhe Group) 2.1.22 Guangdong Zhongcheng Chemicals Inc. 2.1.23 Guangdi Maoming Chemical Co., Ltd. 2.1.24 Hubei Yihua Chemical Industry Co., Ltd. 2.1.25 Shandong Aojin Chemical Technology Co., Ltd. 2.1.26 Jiangxi Hongan Chemical Co., Ltd. 2.1.27 Hubei Shuanghuan Science and Technology Co., Ltd. 2.1.28 Qinyang Vidon Chemical Co., Ltd. 2.1.29 Jinchangsheng Chemical 2.1.30 Transpek-Silox Industry Pvt. Ltd. 2.1.31 Gulshan Chemicals Pvt. Ltd. 2.1.32 TCP Limited 2.1.33 Demosha Chemicals Pty Ltd 2.1.34 Silox Group (Belgium) 2.1.35 Kanto Chemical Co. 2.1.36 Gulshan Chemicals Pvt. Ltd. 2.1.37 TCP Limited 2.1.38 Others 2.2 Company Market Share and Positioning Analysis 2.2.1 Global Revenue Market Share Comparison by Companies 2.2.2 Global Volume Market Share Analysis by Manufacturers 2.2.3 Regional Market Share Distribution Across Leading Players 2.2.4 Historical Market Share Performance Analysis, 2020–2025 2.2.5 Competitive Positioning Assessment Across Global Companies 2.2.6 Forecast Market Share Outlook Through 2034 2.3 Manufacturing Capacity and Facility Benchmarking 2.3.1 Global Manufacturing Capacity Comparison by Company 2.3.2 Production Facility Distribution Across Major Regions 2.3.3 Capacity Utilization Benchmark Among Leading Manufacturers 2.3.4 Planned Manufacturing Expansion Projects and Investments 2.3.5 Production Technology Benchmark Across Manufacturing Facilities 2.3.6 Capacity Development Strategy Assessment 2.4 Geographic Presence and Regional Expansion Analysis 2.4.1 Global Manufacturing Footprint Across Key Countries 2.4.2 Regional Sales Network and Market Coverage 2.4.3 Export Market Presence Across International Regions 2.4.4 Strategic Regional Expansion and Investment Assessment 2.4.5 Distribution Infrastructure Comparison Across Leading Companies 2.5 Pricing Strategy and Competitive Benchmark Analysis 2.5.1 Product Pricing Strategy Comparison Across Manufacturers 2.5.2 Premium and Value-Based Pricing Strategy Assessment 2.5.3 Regional Pricing Structure Comparative Analysis 2.5.4 Pricing Competitiveness Across Global End-Use Markets 2.5.5 Raw Material Cost Pass-Through Strategy Evaluation 2.6 Supply Chain and Procurement Strategy Analysis 2.6.1 Raw Material Sourcing Strategy Comparative Assessment 2.6.2 Supplier Network Strength and Diversification Analysis 2.6.3 Procurement Strategy Benchmark Across Leading Companies 2.6.4 Logistics and Distribution Network Performance Comparison 2.6.5 Inventory Management Strategy and Operational Efficiency 2.7 Research, Development and Innovation Analysis 2.7.1 Research and Development Investment Comparative Analysis 2.7.2 Product Innovation Strategy Across Leading Manufacturers 2.7.3 Manufacturing Process Innovation and Technology Development 2.7.4 Patent Portfolio Strength and Innovation Assessment 2.7.5 Sustainable Product Development Strategy Comparison 2.8 Strategic Developments and Corporate Initiatives Analysis 2.8.1 Merger and Acquisition Activity Comparative Assessment 2.8.2 Strategic Partnership and Collaboration Development Analysis 2.8.3 Capacity Expansion and Investment Initiative Comparison 2.8.4 New Product Launch Strategy and Performance 2.8.5 Business Diversification and Growth Strategy Assessment 2.8.6 Recent Corporate Developments Since 2023 Analysis 3. KEY INSIGHTS, STRATEGIC OUTLOOK & METHODOLOGICAL FRAMEWORK 3.1 Key Findings 3.2 Strategic Moves & Industry Outlook 3.3 Research Methodology

Custom Market Research Services

We Will Customise The Research For You, In Case The Report Listed Above Does Not Meet With Your Requirements