1. PEEK Market Introduction
1.1. Study Assumption and Market Definition
1.2. Scope of the Study
1.3. Executive Summary
2. Global PEEK Market: Competitive Landscape
2.1. MMR Competition Matrix
2.2. Key Players Benchmarking
2.2.1. Company Name
2.2.2. Headquarter
2.2.3. Product Offerings
2.2.4. End-user Segment
2.2.5. Grade Specialization
2.2.6. Customer Base
2.2.7. Supply Model
2.2.8. R&D Spend as % of Sales
2.2.9. Patents
2.2.10. Profit Margin (%)
2.2.11. Market Share (%) 2024
2.2.12. Revenue(Billion), 2024
2.2.13. Global Reach
2.3. Market Structure
2.3.1. Market Leaders
2.3.2. Market Followers
2.3.3. Emerging Players
2.4. Mergers and Acquisitions Details
2.5. Market Share & Competitive Concentration Analysis
2.5.1. Global Market Share Distribution by Top Manufacturers (Value % & Volume %)
2.5.2. CR3, CR5, and HHI Concentration Index Across Key Regions
2.5.3. Share Analysis by Product Category (Standard vs Nuclear-Grade, High-Temp vs Radiation-Resistant)
2.5.4. Market Share Shifts (2019–2024) and Forecast Competitive Movements (2025–2032)
2.5.5. OEM vs Tier-2 Supplier Share Comparison in Nuclear Cable Assemblies
2.5.6. Installed Base Share: Reactor-Type Adoption (PWR, BWR, PHWR, SMR)
2.5.7. Competitive Strength Mapping: Cost Leadership vs Technology Leadership
2.6. Product Portfolio & Grade Positioning Benchmark
2.6.1. Portfolio Breadth Index: Product Lines vs Resin Grades (PEEK, XLPE, EPR, Silicone, Composite Blends)
2.6.2. Performance Positioning Grid: Thermal, Radiation, Chemical & Mechanical Resistance Scores
2.6.3. Grade Availability Benchmark: Qualification Level (IEEE 383, IEC 60502, RCC-E Class 1E)
2.6.4. Specialized vs Generic Grade Mix: Share of Proprietary Formulations
3. PEEK Market: Dynamics
3.1. Market Trends
3.2. Market Dynamics
3.2.1. Drivers
3.2.2. Restraints
3.2.3. Opportunities
3.2.4. Challenges
3.3. PORTER’s Five Forces Analysis
3.4. PESTLE Analysis
3.5. Key Opinion Leader Analysis for the PEEK Industry
3.6. Government Schemes and Initiatives for PEEK Industry
3.7. Regulatory Landscape by region
4. Material Performance & Technical Assessment
4.1. Thermal stability analysis of PEEK grades vs. high-temperature cable requirements in nuclear power plants
4.2. Radiation resistance benchmarking of unfilled vs. filled PEEK materials under nuclear exposure
4.3. Mechanical strength and creep resistance assessment across cable insulation and sheathing applications
4.4. Comparative analysis of PEEK vs. XLPE, PTFE, and EPR in nuclear cable durability
4.5. Fire resistance, smoke emission, and halogen-free performance metrics for nuclear-certified PEEK cables
4.6. Influence of filler type (GF, CF) on dielectric strength and cable integrity in high-stress reactor environments
4.7. Long-term ageing, hydrolysis resistance, and insulation life-cycle evaluation in nuclear stations
5. Supply Chain, Raw Material Dynamics & Processing Economics
5.1. Price trends and volatility analysis for PEEK resin, CF, GF, and high-performance composites
5.2. Supply chain mapping for nuclear-grade cable manufacturers using PEEK compounds
5.3. Impact of polymerization capacity, precursor availability, and additive sourcing on production cost
5.4. Processing challenges: extrusion, irradiation testing, and cross-section uniformity for nuclear cable insulation
5.5. Cost structure breakdown: compound cost, cable processing, testing/certification, QC, and logistics
5.6. Lead-time analysis for supplying nuclear-certified PEEK cables
6. Standards, Certification & Regulatory Compliance Analysis
6.1. Mapping of nuclear cable standards (IEEE 383, IEC 60780, IEC 60502, RCC-E, KEPIC) to PEEK performance parameters
6.2. Qualification testing requirements: LOCA simulation, thermal ageing, radiation ageing, and mechanical testing
6.3. Fire safety and halogen-free compliance benchmarking across regions (UL 94 V-0, EN 45545, etc.)
6.4. Comparison of regulatory requirements between the US NRC, European utilities, and Asian nuclear authorities
6.5. Supplier audit and approval process for nuclear power cable procurement
6.6. Environmental compliance: REACH, RoHS, PFAS restrictions, and implications for PEEK formulations
7. Technology & Innovation Roadmap
7.1. Innovations in composite PEEK formulations (high CF loadings, hybrid fillers) for superior radiation tolerance
7.2. Advances in cable insulation extrusion technologies and precision sheathing for nuclear systems
7.3. Development of self-diagnostic and sensor-integrated PEEK cables for real-time monitoring
7.4. Material innovations improving dielectric strength for medium-voltage nuclear cables
7.5. Digitization of cable qualification testing using AI-based failure prediction
7.6. Future materials roadmap: ultra-low emission PEEK, fluorine-free flame retardant grades
7.7. Expected timeline for adoption of advanced PEEK cables in new nuclear build programs
8. Pricing, Cost Modeling & Commercial Viability
8.1. PEEK resin pricing trends and premium analysis vs. fluoropolymers
8.2. Cost differentiation: nuclear-grade PEEK cables vs. industrial-grade cables
8.3. TCO (Total Cost of Ownership) comparison over 40-60 years of plant lifecycle
8.4. Impact of certification, testing, and QA on final cable pricing
8.5. Regional price variation driven by regulatory demands and utility specifications
8.6. Margin structure analysis for cable manufacturers supplying nuclear plants
8.7. Pricing sensitivity analysis under resin supply constraints
9. Procurement, Vendor Assessment & Risk Analysis
9.1. Qualification criteria for nuclear cable suppliers (material traceability, QC, plant audits)
9.2. Vendor capability assessment: insulation uniformity, MV cable capability, radiation testing facilities
9.3. Risk analysis: single-source resin suppliers, geopolitical impact on supply chain, certification bottlenecks
9.4. Nuclear utility purchasing behavior and decision frameworks
9.5. Vendor benchmarking: delivery reliability, defect rates, certification success rate
9.6. Contracting models: long-term supply agreements vs. project-based procurement
9.7. Supplier risk mitigation strategies for nuclear-grade PEEK cables
10. End-Use Functionality & System-Level Integration Analysis
10.1. Application mapping of PEEK cables across reactor zones: containment, control room, auxiliary buildings
10.2. Compatibility assessment with switchgear, sensors, actuators, and instrumentation systems
10.3. Cable routing challenges in reactor interiors requiring high-flex, high-durability polymers
10.4. Interface testing with connectors, terminations, and shielding materials
10.5. Performance analysis under electromagnetic interference typical in nuclear power systems
10.6. Effects of cable bundling on heat dissipation and insulation performance
10.7. System redundancy requirements and how PEEK cables support safety-class circuits
11. Trade, Import–Export & Regulatory Trade Restrictions
11.1. Import–export flow analysis for nuclear-grade PEEK resins and cable products
11.2. Identification of countries with export controls for nuclear-related polymer technologies
11.3. Tariff analysis for high-performance polymers and composite cable products
11.4. Logistics constraints for dangerous goods shipping (specialized cable coatings, testing chemicals)
11.5. Compliance with nuclear dual-use regulations (NSG guidelines, EAR regulations)
11.6. Regional supply dependence for fillers (Japan – CF; EU – GF; China – PEEK resin)
11.7. Impact of geopolitical tensions on nuclear cable supply chains
12. Installed Base, Replacement Cycles & Refurbishment Opportunity
12.1. Global installed base of nuclear reactors using legacy polymer cables (age profile by region)
12.2. Replacement cycle analysis based on insulation ageing and radiation exposure history
12.3. Identification of high-priority reactor types with fastest refurbishment demand (CANDU, VVER, PWR)
12.4. Trends in life-extension programs (>40-year to 60-year operation) driving PEEK cable upgrades
12.5. Insights from past incidents of cable ageing failures and regulatory push for replacements
12.6. Quantification of cable length used per reactor type (safety circuits, I&C systems, MV/LV power)
12.7. Mapping upcoming refurbishments and new builds requiring PEEK cables
13. Customer Behavior, Procurement Patterns & Utility Decision Logic
13.1. Nuclear utility selection criteria: life-cycle cost, certification record, failure rate, radiation stability
13.2. Buying behavior differences between state-owned and private nuclear utilities
13.3. Influence of EPC contractors, reactor OEMs, and safety regulators on cable selection
13.4. Pain points of utilities: certification delays, long lead times, limited qualified suppliers
13.5. Preferred vendor models: long-term strategic supply vs. batch procurement
13.6. Procurement risk aversion and reliance on proven materials like PEEK
13.7. Decision matrix: how utilities compare PEEK cables vs. fluoropolymer alternatives
14. Sustainability & Environmental Impact Assessment
14.1. Life-cycle environmental impact of PEEK vs. fluoropolymers (PTFE, FEP) and PVC used in nuclear cables
14.2. Carbon footprint analysis of PEEK resin production, filler processing, and cable extrusion (cradle-to-gate)
14.3. End-of-life handling: recyclability challenges of GF/CF-filled PEEK and opportunities for mechanical recovery
14.4. Environmental benefits of long-life PEEK cables due to reduced replacement frequency in nuclear plants
14.5. Assessment of halogen-free, low-smoke behavior and reduced toxic emissions in fire events
14.6. Regulatory pressures (EU Green Deal, REACH, PFAS phase-outs) influencing shift toward PEEK in critical applications
14.7. Comparative sustainability score: PEEK cables vs. XLPE/EPR-based nuclear cables over a 60-year reactor lifecycle
15. Investment Feasibility & Business Case Evaluation
15.1. CAPEX assessment for establishing PEEK cable manufacturing (extrusion lines, testing labs, radiation chambers)
15.2. ROI analysis based on nuclear refurbishment cycles, new SMR deployments, and long-term supply contracts
15.3. Profitability comparison of nuclear-grade PEEK cables vs. standard industrial cables (margin premium + certification cost)
15.4. Payback period modelling under multiple production scales (5 kt, 10 kt, 20 kt PEEK compound capacity)
15.5. Risk–return analysis considering resin price volatility, regulatory barriers, and supplier qualification timelines
15.6. Sensitivity analysis: effect of PEEK resin prices, certification delays, and filler cost fluctuations on overall viability
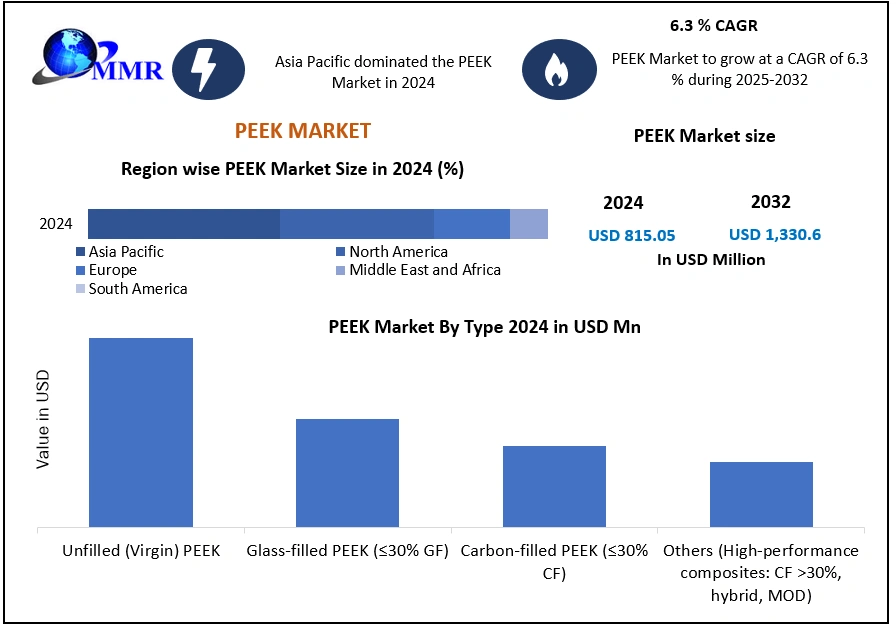
16. PEEK Market: Global Market Size and Forecast by Segmentation (by Value in USD Million & Volume in Kilotons) (2024-2032)
16.1. PEEK Market Size and Forecast, By Type
16.1.1. Unfilled (Virgin) PEEK
16.1.2. Glass-filled PEEK (≤30 % GF)
16.1.3. Carbon-filled PEEK (≤30 % CF)
16.1.4. Others (High-performance Composites (CF > 30 %, hybrid, MOD))
16.2. PEEK Market Size and Forecast, By Application
16.2.1. Electrical & Electronics
16.2.2. Aerospace
16.2.3. Automotive
16.2.4. Oil & Gas
16.2.5. Healthcare
16.2.6. Energy & Power (Including Nuclear Power Stations)
16.2.7. Industrial and Machinery
16.2.8. Others
16.3. PEEK Market Size and Forecast, By Region
16.3.1. North America
16.3.2. Europe
16.3.3. Asia Pacific
16.3.4. Middle East and Africa
16.3.5. South America
17. North America PEEK Market Size and Forecast by Segmentation (by Value in USD Million & Volume in Kilotons) (2024-2032)
17.1. North America PEEK Market Size and Forecast, By Type
17.1.1. Unfilled (Virgin) PEEK
17.1.2. Glass-filled PEEK (≤30 % GF)
17.1.3. Carbon-filled PEEK (≤30 % CF)
17.1.4. Others (High-performance Composites (CF > 30 %, hybrid, MOD))
17.2. North America PEEK Market Size and Forecast, By Application
17.2.1. Electrical & Electronics
17.2.2. Aerospace
17.2.3. Automotive
17.2.4. Oil & Gas
17.2.5. Healthcare
17.2.6. Energy & Power (Including Nuclear Power Stations)
17.2.7. Industrial and Machinery
17.2.8. Others
17.3. North America PEEK Market Size and Forecast, by Country
17.3.1. United States
17.3.2. Canada
17.3.3. Mexico
18. Europe PEEK Market Size and Forecast by Segmentation (by Value in USD Million & Volume in Kilotons) (2024-2032)
18.1. Europe PEEK Market Size and Forecast, By Type
18.2. Europe PEEK Market Size and Forecast, By Application
18.3. Europe PEEK Market Size and Forecast, by Country
18.3.1. United Kingdom
18.3.2. France
18.3.3. Germany
18.3.4. Ukraine
18.3.5. Spain
18.3.6. Sweden
18.3.7. Russia
18.3.8. Rest of Europe
19. Asia Pacific PEEK Market Size and Forecast by Segmentation (by Value in USD Million & Volume in Kilotons) (2024-2032)
19.1. Asia Pacific PEEK Market Size and Forecast, By Type
19.2. Asia Pacific PEEK Market Size and Forecast, By Application
19.3. Asia Pacific PEEK Market Size and Forecast, by Country
19.3.1. China
19.3.2. S. Korea
19.3.3. India
19.3.4. Japan
19.3.5. Australia
19.3.6. Indonesia
19.3.7. Philippines
19.3.8. Malaysia
19.3.9. Vietnam
19.3.10. Thailand
19.3.11. Rest of Asia Pacific
20. Middle East and Africa PEEK Market Size and Forecast by Segmentation (by Value in USD Million & Volume in Kilotons) (2024-2032)
20.1. Middle East and Africa PEEK Market Size and Forecast, By Type
20.2. Middle East and Africa PEEK Market Size and Forecast, By Application
20.3. Middle East and Africa PEEK Market Size and Forecast, by Country
20.3.1. South Africa
20.3.2. GCC
20.3.3. Egypt
20.3.4. Nigeria
20.3.5. Rest of ME&A
21. South America PEEK Market Size and Forecast by Segmentation (by Value in USD Million & Volume in Kilotons) (2024-2032)
21.1. South America PEEK Market Size and Forecast, By Type
21.2. South America PEEK Market Size and Forecast, By Application
21.3. South America PEEK Market Size and Forecast, by Country
21.3.1. Brazil
21.3.2. Argentina
21.3.3. Chile
21.3.4. Colombia
21.3.5. Rest of South America
22. Company Profile: Key Players
22.1. Victrex PLC
22.1.1. Company Overview
22.1.2. Business Portfolio
22.1.3. Financial Overview
22.1.4. SWOT Analysis
22.1.5. Strategic Analysis
22.1.6. Recent Developments
22.2. Solvay S.A.
22.3. Evonik Industries AG
22.4. Celanese Corporation
22.5. SABIC (Saudi Basic Industries Corporation)
22.6. Mitsubishi Chemical Corporation
22.7. Mitsubishi Chemical Advanced Materials AG
22.8. Arkema Group
22.9. Ensinger GmbH
22.10. Röchling
22.11. LATI Industria Termoplastici S.p.A.
22.12. Kingfa Sci. & Tech. Co., Ltd.
22.13. PolyOne Corporation (now Avient Corporation)
22.14. BARLOG Plastics GmbH
22.15. Quadrant EPP Surlon India Ltd
22.16. Polyplastics–Evonik Corporation
22.17. Zyex Ltd
22.18. Darter Plastics Inc.
22.19. Stern Industries Inc.
22.20. Jrlon Inc.
22.21. Prototype & Plastic Mold Co. Inc.
22.22. Gharda Chemicals Ltd.
22.23. Shandong Haoran Special Plastic Co., Ltd.
22.24. Panjin Zhongrun High-Performance Polymers Co., Ltd.
22.25. Zhejiang Pengfulong Technology Co., Ltd.
22.26. Zibo Bainaisi Chemical Co., Ltd.
22.27. Jilin Joinature Polymer Co., Ltd.
22.28. J. K. Overseas
22.29. Caledonian Ferguson Timpson Ltd
22.30. A. Schulman Inc.
23. Key Findings
24. Industry Recommendation
25. PEEK Market: Research Methodology

 To know about the Research Methodology :- Request Free Sample Report