
Natural Source Vitamin E Market – Industry Structure Evaluation, Demand Drivers Analysis, Regional Growth Analysis and Identification, Competitive Positioning Review & Global Market Size Forecast to 2032
Overview
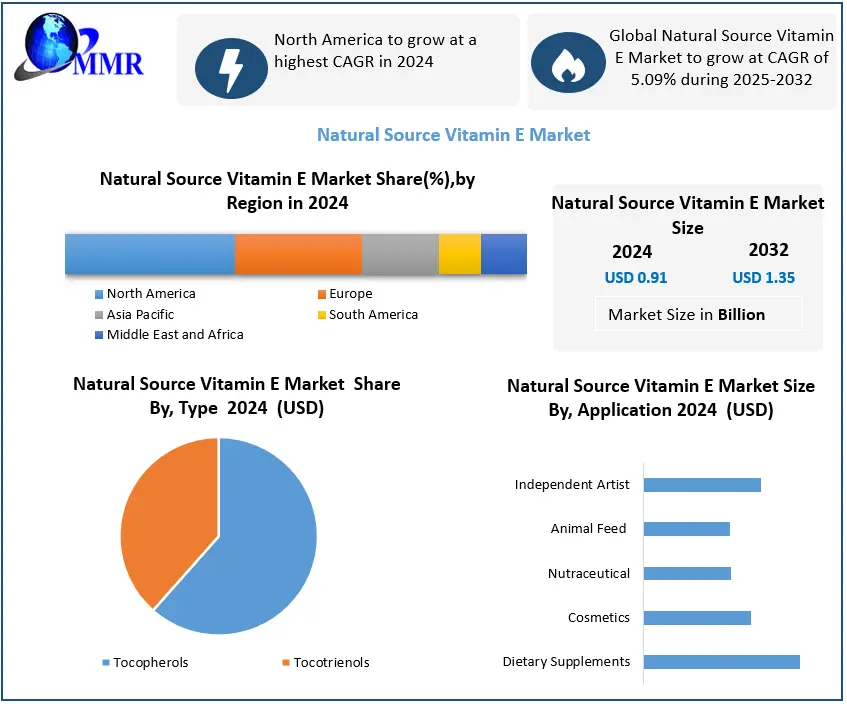
Natural Source Vitamin E Market was valued at USD 0.91 Bn. in 2024 and the total Global Natural Source Vitamin E Market revenue is Expected to grow at a CAGR of 5.09% from 2025 to 2032 reaching nearly USD 1.35 Bn. by 2032.
Natural Source Vitamin E Market Overview:
Natural source vitamin E is an energetic nutrient for health and is a combination of the fat-soluble vitamins which occur naturally in eight different forms, containing four tocopherols (alpha, beta, gamma, and delta) and four tocotrienols. Alpha-tocopherol is the most common and most potent form of the vitamin. Natural vitamin E is generally found in a variety of foods, like green vegetables, nuts, oils, wheat, etc. Also, sunflower seeds, shellfish, almonds, sweet red peppers, olive oil, mangoes, fresh fish, etc. are another more source of vitamin E. Natural vitamin E works as an antioxidant as it shelters human body muscles from any damage, helps to protect from viral infections and germs. The report study has analyzed the revenue impact of COVID -19 pandemic on the sales revenue of market leaders, market followers and market disrupters in the report and same is reflected in our analysis.
 To know about the Research Methodology:- Request Free Sample Report
Several government initiatives are being taken, to increase the consumption of fortified food & beverages, mainly in emerging countries, such as China and India. For instance, the promotion of fortified foods by China’s Ministry of Health, together with growing health concerns related to age, myopia in adults, and other diseases, is expected to drive the market. The top six companies account for around 60% market share. ADM, DSM and Zhejiang Medicine are the key player in the industry.
Natural Source Vitamin E Market Dynamics:
An increasing number of patients with vitamin E deficiency, mainly in the aged population, is a key factor expected to drive the growth of the global natural source vitamin E market. Moreover, daily consumption of natural-source vitamin E helps in prevents from hair loss, improves strength of the eyes, helps to balance hormones, balances cholesterol levels in the body, helps to prevent cancer, heart diseases and disorders, Alzheimer's disease, diabetes, liver-related problems, helps cure from cells infections, and helps to avoid or overcome other skin-related issues. The above-mentioned are other major factors expected to drive the growth of the global natural source vitamin E market to a significant extent. Furthermore, the high adoption of natural-source vitamin E in applications like functional dairy products, dietary supplements, food & beverages, etc. In addition, the increasing consciousness about multiple benefits offered by natural vitamin E products is expected to make worthwhile growth opportunities for the market in the forecast period.
On the other hand, overconsumption of natural vitamin E might have potential side effects, for example, headache, rashes, vomiting, and hormonal imbalance are some of the main factors that could restrain the growth of the global natural source vitamin E market.
Natural Source Vitamin E Market Segment Analysis:
Based on Type Natural Source Vitamin E Market segmented into Tocopherols and Tocotrienols. Tocopherol segment dominated the market in 2024 and is expected to hold largest share during the forecast period. Dominance due to Tocopherols are widely used in dietary supplements, functional foods, pharmaceuticals, and cosmetics due to their strong antioxidant properties and established safety profile. They are more abundant, cost-effective, and versatile compared to tocotrienols, making them the preferred choice for large-scale applications. Their extensive adoption across industries ensures Tocopherols maintain the largest market share during the forecast period.
Based on Application the market is segmented into Dietary Supplements, Cosmetics, Nutraceutical and Animal Feed. Dietary Supplement segment dominated the market in 2024 and is expected to hold largest share during the forecast period. Dominance due to Rising consumer awareness about preventive healthcare, immunity boosting, and lifestyle-related disorders has driven strong demand for vitamin E supplements. Tocopherols are widely used in capsules, tablets, and soft gels due to their antioxidant and health benefits. Their established role in supporting skin, cardiovascular, and immune health ensures dietary supplements remain the leading application segment.
Natural Source Vitamin E Market Recent Development:
In China on Jan 2019, a company collaboration was declared between DSM and Nenter & Co. Inc.
In Dec 2018, Pfizer Inc. and GlaxoSmithKline PLC entered into an agreement to generate a leading global consumer healthcare company.
The objective of the report is to present a comprehensive analysis of the GlobalMarket including all the stakeholders of the industry. The past and current status of the industry with forecasted market size and trends are presented in the report with the analysis of complicated data in simple language. The report covers all the aspects of the industry with a dedicated study of key players that includes market leaders, followers and new entrants by Region.
PORTER, SVOR, PESTEL analysis with the potential impact of micro-economic factors by Region on the market have been presented in the report. External as well as internal factors that are supposed to affect the business positively or negatively have been analyzed, which will give a clear futuristic view of the industry to the decision-makers.
The report also helps in understanding Global Market dynamics, structure by analyzing the market segments and project the Global Natural Source Vitamin E Market size. Clear representation of competitive analysis of key players by Type, price, financial position, Product portfolio, growth strategies, and regional presence in the Global Market make the report investor’s guide.
Natural Source Vitamin E Market Scope: Inquire before buying
| Global Natural Source Vitamin E Market | |||
|---|---|---|---|
| Report Coverage | Details | ||
| Base Year: | 2024 | Forecast Period: | 2025-2032 |
| Historical Data: | 2019 to 2024 | Market Size in 2024: | USD 0.91 Bn. |
| Forecast Period 2025 to 2032 CAGR: | 5.09% | Market Size in 2032: | USD 1.35 Bn. |
| Segments Covered: | by Type | Tocopherols Tocotrienols |
|
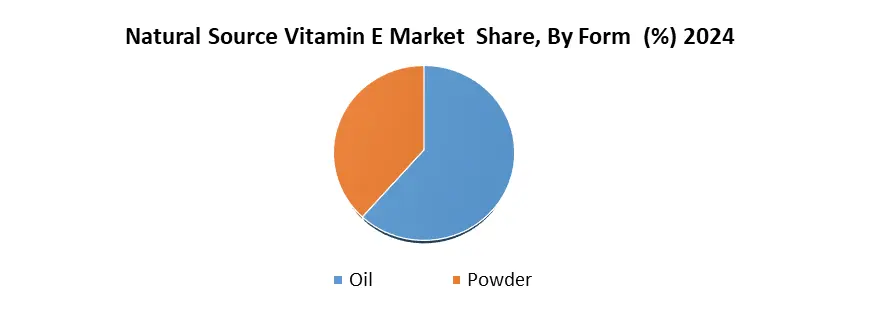
| by Form | Oil Powder |
||
| by Application | Dietary Supplements Cosmetics Nutraceutical Animal Feed |
||
| by Distribution Channel | Online Offline |
||
| by End Use | Individual Users Commercial Users |
||
Natural Source Vitamin E Market,by Region
North America (United States, Canada, and Mexico)
Europe (UK, France, Germany, Italy, Spain, Sweden, Austria, and the Rest of Europe)
Asia Pacific (China, South Korea, Japan, India, Australia, ASEAN, Indonesia, Philippines, Malaysia, Vietnam, Thailand, ASEAN, Rest of Asia Pacific)
Middle East & Africa (South Africa, GCC, Nigeria, Rest of ME&A)
South America (Brazil, Argentina, Rest of South America)
Natural Source Vitamin E Market, Key Players
1.BASF SE
2.Archer Daniels Midlands Company
3.Wilmar Spring Fruit Nutrition Products Co. Ltd.
4.Beijing Gingko Group
5.Davos Life Science
6.Eisai Food and Chemical
7.Fenchem Biotek
8.Riken Vitamin Co. Ltd.
9.Zhejiang Worldbestve Biotechnology Co., Ltd.
10.Koninklijke Dsm N.V
11.Brenntag AG
12.Merck KGaA (Sigma Aldrich)
13.Excel Vite, Inc.
14.Parachem Fine & Specialty Chemicals
15.Kuala Lumpur Kepong Berhad (Davos Life Science)
16.Nature's Bounty Co.
17.Healthful International Co., Ltd. (HSF)
18.Amway Corporation
19.Puritan's Pride
20.Organic Technologies
21.Herbalife International of America, Inc.
22.Matrix Fine Sciences Pvt. Ltd.
23.Xi'an Healthful Biotechnology Co. Ltd.
24.Now Foods
25.Elementa Food Ingredients
Frequently Asked Questions:
1. Which region has the largest share in Global Market?
Ans: North America region held the highest share in 2024.
2. What is the growth rate of Global Market?
Ans: The Global Market is growing at a CAGR of 5.9% during forecasting period 2025-2032.
3. What is scope of the Global Natural Source Vitamin E Market report?
Ans: Global Natural Source Vitamin E Market report helps with the PESTEL, PORTER, COVID-19 Impact analysis, Recommendations for Investors & Leaders, and market estimation of the forecast period.
4. Who are the key players in Global Market?
Ans: The important key players in the Global Market are – BASF SE, Archer Daniels Midlands Company, Wilmar Spring Fruit Nutrition Products Co. Ltd., Beijing Gingko Group, Davos Life Science, Eisai Food and Chemical, Fenchem Biotek, Riken Vitamin Co. Ltd., Zhejiang Worldbestve Biotechnology Co., Ltd., Koninklijke Dsm N.V, Brenntag AG, Merck KGaA (Sigma Aldrich), Excel Vite, Inc., Parachem Fine & Specialty Chemicals, Kuala Lumpur Kepong Berhad (Davos Life Science), Nature's Bounty Co., Healthful International Co., Ltd. (HSF), Amway Corporation, Puritan's Pride, and Organic Technologies
5. What is the study period of this Market?
Ans: The Global Market is studied from 2025 to 2032.