1. Live Cell Imaging Market Introduction
1.1. Study Assumption and Market Definition
1.2. Scope of the Study
1.3. Executive Summary
2. Global Live Cell Imaging Market: Competitive Landscape
2.1. MMR Competition Matrix
2.2. Competitive Landscape
2.3. Key Players Benchmarking
2.3.1. Company Name
2.3.2. Business Segment
2.3.3. End-user Segment
2.3.4. Revenue (2025)
2.3.5. Company Locations
2.4. Leading Live Cell Imaging Market Companies, by market capitalization
2.5. Market Structure
2.5.1. Market Leaders
2.5.2. Market Followers
2.5.3. Emerging Players
2.6. Mergers and Acquisitions Details
3. Live Cell Imaging Market: Dynamics
3.1. Live Cell Imaging Market Trends by Region
3.1.1. North America Live Cell Imaging Market Trends
3.1.2. Europe Live Cell Imaging Market Trends
3.1.3. Asia Pacific Live Cell Imaging Market Trends
3.1.4. Middle East and Africa Live Cell Imaging Market Trends
3.1.5. South America Live Cell Imaging Market Trends
3.2. Live Cell Imaging Market Dynamics by Region
3.2.1. North America
3.2.1.1. North America Live Cell Imaging Market Drivers
3.2.1.2. North America Live Cell Imaging Market Restraints
3.2.1.3. North America Live Cell Imaging Market Opportunities
3.2.1.4. North America Live Cell Imaging Market Challenges
3.2.2. Europe
3.2.2.1. Europe Live Cell Imaging Market Drivers
3.2.2.2. Europe Live Cell Imaging Market Restraints
3.2.2.3. Europe Live Cell Imaging Market Opportunities
3.2.2.4. Europe Live Cell Imaging Market Challenges
3.2.3. Asia Pacific
3.2.3.1. Asia Pacific Live Cell Imaging Market Drivers
3.2.3.2. Asia Pacific Live Cell Imaging Market Restraints
3.2.3.3. Asia Pacific Live Cell Imaging Market Opportunities
3.2.3.4. Asia Pacific Live Cell Imaging Market Challenges
3.2.4. Middle East and Africa
3.2.4.1. Middle East and Africa Live Cell Imaging Market Drivers
3.2.4.2. Middle East and Africa Live Cell Imaging Market Restraints
3.2.4.3. Middle East and Africa Live Cell Imaging Market Opportunities
3.2.4.4. Middle East and Africa Live Cell Imaging Market Challenges
3.2.5. South America
3.2.5.1. South America Live Cell Imaging Market Drivers
3.2.5.2. South America Live Cell Imaging Market Restraints
3.2.5.3. South America Live Cell Imaging Market Opportunities
3.2.5.4. South America Live Cell Imaging Market Challenges
3.3. PORTER's Five Forces Analysis
3.4. PESTLE Analysis
3.5. Technology Roadmap
3.6. Regulatory Landscape by Region
3.6.1. North America
3.6.2. Europe
3.6.3. Asia Pacific
3.6.4. Middle East and Africa
3.6.5. South America
3.7. Key Opinion Leader Analysis For Live Cell Imaging Industry
3.8. Analysis of Government Schemes and Initiatives For Live Cell Imaging Industry
3.9. Live Cell Imaging Market Trade Analysis
3.10. The Global Pandemic Impact on Live Cell Imaging Market
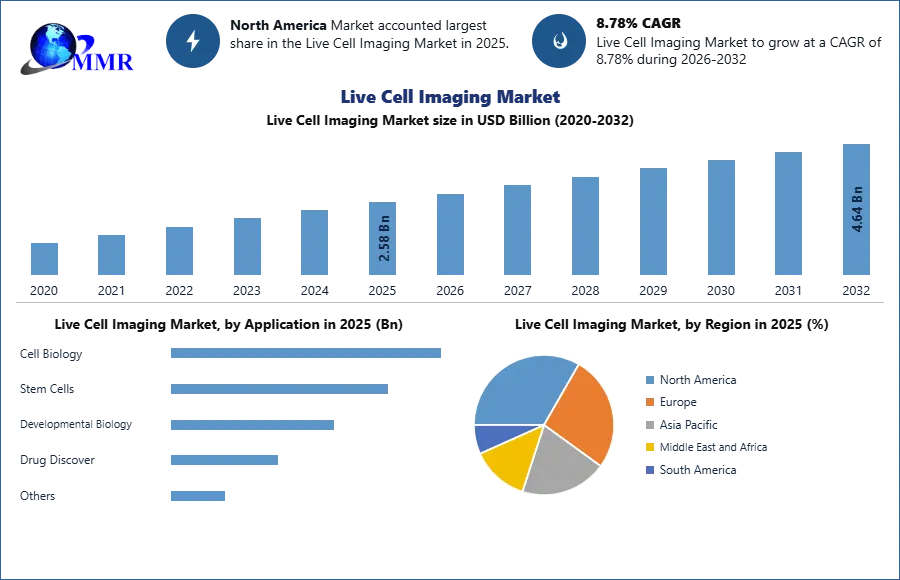
4. Live Cell Imaging Market: Global Market Size and Forecast by Segmentation (in USD Billion) 2025-2032
4.1. Live Cell Imaging Market Size and Forecast, by Product & Service (2025-2032)
4.1.1. Instruments
4.1.2. Consumables
4.1.3. Software
4.1.4. Services
4.2. Live Cell Imaging Market Size and Forecast, by Cell Type (2025-2032)
4.2.1. Mammalian Cells
4.2.2. Microbial Cells
4.2.3. Plant Cells
4.3. Live Cell Imaging Market Size and Forecast, by Application (2025-2032)
4.3.1. Cell Biology
4.3.2. Stem Cells
4.3.3. Developmental Biology
4.3.4. Drug Discover
4.3.5. Others
4.4. Live Cell Imaging Market Size and Forecast, by End User (2025-2032)
4.4.1. Pharmaceutical & Biotechnology Companies
4.4.2. Academic & Research Institutes
4.4.3. Contract Research Organizations
4.4.4. Others
4.5. Live Cell Imaging Market Size and Forecast, by Region (2025-2032)
4.5.1. North America
4.5.2. Europe
4.5.3. Asia Pacific
4.5.4. Middle East and Africa
4.5.5. South America
5. North America Live Cell Imaging Market Size and Forecast by Segmentation (in USD Billion) 2025-2032
5.1. North America Live Cell Imaging Market Size and Forecast, by Product & Service (2025-2032)
5.1.1. Instruments
5.1.2. Consumables
5.1.3. Software
5.1.4. Services
5.2. North America Live Cell Imaging Market Size and Forecast, by Cell Type (2025-2032)
5.2.1. Mammalian Cells
5.2.2. Microbial Cells
5.2.3. Plant Cells
5.3. North America Live Cell Imaging Market Size and Forecast, by Application (2025-2032)
5.3.1. Cell Biology
5.3.2. Stem Cells
5.3.3. Developmental Biology
5.3.4. Drug Discover
5.3.5. Others
5.4. North America Live Cell Imaging Market Size and Forecast, by End User (2025-2032)
5.4.1. Pharmaceutical & Biotechnology Companies
5.4.2. Academic & Research Institutes
5.4.3. Contract Research Organizations
5.4.4. Others
5.5. North America Live Cell Imaging Market Size and Forecast, by Country (2025-2032)
5.5.1. United States
5.5.1.1. United States Live Cell Imaging Market Size and Forecast, by Product & Service (2025-2032)
5.5.1.1.1. Instruments
5.5.1.1.2. Consumables
5.5.1.1.3. Software
5.5.1.1.4. Services
5.5.1.2. United States Live Cell Imaging Market Size and Forecast, by Cell Type (2025-2032)
5.5.1.2.1. Mammalian Cells
5.5.1.2.2. Microbial Cells
5.5.1.2.3. Plant Cells
5.5.1.3. United States Live Cell Imaging Market Size and Forecast, by Application (2025-2032)
5.5.1.3.1. Cell Biology
5.5.1.3.2. Stem Cells
5.5.1.3.3. Developmental Biology
5.5.1.3.4. Drug Discover
5.5.1.3.5. Others
5.5.1.4. United States Live Cell Imaging Market Size and Forecast, by End User (2025-2032)
5.5.1.4.1. Pharmaceutical & Biotechnology Companies
5.5.1.4.2. Academic & Research Institutes
5.5.1.4.3. Contract Research Organizations
5.5.1.4.4. Others
5.5.2. Canada
5.5.2.1. Canada Live Cell Imaging Market Size and Forecast, by Product & Service (2025-2032)
5.5.2.1.1. Instruments
5.5.2.1.2. Consumables
5.5.2.1.3. Software
5.5.2.1.4. Services
5.5.2.2. Canada Live Cell Imaging Market Size and Forecast, by Cell Type (2025-2032)
5.5.2.2.1. Mammalian Cells
5.5.2.2.2. Microbial Cells
5.5.2.2.3. Plant Cells
5.5.2.3. Canada Live Cell Imaging Market Size and Forecast, by Application (2025-2032)
5.5.2.3.1. Cell Biology
5.5.2.3.2. Stem Cells
5.5.2.3.3. Developmental Biology
5.5.2.3.4. Drug Discover
5.5.2.3.5. Others
5.5.2.4. Canada Live Cell Imaging Market Size and Forecast, by End User (2025-2032)
5.5.2.4.1. Pharmaceutical & Biotechnology Companies
5.5.2.4.2. Academic & Research Institutes
5.5.2.4.3. Contract Research Organizations
5.5.2.4.4. Others
5.5.3. Mexico
5.5.3.1. Mexico Live Cell Imaging Market Size and Forecast, by Product & Service (2025-2032)
5.5.3.1.1. Instruments
5.5.3.1.2. Consumables
5.5.3.1.3. Software
5.5.3.1.4. Services
5.5.3.2. Mexico Live Cell Imaging Market Size and Forecast, by Cell Type (2025-2032)
5.5.3.2.1. Mammalian Cells
5.5.3.2.2. Microbial Cells
5.5.3.2.3. Plant Cells
5.5.3.3. Mexico Live Cell Imaging Market Size and Forecast, by Application (2025-2032)
5.5.3.3.1. Cell Biology
5.5.3.3.2. Stem Cells
5.5.3.3.3. Developmental Biology
5.5.3.3.4. Drug Discover
5.5.3.3.5. Others
5.5.3.4. Mexico Live Cell Imaging Market Size and Forecast, by End User (2025-2032)
5.5.3.4.1. Pharmaceutical & Biotechnology Companies
5.5.3.4.2. Academic & Research Institutes
5.5.3.4.3. Contract Research Organizations
5.5.3.4.4. Others
6. Europe Live Cell Imaging Market Size and Forecast by Segmentation (in USD Billion) 2025-2032
6.1. Europe Live Cell Imaging Market Size and Forecast, by Product & Service (2025-2032)
6.2. Europe Live Cell Imaging Market Size and Forecast, by Cell Type (2025-2032)
6.3. Europe Live Cell Imaging Market Size and Forecast, by Application (2025-2032)
6.4. Europe Live Cell Imaging Market Size and Forecast, by End User (2025-2032)
6.5. Europe Live Cell Imaging Market Size and Forecast, by Country (2025-2032)
6.5.1. United Kingdom
6.5.1.1. United Kingdom Live Cell Imaging Market Size and Forecast, by Product & Service (2025-2032)
6.5.1.2. United Kingdom Live Cell Imaging Market Size and Forecast, by Cell Type (2025-2032)
6.5.1.3. United Kingdom Live Cell Imaging Market Size and Forecast, by Application (2025-2032)
6.5.1.4. United Kingdom Live Cell Imaging Market Size and Forecast, by End User (2025-2032)
6.5.2. France
6.5.2.1. France Live Cell Imaging Market Size and Forecast, by Product & Service (2025-2032)
6.5.2.2. France Live Cell Imaging Market Size and Forecast, by Cell Type (2025-2032)
6.5.2.3. France Live Cell Imaging Market Size and Forecast, by Application (2025-2032)
6.5.2.4. France Live Cell Imaging Market Size and Forecast, by End User (2025-2032)
6.5.3. Germany
6.5.3.1. Germany Live Cell Imaging Market Size and Forecast, by Product & Service (2025-2032)
6.5.3.2. Germany Live Cell Imaging Market Size and Forecast, by Cell Type (2025-2032)
6.5.3.3. Germany Live Cell Imaging Market Size and Forecast, by Application (2025-2032)
6.5.3.4. Germany Live Cell Imaging Market Size and Forecast, by End User (2025-2032)
6.5.4. Italy
6.5.4.1. Italy Live Cell Imaging Market Size and Forecast, by Product & Service (2025-2032)
6.5.4.2. Italy Live Cell Imaging Market Size and Forecast, by Cell Type (2025-2032)
6.5.4.3. Italy Live Cell Imaging Market Size and Forecast, by Application (2025-2032)
6.5.4.4. Italy Live Cell Imaging Market Size and Forecast, by End User (2025-2032)
6.5.5. Spain
6.5.5.1. Spain Live Cell Imaging Market Size and Forecast, by Product & Service (2025-2032)
6.5.5.2. Spain Live Cell Imaging Market Size and Forecast, by Cell Type (2025-2032)
6.5.5.3. Spain Live Cell Imaging Market Size and Forecast, by Application (2025-2032)
6.5.5.4. Spain Live Cell Imaging Market Size and Forecast, by End User (2025-2032)
6.5.6. Sweden
6.5.6.1. Sweden Live Cell Imaging Market Size and Forecast, by Product & Service (2025-2032)
6.5.6.2. Sweden Live Cell Imaging Market Size and Forecast, by Cell Type (2025-2032)
6.5.6.3. Sweden Live Cell Imaging Market Size and Forecast, by Application (2025-2032)
6.5.6.4. Sweden Live Cell Imaging Market Size and Forecast, by End User (2025-2032)
6.5.7. Austria
6.5.7.1. Austria Live Cell Imaging Market Size and Forecast, by Product & Service (2025-2032)
6.5.7.2. Austria Live Cell Imaging Market Size and Forecast, by Cell Type (2025-2032)
6.5.7.3. Austria Live Cell Imaging Market Size and Forecast, by Application (2025-2032)
6.5.7.4. Austria Live Cell Imaging Market Size and Forecast, by End User (2025-2032)
6.5.8. Rest of Europe
6.5.8.1. Rest of Europe Live Cell Imaging Market Size and Forecast, by Product & Service (2025-2032)
6.5.8.2. Rest of Europe Live Cell Imaging Market Size and Forecast, by Cell Type (2025-2032)
6.5.8.3. Rest of Europe Live Cell Imaging Market Size and Forecast, by Application (2025-2032)
6.5.8.4. Rest of Europe Live Cell Imaging Market Size and Forecast, by End User (2025-2032)
7. Asia Pacific Live Cell Imaging Market Size and Forecast by Segmentation (in USD Billion) 2025-2032
7.1. Asia Pacific Live Cell Imaging Market Size and Forecast, by Product & Service (2025-2032)
7.2. Asia Pacific Live Cell Imaging Market Size and Forecast, by Cell Type (2025-2032)
7.3. Asia Pacific Live Cell Imaging Market Size and Forecast, by Application (2025-2032)
7.4. Asia Pacific Live Cell Imaging Market Size and Forecast, by End User (2025-2032)
7.5. Asia Pacific Live Cell Imaging Market Size and Forecast, by Country (2025-2032)
7.5.1. China
7.5.1.1. China Live Cell Imaging Market Size and Forecast, by Product & Service (2025-2032)
7.5.1.2. China Live Cell Imaging Market Size and Forecast, by Cell Type (2025-2032)
7.5.1.3. China Live Cell Imaging Market Size and Forecast, by Application (2025-2032)
7.5.1.4. China Live Cell Imaging Market Size and Forecast, by End User (2025-2032)
7.5.2. S Korea
7.5.2.1. S Korea Live Cell Imaging Market Size and Forecast, by Product & Service (2025-2032)
7.5.2.2. S Korea Live Cell Imaging Market Size and Forecast, by Cell Type (2025-2032)
7.5.2.3. S Korea Live Cell Imaging Market Size and Forecast, by Application (2025-2032)
7.5.2.4. S Korea Live Cell Imaging Market Size and Forecast, by End User (2025-2032)
7.5.3. Japan
7.5.3.1. Japan Live Cell Imaging Market Size and Forecast, by Product & Service (2025-2032)
7.5.3.2. Japan Live Cell Imaging Market Size and Forecast, by Cell Type (2025-2032)
7.5.3.3. Japan Live Cell Imaging Market Size and Forecast, by Application (2025-2032)
7.5.3.4. Japan Live Cell Imaging Market Size and Forecast, by End User (2025-2032)
7.5.4. India
7.5.4.1. India Live Cell Imaging Market Size and Forecast, by Product & Service (2025-2032)
7.5.4.2. India Live Cell Imaging Market Size and Forecast, by Cell Type (2025-2032)
7.5.4.3. India Live Cell Imaging Market Size and Forecast, by Application (2025-2032)
7.5.4.4. India Live Cell Imaging Market Size and Forecast, by End User (2025-2032)
7.5.5. Australia
7.5.5.1. Australia Live Cell Imaging Market Size and Forecast, by Product & Service (2025-2032)
7.5.5.2. Australia Live Cell Imaging Market Size and Forecast, by Cell Type (2025-2032)
7.5.5.3. Australia Live Cell Imaging Market Size and Forecast, by Application (2025-2032)
7.5.5.4. Australia Live Cell Imaging Market Size and Forecast, by End User (2025-2032)
7.5.6. Indonesia
7.5.6.1. Indonesia Live Cell Imaging Market Size and Forecast, by Product & Service (2025-2032)
7.5.6.2. Indonesia Live Cell Imaging Market Size and Forecast, by Cell Type (2025-2032)
7.5.6.3. Indonesia Live Cell Imaging Market Size and Forecast, by Application (2025-2032)
7.5.6.4. Indonesia Live Cell Imaging Market Size and Forecast, by End User (2025-2032)
7.5.7. Malaysia
7.5.7.1. Malaysia Live Cell Imaging Market Size and Forecast, by Product & Service (2025-2032)
7.5.7.2. Malaysia Live Cell Imaging Market Size and Forecast, by Cell Type (2025-2032)
7.5.7.3. Malaysia Live Cell Imaging Market Size and Forecast, by Application (2025-2032)
7.5.7.4. Malaysia Live Cell Imaging Market Size and Forecast, by End User (2025-2032)
7.5.8. Vietnam
7.5.8.1. Vietnam Live Cell Imaging Market Size and Forecast, by Product & Service (2025-2032)
7.5.8.2. Vietnam Live Cell Imaging Market Size and Forecast, by Cell Type (2025-2032)
7.5.8.3. Vietnam Live Cell Imaging Market Size and Forecast, by Application (2025-2032)
7.5.8.4. Vietnam Live Cell Imaging Market Size and Forecast, by End User (2025-2032)
7.5.9. Taiwan
7.5.9.1. Taiwan Live Cell Imaging Market Size and Forecast, by Product & Service (2025-2032)
7.5.9.2. Taiwan Live Cell Imaging Market Size and Forecast, by Cell Type (2025-2032)
7.5.9.3. Taiwan Live Cell Imaging Market Size and Forecast, by Application (2025-2032)
7.5.9.4. Taiwan Live Cell Imaging Market Size and Forecast, by End User (2025-2032)
7.5.10. Rest of Asia Pacific
7.5.10.1. Rest of Asia Pacific Live Cell Imaging Market Size and Forecast, by Product & Service (2025-2032)
7.5.10.2. Rest of Asia Pacific Live Cell Imaging Market Size and Forecast, by Cell Type (2025-2032)
7.5.10.3. Rest of Asia Pacific Live Cell Imaging Market Size and Forecast, by Application (2025-2032)
7.5.10.4. Rest of Asia Pacific Live Cell Imaging Market Size and Forecast, by End User (2025-2032)
8. Middle East and Africa Live Cell Imaging Market Size and Forecast by Segmentation (in USD Billion) 2025-2032
8.1. Middle East and Africa Live Cell Imaging Market Size and Forecast, by Product & Service (2025-2032)
8.2. Middle East and Africa Live Cell Imaging Market Size and Forecast, by Cell Type (2025-2032)
8.3. Middle East and Africa Live Cell Imaging Market Size and Forecast, by Application (2025-2032)
8.4. Middle East and Africa Live Cell Imaging Market Size and Forecast, by End User (2025-2032)
8.5. Middle East and Africa Live Cell Imaging Market Size and Forecast, by Country (2025-2032)
8.5.1. South Africa
8.5.1.1. South Africa Live Cell Imaging Market Size and Forecast, by Product & Service (2025-2032)
8.5.1.2. South Africa Live Cell Imaging Market Size and Forecast, by Cell Type (2025-2032)
8.5.1.3. South Africa Live Cell Imaging Market Size and Forecast, by Application (2025-2032)
8.5.1.4. South Africa Live Cell Imaging Market Size and Forecast, by End User (2025-2032)
8.5.2. GCC
8.5.2.1. GCC Live Cell Imaging Market Size and Forecast, by Product & Service (2025-2032)
8.5.2.2. GCC Live Cell Imaging Market Size and Forecast, by Cell Type (2025-2032)
8.5.2.3. GCC Live Cell Imaging Market Size and Forecast, by Application (2025-2032)
8.5.2.4. GCC Live Cell Imaging Market Size and Forecast, by End User (2025-2032)
8.5.3. Nigeria
8.5.3.1. Nigeria Live Cell Imaging Market Size and Forecast, by Product & Service (2025-2032)
8.5.3.2. Nigeria Live Cell Imaging Market Size and Forecast, by Cell Type (2025-2032)
8.5.3.3. Nigeria Live Cell Imaging Market Size and Forecast, by Application (2025-2032)
8.5.3.4. Nigeria Live Cell Imaging Market Size and Forecast, by End User (2025-2032)
8.5.4. Rest of ME&A
8.5.4.1. Rest of ME&A Live Cell Imaging Market Size and Forecast, by Product & Service (2025-2032)
8.5.4.2. Rest of ME&A Live Cell Imaging Market Size and Forecast, by Cell Type (2025-2032)
8.5.4.3. Rest of ME&A Live Cell Imaging Market Size and Forecast, by Application (2025-2032)
8.5.4.4. Rest of ME&A Live Cell Imaging Market Size and Forecast, by End User (2025-2032)
9. South America Live Cell Imaging Market Size and Forecast by Segmentation (in USD Billion) 2025-2032
9.1. South America Live Cell Imaging Market Size and Forecast, by Product & Service (2025-2032)
9.2. South America Live Cell Imaging Market Size and Forecast, by Cell Type (2025-2032)
9.3. South America Live Cell Imaging Market Size and Forecast, by Application (2025-2032)
9.4. South America Live Cell Imaging Market Size and Forecast, by End User (2025-2032)
9.5. South America Live Cell Imaging Market Size and Forecast, by Country (2025-2032)
9.5.1. Brazil
9.5.1.1. Brazil Live Cell Imaging Market Size and Forecast, by Product & Service (2025-2032)
9.5.1.2. Brazil Live Cell Imaging Market Size and Forecast, by Cell Type (2025-2032)
9.5.1.3. Brazil Live Cell Imaging Market Size and Forecast, by Application (2025-2032)
9.5.1.4. Brazil Live Cell Imaging Market Size and Forecast, by End User (2025-2032)
9.5.2. Argentina
9.5.2.1. Argentina Live Cell Imaging Market Size and Forecast, by Product & Service (2025-2032)
9.5.2.2. Argentina Live Cell Imaging Market Size and Forecast, by Cell Type (2025-2032)
9.5.2.3. Argentina Live Cell Imaging Market Size and Forecast, by Application (2025-2032)
9.5.2.4. Argentina Live Cell Imaging Market Size and Forecast, by End User (2025-2032)
9.5.3. Rest Of South America
9.5.3.1. Rest Of South America Live Cell Imaging Market Size and Forecast, by Product & Service (2025-2032)
9.5.3.2. Rest Of South America Live Cell Imaging Market Size and Forecast, by Cell Type (2025-2032)
9.5.3.3. Rest Of South America Live Cell Imaging Market Size and Forecast, by Application (2025-2032)
9.5.3.4. Rest Of South America Live Cell Imaging Market Size and Forecast, by End User (2025-2032)
10. Company Profile: Key Players
10.1. Thermo Fisher Scientific
10.1.1. Company Overview
10.1.2. Business Portfolio
10.1.3. Financial Overview
10.1.4. SWOT Analysis
10.1.5. Strategic Analysis
10.1.6. Scale of Operation (small, medium, and large)
10.1.7. Details on Partnership
10.1.8. Regulatory Accreditations and Certifications Received by Them
10.1.9. Awards Received by the Firm
10.1.10. Recent Developments
10.2. Danaher Corporation
10.3. Carl Zeiss AG
10.4. Nikon Corporation
10.5. Olympus Corporation
10.6. Leica Microsystems
10.7. PerkinElmer (now part of Revvity)
10.8. GE HealthCare
10.9. Sartorius AG
10.10. Bruker Corporation
10.11. Agilent Technologies
10.12. Becton
10.13. Dickinson and Company
10.14. Merck KGaA
10.15. Bio‑Rad Laboratories
10.16. Molecular Devices
10.17. Andor Technology
10.18. Oxford Instruments
10.19. CytoSMART Technologies
10.20. NanoEnTek
10.21. Etaluma
10.22. CrestOptics
10.23. Ibidi GmbH
10.24. Phasefocus
10.25. Hudson Robotics
10.26. Corning Incorporated
10.27. DH Life Sciences
10.28. Luminex Corporation
10.29. Revvity
10.30. Evident Corporation
10.31. Leica Biosystems
11. Key Findings
12. Industry Recommendations
13. Live Cell Imaging Market: Research Methodology
14. Terms and Glossary