
Green Mining Market Size by Technology, Type, Application, Region – Segment-Level Market Assessment, Growth Opportunity Analysis, Competitive Mapping & Forecast to 2032
Overview
Global Green Mining Market size was valued at US$ 12.90 Bn in 2024 and the total Green Mining Market revenue is expected to grow at a CAGR of 7.5% through 2025 to 2032, reaching nearly US$ 23.01 Bn.
Green Mining Market Overview:
Green mining refers to implementation of environmentally sustainable practices across all stages of mineral extraction and processing to minimize ecological damage, reduce carbon emissions and enhance social benefits.
Global green mining market has been witnessing accelerated growth driven by mounting environmental regulations, corporate sustainability commitment and rising demand for low carbon minerals amid clean energy transition. Europe currently led market supported by stringent ESG policies and dominant players like BHP, Rio Tinto and Glencore which are pioneering renewable powered operations, AI driven resource optimization and zero waste extraction technologies. The sector benefit from diverse approaches like large mines adopt hydrogen fuelled processing and carbon capture, mid-tier operator focusing on electrified fleets and water recycling while innovative startup develops bioleaching and in-situ recovery methods to eliminate surface disruption. This evolving landscape demonstrate how green mining is transforming through circular economy models, real time emissions monitoring via IoT sensors and blockchain tracked ethical sourcing, meeting investor demands for decarbonized operations while addressing community concerns about water use and land rehabilitation all critical for securing the social license to operate in a climate conscious era.
The objective of the report is to present a comprehensive analysis of the global Green Mining Market to the stakeholders in the industry. The past and current status of the industry with the forecasted market size and trends are presented in the report with the analysis of complicated data in simple language. The report covers all the aspects of the industry with a dedicated study of key players that include market leaders, followers, and new entrants.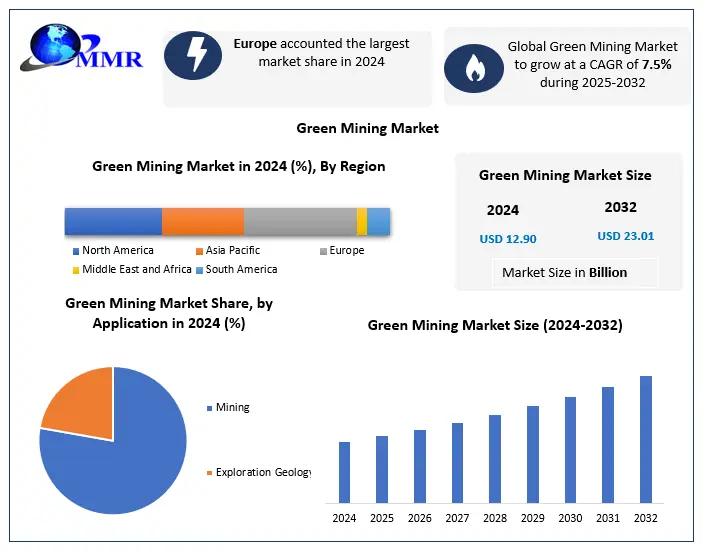 To know about the Research Methodology :- Request Free Sample Report
Green Mining Market Dynamics:
Sustainable Mining to Boost Green Mining Market Growth
Goal of green mining is to minimize the adverse environmental and social influences in all stages of the operations. Simultaneously, the operations strive to maximize social and local benefits. The growth of the middle class in most developing economies and the rapid development of technologies have created increasing interest in mineral resources. Mining has become increasingly difficult for societal and environmental reasons all over the globe. There is rising competition with other land uses; water and energy are scarce in several important mining regions.
The green mining industry faces major challenges to improve its performance and image. The green mining concept (GM) was developed as a major tool to make Finland the forerunner in maintainable mining. It helps material, water, and energy efficiency to reduce the environmental footprint of mineral-based product life cycles.
Green Mining Market Segment Analysis:
Based on Type, the global Green Mining market is segmented into Underground Mining and Surface Mining. The Surface Mining segment held the largest market share of xx% in 2024 and is expected to remain in its leading position during the forecast period. Surface mining began in the mid-sixteenth century and is practiced throughout the globe, though the majority of surface coal mining occurs in North America. It gained popularity during the 20th century, and surface mines now produce most of the coal mined in the US.
Based on Technology, the global Green Mining market is segmented into Emission Reduction, Water Reduction, Power Reduction, Fuel and Maintenance Reduction, and Others. The Power Reduction segment is expected to grow at a higher CAGR of xx% in the global green mining market. In the mining sector, power reduction refers to the gap between current energy usage and best practice energy consumption, which relates to energy savings prospects resulting from these technologies' expenditures. According to the Campaign for Energy Efficient Milling, the process consumes roughly 3% of world electricity generation, 50% of total mining energy, and 10% of overall production costs. Because mines usually have control over energy costs, the milling process must meet criteria while using as little energy as possible.
Green Mining Market Regional Insights:
Europe Dominated Green Mining Market
Europe is expected to dominate the global Green Mining market during the forecast period 2025-2032. Europe held the largest market share xx% in 2024. European miners will sustain their position at the forefront of integrating technology, particularly in more developed markets, owing to a highly skilled workforce and high levels of connectivity among the developed economies.
Asia Pacific is expected to grow at a higher CAGR of 8.7% in the global green mining market during the forecast period. Some Regulatory bodies in nations like Japan, China, and India have played a major role in growing the market in the area. Economic growth and high consumer demand for elegant and comfortable commodities in emerging regions are also strengthening the region's green mining market.
Green Mining Market Competitive Landscape:
Freeport-McMoRan (FCX) is positioning itself as leader in sustainable copper mining competing with global giants like BHP, Rio Tinto and Glencore which are aggressively investing in decarbonization and renewable energy integration. FCX differentiate itself through in situ leaching (ISL) technology at its Lone Star project (reducing water/energy use by 30%) and partnership with First Mode for hydrogen powered haul trucks at Arizona sites. However, it faces pressure from Canadian firms like Teck (carbon-neutral copper certification) and European players adopting stricter ESG benchmarks. Emerging threats include startups like Jetti Resources (low-energy copper extraction) and Chile’s Codelco which leads in solar powered mines. FCX’s focus on AI driven ore sorting and tailings reprocessing aims to cut waste but its slower adoption of full electrification (vs. BHP’s all-electric Chilean mines) highlights competitive gaps. The race hinges on scaling green tech while meeting surging copper demand for renewables.
Green Mining Market Key Trends:
• Electrification & Renewable Energy Integration: Mining operations are rapidly transitioning to all-electric fleets and renewable-powered sites to cut emissions, with companies like BHP and Rio Tinto leading the charge in solar/wind-powered mines.
• AI-Driven Resource Optimization & Waste Reduction: Advanced analytics and machine learning are revolutionizing ore sorting, water recycling, and tailings management, slashing environmental footprints while boosting efficiency.
• Circular Economy & Urban Mining Expansion: Companies are increasingly turning to e-waste recycling and tailings reprocessing to recover critical minerals, creating new revenue streams while reducing reliance on virgin materials.
Green Mining Market Key Developments:
• Caterpillar Inc. (USA)- March 2024: Launched the first fully electric underground mining truck (CAT® R1700 XE) at Chile’s El Teniente copper mine, cutting emissions by 100% vs. diesel models.
• Dundee Precious Metals (Canada)- February 2025: Achieved carbon-neutral gold production at its Chelopech Mine (Bulgaria) via solar power + biodiesel hybrids, backed by IRMA certification.
• Anglo American (UK)- November 2024: Commissioned hydrogen-powered haul trucks at its Mogalakwena PGMs mine (South Africa), reducing diesel use by 70% (part of its Carbon Neutral 2040 Goal).
• Glencore (Switzerland)- September 2024: Partnered with Li-Cycle to build Europe’s largest EV battery recycling hub in Italy, recovering 95%+ cobalt/nickel from scrap.
• Jiangxi Copper (China)- July 2024: Opened the world’s first AI-driven ‘zero-waste’ copper smelter in Jiangxi, using CO₂ capture and 99% tailings reuse.
Green Mining Market Scope: Inquire before buying
| Green Mining Market | |||
|---|---|---|---|
| Report Coverage | Details | ||
| Base Year: | 2024 | Forecast Period: | 2025-2032 |
| Historical Data: | 2019 to 2024 | Market Size in 2024: | USD 12.90 Bn. |
| Forecast Period 2025 to 2032 CAGR: | 7.5% | Market Size in 2032: | USD 23.01 Bn. |
| Segments Covered: | by Technology | Power Reduction Fuel and Maintenance Reduction Emission Reduction Water Reduction Other |
|
| by Type | Underground Mining Surface Mining |
||
| by Application | Mining Exploration Geology |
||
Green Mining Market, by region
North America (United States, Canada and Mexico)
Europe (United Kingdom, France, Germany, Italy, Spain, Sweden, Russia, Rest of Europe)
Asia Pacific (China, Japan, South Korea, India, Australia, Malaysia, Thailand, Vietnam, Indonesia, Philippines, Rest of APAC)
Middle East and Africa (South Africa, GCC, Nigeria, Egypt, Turkey, Rest of MEA)
South America (Brazil, Argentina, Colombia, Chile, Peru, Rest of South America)
Key Players
North America
1. Caterpillar Inc. (US)
2. Freeport-McMoRan (US)
3. Dundee Precious Metals (Canada)
Europe
4. Anglo American (UK)
5. Rio Tinto (UK)
6. Glencore (Switzerland)
7. Liebherr (Switzerland)
8. Volvo Construction Equipment (Sweden)
9. Sandvik AB (Sweden)
10. Epiroc AB (Sweden)
Asia Pacific
11. Jiangxi Copper Corporation Limited (China)
12. Shandong Gold Mining Co. Ltd (China)
13. Sany (China)
14. Komatsu Ltd. (Japan)
15. Hitachi Construction Machinery (Japan)
16. BHP Billiton (Australia)
17. Tata Steel (India)
18. Doosan Infracore (South Korea)
Middle East and Africa
19. Saudi Arabian Mining Corporation (Saudi Arabia)
South America
20. Vale S.A. (Brazil)
Frequently Asked Questions:
1] What segments are covered in Green Mining Market report?
Ans. The segments covered in Green Mining Market report are based on Type and Technology.
2] Which region is expected to hold the highest share in the global Green Mining Market?
Ans. Europe is expected to hold the highest share in the global market.
3] What is the market size of global Green Mining Market by 2032?
Ans. The market size of global market by 2032 is USD 23.01 Bn.
4] Who are the top key players in the global Green Mining Market?
Ans. Glencore, Rio Tinto, Vale S.A., BHP Billiton, Tata Steel and Anglo American are the top key players in the global market.
5] What was the market size of global Green Mining Market in 2024?
Ans. The market size of global market in 2024 was USD 12.90 Bn.
6] By Type, what segments are covered in Green Mining Market report?
Ans. The segments covered in Green Mining Market report by Type are Underground Mining and Surface Mining.