
Green Ammonia Market Size – Industry Structure Evaluation, Demand Drivers Analysis, Regional Growth Analysis and Identification, Competitive Positioning Review & Global Market Size Forecast to 2032
Overview
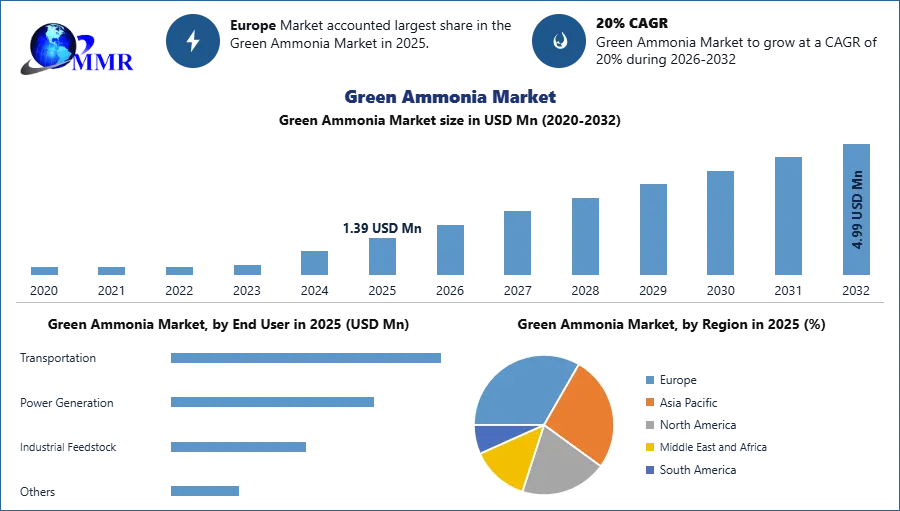
The Green Ammonia Market size was valued at USD 2.89 Million Tonnes in 2025 and the total Green Ammonia revenue is expected to grow at a CAGR of 20% from 2026 to 2032, reaching nearly USD 10.36 Million Tonnes by 2032.
Green ammonia is prepared with hydrogen, which comes from water electrolysis powered by alternative energy and it is emerging as a promising energy carrier for a variety of applications as the cost of producing renewable energy is dropping significantly. Ammonia is mostly used as a fertilizer in the agricultural business, a field whose environmental impact is coming under closer scrutiny. The need to make processes completely renewable and carbon-free is growing, which is causing Green Ammonia production to gain popularity. In order to employ hydrogen in emission-free fuel cells and turbines, ammonia could save the day by efficiently absorbing, storing, and transporting the gas.
The number of green hydrogen projects is rising as more countries across the world are concentrating their investments on the growth of a hydrogen-based economy. Investments in hydrogen infrastructure are expected to subsequently broaden the potential for carbon-free hydrogen to be reused for longer periods of time in the creation of green ammonia. In addition, the progression toward zero-carbon through decarbonization is expected to surge the consumption of green ammonia, which in turn is expected to boost the Green Ammonia Market growth across the world.
To know about the Research Methodology :- Request Free Sample Report
Green Ammonia Market Dynamics:
Rising Demand for Green Fertilizers to drive the Green Ammonia Market Growth
Generally, the quality of soil has significantly declined as a result of the widespread use of chemical fertilizers and pesticides. Demand for organic fertilizers is developing quickly in response to the growing demand for sustainable agricultural practices that reduce risk generation and carbon emissions. Important agrochemical producers are being compelled by this to change their preference for green and sustainable products like green ammonia. As a result, increased demand for green fertilizers to lessen environmental risks and pollution is expected to drive up green ammonia market growth through the forecast period.
Marine Industry to boost Green Ammonia Market
As ships use a lot of petroleum and expensive fuel, the transportation industry currently accounts for 3% of global greenhouse gas emissions. The primary type of bunker fuel for ships is heavy petroleum oils, which are created as a by-product of the distillation of petroleum products. Toxic SOx is emitted into the atmosphere when this fuel with a high sulphur content is used in a vessel's motor. Ammonia is the most effective energy carrier of protons. It can therefore provide energy for ships. According to MMR analysis, by 2050, ammonia is expected to account for more than 24% of the fuel supply used in the marine industry.
A vital component of many pharmaceutical and cleaning products, ammonia is also utilized to make explosives for the mining industry. Its production currently accounts for 1.8% of the world's CO2 emissions and primarily uses fossil fuels. However, green ammonia can be produced using renewable energy, reducing the carbon footprint of agricultural production and opening the substance up to more uses.
Green Ammonia Market Opportuinities
The companies are working on green ammonia, a method of producing ammonia in which hydrogen produced by water electrolysis powered by renewable energy sources replaces hydrogen supplied from hydrocarbons, effectively eliminating carbon dioxide from the process. In order to reduce the carbon footprint of producing traditional ammonia and produce what the industry refers to as blue ammonia, they are also investing in carbon capture and storage.
The Companies have investment and growth opportunities in Green Ammonia thanks to its potential energy storage properties and functions as a carbon-neutral fuel, hydrogen carrier, and fertilizer. Regular ammonia (NH3) is converted into green ammonia utilizing a procedure that is entirely renewable. This results in a net-zero emissions production method are expected to reduce annual CO2 emissions by up to 360 million tonnes globally.
The cost of producing green ammonia is two to four times higher than that of conventional ammonia. Additionally, some of the tools required to use the molecule, including ammonia-burning engines, are still in the experimental stage. The combined wind energy and ammonia energy storage system has a CO2 footprint of 0.03 kg CO2/kWh as opposed to coal- and natural gas-based energy generation with CCS, which have 0.04 kg CO2/kWh and 0.12 kg CO2/kWh, respectively. These encouraging outcomes support the use of green ammonia to maximize the capacity of SIDS (Small Island Developing States) for the long-term generation of renewable energy.
Growing Investments in Green Ammonia Projects across the World to drive Growth
For instance, the ammonium nitrate explosives producers Dyno Nobel and Queensland Nitrates are researching 9,000 and 20,000 t of green ammonia output, respectively, and the Norwegian fertilizer manufacturer Yara plans to install electrolyzers to produce 3,500 t per year of green ammonia at its plant in the Pilbara.
Chile and New Zealand are also running pilot projects at the moment. Last year, a number of far bigger projects were announced. The Saudi Arabian one is by far the most expensive. The $5 billion project is a collaboration between the American business Air Products and Chemicals, the Saudi Arabian developer NEOM, and the local enterprise ACWA Power.
In Japan, USD 2 billion an additional spent by Air Products to establish a cutting-edge distribution system. The ammonia will be transported around the globe to specialist facilities set up at depots for buses and trucks powered by hydrogen cells. Up to 15,000 trucks and buses will be able to consume the hydrogen produced by these units by dissociating the ammonia.
| Country | Project |
| India | ACME has plan to open its first "semi-commercial" factory for renewable ammonia and hydrogen in Rajasthan state. The plant can create 5 mt/day of renewable hydrogen and/or ammonia, and there is a 4-5 MW solar farm on-site. |
| Morocco | The largest green hydrogen and green ammonia project in Morocco to date, known as HEVO Ammonia Morocco, has been launched. Fusion Fuel Green, a provider of environmentally friendly hydrogen technology, and Consolidated Contractors Group S.A.L. will work together to construct the project. Vitol is also anticipated to control the off-take of the green ammonia. The project has started in 2022, and once completed, it is expected to create 183000 tonnes of green ammonia annually while preventing the emission of 280 000 tonnes of CO2. |
| Germany | In an effort to make Europe's largest economy climate neutral by 2050, Germany is trying to use green ammonia as a hydrogen carrier and as a clean-burning fuel for industry. Specifically, the government plans to spend €9 billion to develop green ammonia and hydrogen as fuels. |
| United Arab Emirates | As part of the energy transformation, the UAE is making significant investments in green fuels. As part of this initiative, the UAE will construct a $1 billion green ammonia facility. KIZAD, the Khalifa Industrial Zone Abu Dhabi in the United Arab Emirates, has declared plans to construct a $1 billion green ammonia production. As the third-largest oil producer in OPEC, this facility serves both domestic and international markets and represents a significant advance in the energy revolution. The plant will use an 800 MW solar power facility to generate 200 000 MT of green ammonia. |
| Saudi Arabia | A $5 billion green ammonia factory was announced by Air Products, ACWA Power, and NEOM for Saudi Arabia. By 2025, this plant ought to be fully operational. According to projections, this massive construction project will be fueled by 4GW of renewable energy and have the ability to create 1.2 million tonnes of green ammonia annually. |
Lack of Knowledge Regarding Green Ammonia and High Installation Cost to Hamper the Green Ammonia Market Growth
Green ammonia technology research is still in its early stages. Methods for quickly producing ammonia with water and nitrogen include biological cycling, photochemistry synthesizing, and the synthesis method. However, these techniques have significant technological challenges that necessitate work and R&D costs.
The vast majority of ammonia producers still use conventional methods to produce ammonia today. As a result, a lack of awareness of green ammonia is hampering the green ammonia market growth across the world.
The biggest impediment inhibiting the growth of the green ammonia sector right now is the investment nature of the facilities. A normal electrolysis procedure typically lasts 15 to 20 years. The CAPEX expenses of a new program typically vary from USD 1,300 to 2,000 for each tonne of methane produced. However, green ammonia is 1.5 times more expensive than ammonia production facilities that use fossil fuels.
The principal financial cost in the production of ammonia is biogas or fuel, which represents 75% of the plant's operating costs. A green ammonia factory's operational costs are increased by the cost of water electrolysis. As a result of their higher capital expenditure, green ammonia factories are not economically viable for small-scale manufacturing.
Green Ammonia Market Segment Analysis:
By Technology, the Green Ammonia Market is segmented into Alkaline Water Electrolysis (AWE), Proton Exchange Membrane (PEM), and Solid Oxide Electrolysis (SOE). The Alkaline Water Electrolysis segment accounted for the largest market share in 2025. As alkaline water electrolysis is a well-known and dependable type of electrolysis, it is expected to grow at a significant growth rate over the forecast time period. The alkaline water electrolysis variant of the electrolytic cell is defined by electrodes operating in a fluid electrolyte of sodium or potassium hydroxide.
This method is frequently used to produce green ammonia since the catalyst is less expensive and the gas quality is better. Alkaline water electrolysis has a longer lifespan due to replaceable electrolytes and fewer catalysts that dissolve in the oxide layer, both of which are expected to help the business grow.
By End User, the Green Ammonia Market is segmented into Transportation, Power Generation, Industrial Feedstock, and Others. The Transportation segment held the largest market share accounting in 2025. The segment growth is attributed to the current fuel energy crisis, which has fueled the need for green fuel. Renewable sources, including green ammonia and others, are replacing conventional ones. These sources generate fuel that is clean, effective, and environmentally benign. Global attention is being given to issues like environmental preservation and carbon emissions. These problems are causing the product to become very popular in the transportation sector. The product is liquid at ambient temperatures and only requires small storage volumes, which boosts the growth of the segment.
Green Ammonia Market Regional Insights:
The rate at which the cost of generating this chemical can be decreased will determine how much green ammonia is needed in the market. Given the growing awareness of zero emissions, pilot uses will increase in frequency soon. Since the major economies of the EU, North America, and APAC agreed to the legally obligatory goal of net zero by 2050, these regions have established objectives.
The Europe held the largest market share of the global Green Ammonia Market in 2025. Thanks to the growing adoption of technological improvements, Spain and Germany are two countries in the European region where the product is in great demand. With the industry becoming more concentrated, Europe offers the location of numerous ammonia production facilities and offers growing potential for manufacturers.
In Europe, conventional ammonia costs more to produce than green ammonia at the moment, partly because of the geopolitical unrest in Ukraine that caused gas prices to soar. In addition, growing investment from the government in the green ammonia project is boosting the market growth in Europe. For instance, in May , Germany announced plans to invest USD 9 Bn in green hydrogen projects.
The Asia Pacific is expected to grow at the highest growth rate during the forecast period. The region’s growth is attributed to the strict rules put in place by the government and the UN's promise to achieve zero emissions by 2050. In response to the tight emission restrictions and challenging zero-carbon ambitions, wind and solar energy are gaining center stage for implementing AWE.
Green Ammonia Industry Ecosystem:

Green Ammonia Market Scope: Inquire before buying
| Green Ammonia Market | |||
|---|---|---|---|
| Report Coverage | Details | ||
| Base Year: | 2025 | Forecast Period: | 2026-2032 |
| Historical Data: | 2020 to 2025 | Market Size in 2025: | 1.39 USD Mn |
| Forecast Period 2026-2032 CAGR: | 20% | Market Size in 2032: | 4.99 USD Mn |
| Segments Covered: | by Technology | Alkaline Water Electrolysis (AWE) Proton Exchange Membrane (PEM) Solid Oxide Electrolysis (SOE) |
|
| by Production Method | Electrolysis-Based Ammonia Biomass Gasification Biogas-Derived Ammonia Thermochemical Processes Renewable Haber–Bosch Process |
||
| by Application | Fertilizer Production Marine Fuel / Shipping Hydrogen Carrier Energy Storage Chemical Manufacturing |
||
| by End User | Transportation Power Generation Industrial Feedstock Others |
||
| by Sales Channel | Direct Sale Indirect Sale |
||
Green Ammonia Market, by Region
North America (United States, Canada and Mexico)
Europe (UK, France, Germany, Italy, Spain, Sweden, Austria, Turkey, Russia and Rest of Europe)
Asia Pacific (China, India, Japan, South Korea, Australia, ASEAN and Rest of APAC)
Middle East and Africa (South Africa, GCC, Egypt, Nigeria and Rest of ME&A)
South America (Brazil, Argentina, Columbia and Rest of South America)
Green Ammonia Market, Key Players are
The report by MMR emphasizes the growing importance of green ammonia as a sustainable alternative to traditional ammonia production, which heavily relies on fossil fuels. The production process utilizes renewable energy to extract hydrogen from water, significantly reducing carbon emissions. This shift is crucial for decarbonizing agriculture and other industries.
1. Enapter GmbH
2. Green Hydrogen Systems
3. Haldor Topsoe A/S
4. Hiringa Energy Ltd.
5. Hydrogenics (Cummins Inc.)
6. ITM Power Plc
7. Man Energy Solutions SE
8. MCPHY Energy SAS
9. Nel Hydrogen AS
10. Queensland Nitrates Pty Ltd.
11. Siemens AG
12. Thyssenkrupp Industrial Solutions AG
13. Uniper SE
14. Yara International ASA
15. Proton Ventures BV
16. Grieg Edge AS
17. CF Industries Holdings, Inc.
FAQs:
1. What was the Global Green Ammonia Market size in 2025?
Ans: The Global Green Ammonia Market size was USD 2.89 Mn Tonnes in 2025.
2. What is the study period for the Green Ammonia Market?
Ans. 2025-2032 is the study period for the Green Ammonia Market.
3. What is the growth rate of the Green Ammonia Market?
Ans. The Green Ammonia Market is growing at a CAGR of 20% over forecast the period.
4. Which region demands the maximum share in the Green Ammonia market as of 2025?
Ans. The European region demands the maximum share in the Green Ammonia market owing to the developments and investments in the major end-user industries.
5. What are the major key players in the Global Green Ammonia Market?
Ans. The major key players of the Global Green Ammonia Market are Enapter GmbH, Green Hydrogen Systems, Haldor Topsoe A/S, Hiringa Energy Ltd., Hydrogenics (Cummins Inc.), ITM Power Plc, Man Energy Solutions SE, MCPHY Energy SAS, Nel Hydrogen AS, Queensland Nitrates Pty Ltd., Siemens AG, Thyssenkrupp Industrial Solutions AG, Uniper SE, Yara International ASA, Proton Ventures BV, Grieg Edge AS, CF Industries Holdings, and Inc.
6. What is the forecast period for the Green Ammonia Market?
Ans. The forecast period for the Green Ammonia Market is 2026-2032.