Flue Gas Treatment Systems Market Size, Share, Trends and Forecast Analysis (2025-2032)

The Global Flue Gas Treatment Systems Market is estimated to be valued at USD 74.8 billion in 2024. The market is expected to reach USD 129.5 billion by 2032, exhibiting a compound annual growth rate (CAGR) of 7.10% from 2025 to 2032.

Global Flue Gas Treatment Systems Market Overview

Flue gas treatment systems refer to the equipment, which consists of a bag filter, a dry reactor, and a multi-cyclone that collects any remaining pollutants and makes sure that emissions meet strict emission regulations. Global flue gas treatment systems are used to purify the gas produced by energy from waste before it is released into the environment. Flue gas is a kind of gas that is present in the atmosphere and passes through a flue. A flue is a pipe used for conveying satanist gas through a fireplace, oven, furnace, boiler, or steam generator. Flue gas is emitted when coal, oil, natural gas, wood, or any other fuel is ignited in any industrial furnace, steam-generating boiler, or large combustion device. Flue gas usually consists of carbon dioxide, water vapor, nitrogen, and oxygen, along with pollutants like particulate matter, carbon monoxide, nitrogen oxides, and sulfur oxides. Fun gas tram systems are some tools and technologies bundled together to eliminate hazardous gas elements like nitrogen oxides and sulfur oxides from industries. These systems use devices such as electrostatic precipitators and scrubbers, which are at least 90% successful in removing environmentally unfriendly pollutants. The increasing demand for global flue gas treatment systems market from metal-forging industries due to the presence of harmful compounds like sulfur in the smoke, coupled with the growing infrastructure and construction industry globally, will drive the growth of the market in the forecast period. Flue gas treatment systems are mainly developed to control the emissions of various pollutants, including fly ash, sulfur dioxide, nitrogen oxides, and volatile organic compounds that may cause air pollution. Moreover, these systems are utilized by various end-user industries namely cement, iron, power, chemical, and petrochemical, in emerging economies majorly India, China, and Indonesia, the demand for cement has increased due to which the project based on infrastructure developments has also increased, which further drives the global flue gas treatment systems market growth in the upcoming years. Key Companies Insights: • In 2024, Babcock & Wilcox Enterprises, Inc. (B&W) expanded its environmental technologies division with a new USD 120 Billion contract in Asia for a full-suite flue gas desulfurization (FGD) system. The company also enhanced its SPIG cooling system offerings through a strategic collaboration in Europe. • GE Power secured new service contracts in 2024 with coal-fired utilities in the Middle East and Southeast Asia, offering upgrades to existing wet scrubbers and NOx control systems. The company is leveraging its AI-based monitoring platform for operational optimization.Flue Gas Treatment Systems Market
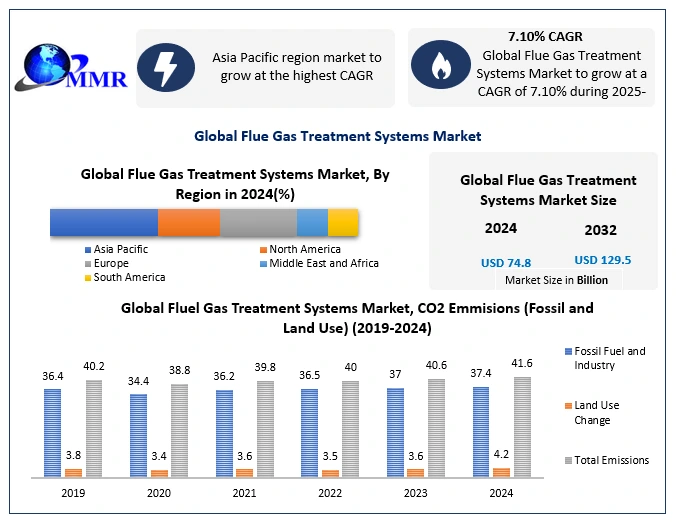
To know about the Research Methodology :- Request Free Sample Report

Global Flue Gas Treatment Systems Market Dynamics:

Global Flue Gas Treatment Systems Market Drivers: Growing Construction and Reconstruction Activities to boost the Flue Gas Treatment Systems Market Growing Construction and Re-Construction Activities of the Market The global flue gas treatment systems market is projected to boost due to increased construction and re-construction activities in both developed and developing countries, resulting in increased cement use and stricter government regulations on pollution and effluent emissions Hue gis treatment in a method of removing or reducing pollutants and other ambil gases emitted by the combustion of fossil fuels at power plants, industrial fascines, manufacturing units, and other industrial facilities. When fossil fuels like kerosene, coal, natural gas, wood, diesel, and others are bound to produce electricity or heat, they emit mercury, carbon dioxide, sulfur dioxide, sulfides, and other particles known as flue gases. The unity of these dangerous flue gases also contains nitrogen oxides. If flue gas from industrial buildings, manufacturing units, and power plants is not handled, it can contaminate the air in neighboring areas and spread further. Moreover, the demand for cement is being driven by increased infrastructure projects such as flyovers, tunnels, bridges, dams, highways, and construction activity in the commercial sector. As a result, Gaffur oxides and dioxides are released into the environment during cement manufacturing and pyro-stage combustion. Global Flue Gas Treatment Systems Market Restraints: Increasing the Volume of Emissions is steady for the Market The extraction and use of fossil fuels emits around 22 billion tonnes of carbon dioxide into the atmosphere each year, and the volume of emissions is steadily increasing. Therefore, new environmental rules to reduce VOC emissions have been enacted to identify, assess, and eliminate the root source of these emissions to save the environment. Therefore, this factor is projected to be one of the primary drivers of the global flue gas treatment market growth in the upcoming years. Environmental rules have resulted in an implicit pollution tax that has been increased in recent years for US manufacturing enterprises. Manufacturers in many industrial verticals have been pushed to create product improvements and promote the cause of a clean environment and lower VOC emissions due to a strict regulatory framework. Global Flue Gas Treatment Systems Market Opportunities: Rising Concerns of Global Economic Impact on the Market The concerns of global economic slowdown, the Impact of war in Ukraine, lockdowns in China with resurging COVID cases, and the Risks of stagflation envisage numerous market scenarios are pressing the need for Flue Gas Treatment Systems industry players to be more vigilant and forward-looking. Robust changes brought in by the pandemic COVID-19 in the Flue Gas Treatment Systems supply chain and the burgeoning drive for a cleaner and sustainable environment are necessitating companies to alter their strategies. The market study provides a comprehensive description of current trends and developments in the Flue Gas Treatment Systems industry, along with a detailed predictive and prescriptive analysis.

Global Flue Gas Treatment Systems Market Segmentation

Based on the Pollutant Control System, The particle control segment dominated the Global Flue Gas Treatment Systems Market in the year 2024 and is expected to continue its dominance during the forecast period. The particle control segment accounted for the highest proportion of the flue gas treatment systems market based on the pollutant control system. Therefore, during the projection period, this market sector is expected to maintain its dominance. Moreover, the increased consumption of electrostatic precipitators and bag filters in various end-use industries, including power, cement, iron & start nonferrous metal, and chemical & petrochemical, can be attributed to the increase in the particulate control segment of the growth of the market. Various technologies to limit mercury emissions are projected to promote the growth of the market in multiple nations, such as the United States, India, and China, in the next eight years.Flue Gas Treatment Systems Market1 Based on the Type of Business The system segment dominated the Global Market in the year 2024 and is expected to continue its dominance during the forecast period. The types of business, in the system segment, are expected to lead the flue gas treatment systems market during the forecast period. The rising installation of new gas treatment systems and the upgrading of existing ones in several industries can be attributed to the expiration of this system segment of the market.Flue Gas Treatment Systems Market2 Based on the End User, the power segment dominated the Global flue gas treatment systems Market in the year 2024 and is expected to continue its dominance during the forecast period. The power segment is expected to lead the flue gas treatment systems market. The increasing number of coal-based power plants in countries such as China, Japan, Poland, and India, and increased adherence to environmental rules by various businesses, can be linked to expanding this section of the market in the upcoming years.

Global Flue Gas Treatment Systems Market Regional Insights:

The Asia Pacific region dominated the global flue gas treatment systems market in 2024 and is expected to continue its dominance during the forecast period. The Asia Pacific area has the greatest market for flue gas treatment systems. The Asia Pacific flue gas treatment systems market is expected to grow due to the region's substantial industrial base and increasing demand for flue gas treatment systems from the cement and power industries. Additionally, multiple government initiatives in the Asia Pacific region to attract investments from various multinational firms are projected to fuel the growth of the Asia Pacific flue gas treatment systems market during the forecast period. In North America, the market is pushed by rapid industrialization and increased infrastructure. in the future years, the market aided by an increase in demand for power and dependence on coal. In addition, new participants are exploring technology in high-performing equipment and lower costs. The Europe region tends to hold significant global market growth owing to the ring number of coal-fired power plants and a growing chemical and petrochemical industry. Furthermore, as the region continues to urbanize, there is a greater demand for new infrastructure, which has raised the need for cement. Flue Gas Treatment Systems Market Competitive Landscape: Babcock & Wilcox is a dominant force in the global flue gas treatment systems market, with a strong legacy in power and industrial emissions control. The company provides a broad portfolio including wet and dry flue gas desulfurization (FGD) systems, DeNOx solutions, electrostatic precipitators (ESP), and multi-pollutant control systems. In 2024, B&W reported over USD 400 Billion in environmental segment revenues, with approximately USD 120 Billion generated directly from flue gas treatment projects, including a major contract in Asia for a wet FGD system at a coal-fired plant. B&W’s competitive edge lies in its advanced SPIG cooling integration and its proprietary "Absorption Plus" technology, which enables higher SOx removal efficiency. The company has a robust presence in North America and Asia-Pacific and competes aggressively through turnkey EPC services and long-term O&M contracts. Rivalry is intense with Mitsubishi and GE Power, particularly in utility-scale projects. Mitsubishi Heavy Industries Ltd. (MHI) is another global leader in flue gas treatment, particularly known for its ammonia-based DeNOx and wet FGD systems, which have been widely implemented in coal-fired power plants and waste incineration facilities across Asia and Europe. In 2024, MHI invested heavily in carbon capture-integrated flue gas systems, aligning with decarbonization trends. The division recorded estimated revenues of over $300 Billion from air quality control systems (AQCS), with strategic wins in Japan, India, and Germany. MHI’s differentiator is its in-house engineering for large-scale systems and ability to integrate flue gas cleaning with CO₂ capture—seen in its JERA Yokosuka project. Its rivalry with B&W is notable in Asia, while it competes with FLSmidth and Andritz in Europe. MHI's vertical integration, broad R&D base, and long-term presence give it a stable market share despite growing competition. General Electric (GE) Power, through its Air Quality Control Systems division (formerly Alstom), holds a substantial global share in the flue gas treatment market, particularly in ESP, wet and semi-dry FGD, and DeNOx technologies. In 2024, GE reported approximately USD 250 Billion in AQCS revenues, supported by contracts in the Middle East and Southeast Asia, including retrofit projects for SO₂ and NOx reduction in aging coal fleets. GE’s solutions are enhanced by digital analytics through its Predix platform, offering real-time emissions monitoring and predictive maintenance, which gives it a technological edge over competitors. The company focuses on turnkey installations and servicing for both new builds and retrofits. Despite divestments in other sectors, GE Power maintains a strong footprint in utility and industrial applications globally, although it faces stiff competition from MHI in high-efficiency systems and from B&W in North America.

Flue Gas Treatment Systems Market: Inquire Before Buying

Flue Gas Treatment Systems Market
Report Coverage Details
Base Year: 2024 Forecast Period: 2025-2032
Historical Data: 2019 to 2024 Market Size in 2024: USD 74.8 Bn.
Forecast Period 2025 to 2032 CAGR: 7.10% Market Size in 2032: USD 129.5 Bn.
Segments Covered: by Pollutant Control System FGD DeNOx Particulate Control Mercury Control
by Type of Business System Service
by End User Cement Power Iron Steel

Global Flue Gas Treatment Systems Market, By Region

North America (United States, Canada, and Mexico) Europe (UK, France, Germany, Italy, Spain, Russia, Rest of Europe) Asia Pacific (China, South Korea, Japan, India, Australia, Rest of Asia Pacific) Middle East and Africa (South Africa, Saudi Arabia, UAE, Rest of the Middle East &Africa) South America (Brazil, Argentina, Rest of South America)

Global Flue Gas Treatment Systems Market key players

1. Agilis Technology 2. AMEC Foster Wheeler (now part of Wood Group) 3. Classifier Milling Systems 4. Clyde Bergemann Power Group 5. Doosan Lentjes 6. FLSmidth 7. General Electric (GE Power) 8. Marsulex Environmental Technologies 9. Mitsubishi Hitachi Power Systems, Ltd. (MHPS) 10. Thermax Limited 11. Babcock & Wilcox Enterprises Inc. 12. Siemens Energy 13. Andritz AG 14. Hamon Group 15. Hitachi Zosen Inova AG 16. Ducon Technologies Inc. 17. Alstom SA 18. Lurgi GmbH 19. John Wood Group PLC 20. EnviroCare International Inc.

Frequently Asked Questions

1] What segments are covered in the Global Market report? Ans. The segments covered in the Global Market report are based on Pollutant Control Systems, Type of Business, End-User, and Region. 2] Which End-Users are expected to hold the highest share in the Global Market? Ans. The Asia-Pacific Region End-Users are expected to hold the highest share of the Global Asia-Pacific Flue Gas Treatment Systems Market. 3] What is the market size of the Global Market by 2032? Ans. The market size of the Global Market by 2032 is expected to reach USD 129.5 Bn. 4] What is the forecast period for the Global Market? Ans. The forecast period for the Global Market is 2025-2032. 5] What was the Global Flue Gas Treatment Systems Market size in 2024? Ans: The Global Flue Gas Treatment Systems Market size was USD 74.8 billion in 2024.
1. Flue Gas Treatment Systems Market Introduction 1.1. Study Assumptions and Market Definition 1.2. Scope of the Study 1.3. Executive Summary 2. Flue Gas Treatment Systems Market: Competitive Landscape 2.1. Ecosystem Analysis 2.2. MMR Competition Matrix 2.3. Competitive Landscape 2.4. Key Players Benchmarking 2.4.1. Company Name 2.4.2. Business Segment 2.4.3. End-user Segment 2.4.4. Revenue (2024) 2.4.5. Company Locations 2.5. Market Structure 2.5.1. Market Leaders 2.5.2. Market Followers 2.5.3. Emerging Players 2.6. Mergers and Acquisitions Details 2.7. KANO Model Analysis 3. Global Flue Gas Treatment Systems Market: Dynamics 3.1. Region-wise Trends of Flue Gas Treatment Systems Market 3.1.1. North America Flue Gas Treatment Systems Market Trends 3.1.2. Europe Flue Gas Treatment Systems Market Trends 3.1.3. Asia Pacific Flue Gas Treatment Systems Market Trends 3.1.4. Middle East and Africa Flue Gas Treatment Systems Market Trends 3.1.5. South America Flue Gas Treatment Systems Market Trends 3.2. Flue Gas Treatment Systems Market Dynamics 3.2.1. Global Flue Gas Treatment Systems Market Drivers 3.2.1.1. Rising demand for decentralized energy evolution and grid stability 3.2.1.2. Solar PV surge sparks 3.2.2. Global Flue Gas Treatment Systems Market Restraints 3.2.3. Global Flue Gas Treatment Systems Market Challenges 3.2.4. Global Flue Gas Treatment Systems Market Opportunities 3.3. PORTER’s Five Forces Analysis 3.4. PESTLE Using Tree-Map Analysis 3.4.1. Government Investment & Funding 3.4.2. Declining renewable costs. 3.4.3. Demand for clean energy & resilience. 3.5. Regulatory Landscape by Region 3.5.1. North America 3.5.2. Europe 3.5.3. Asia Pacific 3.5.4. Middle East and Africa 3.5.5. South America 4. Flue Gas Treatment Systems Market: Global Market Size and Forecast by Segmentation (by Value in USD Bn.) (2024-2032) 4.1. Flue Gas Treatment Systems Market Size and Forecast, By Pollutant Control System (2024-2032) 4.1.1. FGD 4.1.2. DeNOx 4.1.3. Particulate Control 4.1.4. Mercury Control 4.2. Flue Gas Treatment Systems Market Size and Forecast, By Type of Business (2024-2032) 4.2.1. System 4.2.2. Service 4.3. Research Centers and Laboratory Flue Gas Treatment Systems Market Size and Forecast, By End User (2024-2032) 4.3.1. Cement 4.3.2. Power 4.3.3. Iron 4.3.4. Steel 4.4. Flue Gas Treatment Systems Market Size and Forecast, by region (2024-2032) 4.4.1. North America 4.4.2. Europe 4.4.3. Asia Pacific 4.4.4. Middle East and Africa 4.4.5. South America 5. North America Flue Gas Treatment Systems Market Size and Forecast by Segmentation (by Value in USD Bn.) (2024-2032) 5.1. North America Flue Gas Treatment Systems Market Size and Forecast, By Pollutant Control System (2024-2032) 5.1.1. FGD 5.1.2. DeNOx 5.1.3. Particulate Control 5.1.4. Mercury Control 5.2. North America Flue Gas Treatment Systems Market Size and Forecast, By Type of Business (2024-2032) 5.2.1. System 5.2.2. Service 5.3. North America Flue Gas Treatment Systems Market Size and Forecast, By End User (2024-2032) 5.3.1. Cement 5.3.2. Power 5.3.3. Iron 5.3.4. Steel 5.4. North America Flue Gas Treatment Systems Market Size and Forecast, by Country (2024-2032) 5.4.1. United States 5.4.1.1. United States Flue Gas Treatment Systems Market Size and Forecast, By Pollutant Control System (2024-2032) 5.4.1.1.1. FGD 5.4.1.1.2. DeNOx 5.4.1.1.3. Particulate Control 5.4.1.1.4. Mercury Control 5.4.1.2. United States Flue Gas Treatment Systems Market Size and Forecast, By Type of Business (2024-2032) 5.4.1.2.1. System 5.4.1.2.2. Service 5.4.1.3. United States Flue Gas Treatment Systems Market Size and Forecast, By End User (2024-2032) 5.4.1.3.1. Cement 5.4.1.3.2. Power 5.4.1.3.3. Iron 5.4.1.3.4. Steel 5.4.2. Canada 5.4.2.1. Canada Flue Gas Treatment Systems Market Size and Forecast, By Pollutant Control System (2024-2032) 5.4.2.1.1. FGD 5.4.2.1.2. DeNOx 5.4.2.1.3. Particulate Control 5.4.2.1.4. Mercury Control 5.4.3. Canada Flue Gas Treatment Systems Market Size and Forecast, By Type of Business (2024-2032) 5.4.3.1.1. System 5.4.3.1.2. Service 5.4.3.2. Canada Flue Gas Treatment Systems Market Size and Forecast, By End User (2024-2032) 5.4.3.2.1. Cement 5.4.3.2.2. Power 5.4.3.2.3. Iron 5.4.3.2.4. Steel 5.4.4. Mexico 5.4.4.1. Mexico Flue Gas Treatment Systems Market Size and Forecast, By Pollutant Control System (2024-2032) 5.4.4.1.1. FGD 5.4.4.1.2. DeNOx 5.4.4.1.3. Particulate Control 5.4.4.1.4. Mercury Control 5.4.4.2. Mexico Flue Gas Treatment Systems Market Size and Forecast, By Type of Business (2024-2032) 5.4.4.2.1. System 5.4.4.2.2. Service 5.4.4.3. Mexico Flue Gas Treatment Systems Market Size and Forecast, By End User (2024-2032) 5.4.4.3.1. Cement 5.4.4.3.2. Power 5.4.4.3.3. Iron 5.4.4.3.4. Steel 6. Europe Flue Gas Treatment Systems Market Size and Forecast by Segmentation (by Value in USD Bn.) (2024-2032) 6.1. Europe Flue Gas Treatment Systems Market Size and Forecast, By Pollutant Control System (2024-2032) 6.2. Europe Flue Gas Treatment Systems Market Size and Forecast, By Type of Business (2024-2032) 6.3. Europe Flue Gas Treatment Systems Market Size and Forecast, By End User (2024-2032) 6.4. Europe Flue Gas Treatment Systems Market Size and Forecast, by Country (2024-2032) 6.4.1. United Kingdom 6.4.1.1. United Kingdom Flue Gas Treatment Systems Market Size and Forecast, By Pollutant Control System (2024-2032) 6.4.1.2. United Kingdom Flue Gas Treatment Systems Market Size and Forecast, By Type of Business (2024-2032) 6.4.1.3. United Kingdom Flue Gas Treatment Systems Market Size and Forecast, By End User (2024-2032) 6.4.2. France 6.4.2.1. France Flue Gas Treatment Systems Market Size and Forecast, By Pollutant Control System (2024-2032) 6.4.2.2. France Flue Gas Treatment Systems Market Size and Forecast, By Type of Business (2024-2032) 6.4.2.3. France Flue Gas Treatment Systems Market Size and Forecast, By End User (2024-2032) 6.4.3. Germany 6.4.3.1. Germany Flue Gas Treatment Systems Market Size and Forecast, By Pollutant Control System (2024-2032) 6.4.3.2. Germany Flue Gas Treatment Systems Market Size and Forecast, By Type of Business (2024-2032) 6.4.3.3. Germany Flue Gas Treatment Systems Market Size and Forecast, By End User (2024-2032) 6.4.4. Italy 6.4.4.1. Italy Flue Gas Treatment Systems Market Size and Forecast, By Pollutant Control System (2024-2032) 6.4.4.2. Italy Flue Gas Treatment Systems Market Size and Forecast, By Type of Business (2024-2032) 6.4.4.3. Italy Flue Gas Treatment Systems Market Size and Forecast, By End User (2024-2032) 6.4.5. Spain 6.4.5.1. Spain Flue Gas Treatment Systems Market Size and Forecast, By Pollutant Control System (2024-2032) 6.4.5.2. Spain Flue Gas Treatment Systems Market Size and Forecast, By Type of Business (2024-2032) 6.4.5.3. Spain Flue Gas Treatment Systems Market Size and Forecast, By End User (2024-2032) 6.4.6. Sweden 6.4.6.1. Sweden Flue Gas Treatment Systems Market Size and Forecast, By Pollutant Control System (2024-2032) 6.4.6.2. Sweden Flue Gas Treatment Systems Market Size and Forecast, By Type of Business (2024-2032) 6.4.6.3. Sweden Flue Gas Treatment Systems Market Size and Forecast, By End User (2024-2032) 6.4.7. Austria 6.4.7.1. Austria Flue Gas Treatment Systems Market Size and Forecast, By Pollutant Control System (2024-2032) 6.4.7.2. Austria Flue Gas Treatment Systems Market Size and Forecast, By Type of Business (2024-2032) 6.4.7.3. Austria Flue Gas Treatment Systems Market Size and Forecast, By End User (2024-2032) 6.4.8. Rest of Europe 6.4.8.1. Rest of Europe Flue Gas Treatment Systems Market Size and Forecast, By Pollutant Control System (2024-2032) 6.4.8.2. Rest of Europe Flue Gas Treatment Systems Market Size and Forecast, By Type of Business (2024-2032) 6.4.8.3. Rest of Europe Flue Gas Treatment Systems Market Size and Forecast, By End User (2024-2032) 7. Asia Pacific Flue Gas Treatment Systems Market Size and Forecast by Segmentation (by Value in USD Bn.) (2024-2032) 7.1. Asia Pacific Flue Gas Treatment Systems Market Size and Forecast, By Pollutant Control System (2024-2032) 7.2. Asia Pacific Flue Gas Treatment Systems Market Size and Forecast, By Type of Business (2024-2032) 7.3. Asia Pacific Flue Gas Treatment Systems Market Size and Forecast, By End User (2024-2032) 7.4. Asia Pacific Flue Gas Treatment Systems Market Size and Forecast, by Country (2024-2032) 7.4.1. China 7.4.1.1. China Flue Gas Treatment Systems Market Size and Forecast, By Pollutant Control System (2024-2032) 7.4.1.2. China Flue Gas Treatment Systems Market Size and Forecast, By Type of Business (2024-2032) 7.4.1.3. China Flue Gas Treatment Systems Market Size and Forecast, By End User (2024-2032) 7.4.2. S Korea 7.4.2.1. S Korea Flue Gas Treatment Systems Market Size and Forecast, By Pollutant Control System (2024-2032) 7.4.2.2. S Korea Flue Gas Treatment Systems Market Size and Forecast, By Type of Business (2024-2032) 7.4.2.3. S Korea Flue Gas Treatment Systems Market Size and Forecast, By End User (2024-2032) 7.4.3. Japan 7.4.3.1. Japan Flue Gas Treatment Systems Market Size and Forecast, By Pollutant Control System (2024-2032) 7.4.3.2. Japan Flue Gas Treatment Systems Market Size and Forecast, By Type of Business (2024-2032) 7.4.3.3. Japan Flue Gas Treatment Systems Market Size and Forecast, By End User (2024-2032) 7.4.4. India 7.4.4.1. India Flue Gas Treatment Systems Market Size and Forecast, By Pollutant Control System (2024-2032) 7.4.4.2. India Flue Gas Treatment Systems Market Size and Forecast, By Type of Business (2024-2032) 7.4.4.3. India Flue Gas Treatment Systems Market Size and Forecast, By End User (2024-2032) 7.4.5. Australia 7.4.5.1. Australia Flue Gas Treatment Systems Market Size and Forecast, By Pollutant Control System (2024-2032) 7.4.5.2. Australia Flue Gas Treatment Systems Market Size and Forecast, By Type of Business (2024-2032) 7.4.5.3. Australia Flue Gas Treatment Systems Market Size and Forecast, By End User (2024-2032) 7.4.6. Indonesia 7.4.6.1. Indonesia Flue Gas Treatment Systems Market Size and Forecast, By Pollutant Control System (2024-2032) 7.4.6.2. Indonesia Flue Gas Treatment Systems Market Size and Forecast, By Type of Business (2024-2032) 7.4.6.3. Indonesia Flue Gas Treatment Systems Market Size and Forecast, By End User (2024-2032) 7.4.7. Philippines 7.4.7.1. Philippines Flue Gas Treatment Systems Market Size and Forecast, By Pollutant Control System (2024-2032) 7.4.7.2. Philippines Flue Gas Treatment Systems Market Size and Forecast, By Type of Business (2024-2032) 7.4.7.3. Philippines Flue Gas Treatment Systems Market Size and Forecast, By End User (2024-2032) 7.4.8. Malaysia 7.4.8.1. Malaysia Flue Gas Treatment Systems Market Size and Forecast, By Pollutant Control System (2024-2032) 7.4.8.2. Malaysia Flue Gas Treatment Systems Market Size and Forecast, By Type of Business (2024-2032) 7.4.8.3. Malaysia Flue Gas Treatment Systems Market Size and Forecast, By End User (2024-2032) 7.4.9. Vietnam 7.4.9.1. Vietnam Flue Gas Treatment Systems Market Size and Forecast, By Pollutant Control System (2024-2032) 7.4.9.2. Vietnam Flue Gas Treatment Systems Market Size and Forecast, By Type of Business (2024-2032) 7.4.9.3. Vietnam Flue Gas Treatment Systems Market Size and Forecast, By End User (2024-2032) 7.4.10. Thailand 7.4.10.1. Thailand Flue Gas Treatment Systems Market Size and Forecast, By Pollutant Control System (2024-2032) 7.4.10.2. Thailand Flue Gas Treatment Systems Market Size and Forecast, By Type of Business (2024-2032) 7.4.10.3. Thailand Flue Gas Treatment Systems Market Size and Forecast, By End User (2024-2032) 7.4.11. Rest of Asia Pacific 7.4.11.1. Rest of Asia Pacific Flue Gas Treatment Systems Market Size and Forecast, By Pollutant Control System (2024-2032) 7.4.11.2. Rest of Asia Pacific Flue Gas Treatment Systems Market Size and Forecast, By Type of Business (2024-2032) 7.4.11.3. Rest of Asia Pacific Flue Gas Treatment Systems Market Size and Forecast, By End User (2024-2032) 8. Middle East and Africa Flue Gas Treatment Systems Market Size and Forecast by Segmentation (by Value in USD Bn.) (2024-2032) 8.1. Middle East and Africa Flue Gas Treatment Systems Market Size and Forecast, By Pollutant Control System (2024-2032) 8.2. Middle East and Africa Flue Gas Treatment Systems Market Size and Forecast, By Type of Business (2024-2032) 8.3. Middle East and Africa Flue Gas Treatment Systems Market Size and Forecast, By End User (2024-2032) 8.4. Middle East and Africa Flue Gas Treatment Systems Market Size and Forecast, by Country (2024-2032) 8.4.1. South Africa 8.4.1.1. South Africa Flue Gas Treatment Systems Market Size and Forecast, By Pollutant Control System (2024-2032) 8.4.1.2. South Africa Flue Gas Treatment Systems Market Size and Forecast, By Type of Business (2024-2032) 8.4.1.3. South Africa Flue Gas Treatment Systems Market Size and Forecast, By End User (2024-2032) 8.4.2. GCC 8.4.2.1. GCC Flue Gas Treatment Systems Market Size and Forecast, By Pollutant Control System (2024-2032) 8.4.2.2. GCC Flue Gas Treatment Systems Market Size and Forecast, By Type of Business (2024-2032) 8.4.2.3. GCC Flue Gas Treatment Systems Market Size and Forecast, By End User (2024-2032) 8.4.3. Nigeria 8.4.3.1. Nigeria Flue Gas Treatment Systems Market Size and Forecast, By Pollutant Control System (2024-2032) 8.4.3.2. Nigeria Flue Gas Treatment Systems Market Size and Forecast, By Type of Business (2024-2032) 8.4.3.3. Nigeria Flue Gas Treatment Systems Market Size and Forecast, By End User (2024-2032) 8.4.4. Rest of ME&A 8.4.4.1. Rest of ME&A Flue Gas Treatment Systems Market Size and Forecast, By Pollutant Control System (2024-2032) 8.4.4.2. Rest of ME&A Flue Gas Treatment Systems Market Size and Forecast, By Type of Business (2024-2032) 8.4.4.3. Rest of ME&A Flue Gas Treatment Systems Market Size and Forecast, By End User (2024-2032) 9. South America Flue Gas Treatment Systems Market Size and Forecast by Segmentation (by Value in USD Bn.) (2024-2032) 9.1. South America Flue Gas Treatment Systems Market Size and Forecast, By Pollutant Control System (2024-2032) 9.2. South America Flue Gas Treatment Systems Market Size and Forecast, By Type of Business (2024-2032) 9.3. South America Flue Gas Treatment Systems Market Size and Forecast, By End User (2024-2032) 9.4. South America Flue Gas Treatment Systems Market Size and Forecast, by Country (2024-2032) 9.4.1. Brazil 9.4.1.1. Brazil Flue Gas Treatment Systems Market Size and Forecast, By Pollutant Control System (2024-2032) 9.4.1.2. Brazil Flue Gas Treatment Systems Market Size and Forecast, By Type of Business (2024-2032) 9.4.1.3. Brazil Flue Gas Treatment Systems Market Size and Forecast, By End User (2024-2032) 9.4.2. Argentina 9.4.2.1. Argentina Flue Gas Treatment Systems Market Size and Forecast, By Pollutant Control System (2024-2032) 9.4.2.2. Argentina Flue Gas Treatment Systems Market Size and Forecast, By Type of Business (2024-2032) 9.4.2.3. Argentina Flue Gas Treatment Systems Market Size and Forecast, By End User (2024-2032) 9.4.3. Rest of South America 9.4.3.1. Rest of South America Flue Gas Treatment Systems Market Size and Forecast, By Pollutant Control System (2024-2032) 9.4.3.2. Rest of South America Flue Gas Treatment Systems Market Size and Forecast, By Type of Business (2024-2032) 9.4.3.3. Rest of South America Flue Gas Treatment Systems Market Size and Forecast, By End User (2024-2032) 10. Company Profile: Key Players (Detailed Profile for all Major Industry Players) 10.1. Agilis Technology 10.1.1. Company Overview 10.1.2. Business Portfolio 10.1.3. Financial Overview 10.1.4. SWOT Analysis 10.1.5. Strategic Analysis 10.1.6. Recent Developments 10.2. AMEC Foster Wheeler (now part of Wood Group) 10.3. Classifier Milling Systems 10.4. Clyde Bergemann Power Group 10.5. Doosan Lentjes 10.6. FLSmidth 10.7. General Electric (GE Power) 10.8. Marsulex Environmental Technologies 10.9. Mitsubishi Hitachi Power Systems, Ltd. (MHPS) 10.10. Thermax Limited 10.11. Babcock & Wilcox Enterprises Inc. 10.12. Siemens Energy 10.13. Andritz AG 10.14. Hamon Group 10.15. Hitachi Zosen Inova AG 10.16. Ducon Technologies Inc. 10.17. Alstom SA 10.18. Lurgi GmbH 10.19. John Wood Group PLC 10.20. EnviroCare International Inc. 11. Analyst Recommendations 12. Flue Gas Treatment Systems Market: Research Methodology
  • INQUIRE BEFORE BUYING
MMRLogo
America's Fastest Growing Market Research Firm