Electronic Display Market was valued at 170.94 Bn in 2024, and total Electronic Display Market revenue is expected to grow at a CAGR of 3.6% from 2025 to 2032, reaching nearly USD 226.84 Bn.Electronic Display Market Overview
Electronic display market with a wide range of screen technologies like LCD, LED, OLED and MicroLED used in devices from smartphones and TVs to digital signage and automotive dashboards. Market refers to global manufacturers, component suppliers, integrators and end users driving the adoption of advanced visual technologies across various sectors. Growth driver has been rising disposable income and increasing penetration of smart home devices, led to demand for high definition and energy efficient displays. Government initiatives, like India’s $600 billion electronics manufacturing target by 2027-28, increase market momentum by boosting production and innovation capacity. Demand supply landscape is shaped by technological innovation and mass production, with strong demand in entertainment and automotive applications. Asia Pacific dominated by larger adoption of OLED and AMOLED displays in consumer electronics, North America benefits from sustainability led policies and high investments. Market leaders like Samsung Electronics, LG Electronics, and Sony Corporation maintains competitive edge by continuous R&D and diverse portfolios. The entertainment sector leads in end user share, driven by UHD content consumption and smart TV adoption, solidifying its central role in shaping market dynamics. The report covers the dynamics and structure of the Electronic Display market, analyzing market segments and market size. Clear representation of competitive analysis of key players by type, price, financial position, product portfolio, growth strategies and regional presence in the Electronic Display Market.
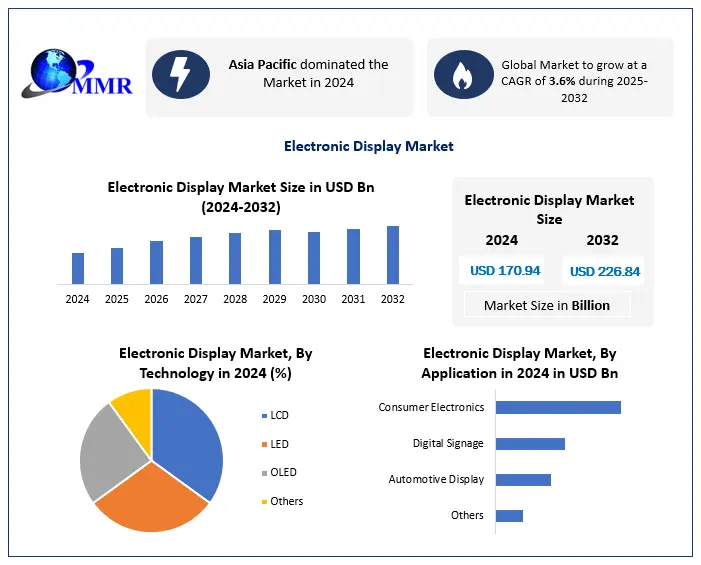
To Know About The Research Methodology :- Request Free Sample Report
Electronic Display Market Dynamics
Growing Residential Sector to Boost Electronic Products Demand The income level of the world population is rising, which allows them to spend more on housing and equip their homes with upcoming technological goods. Additionally, the growing trend of the inclusion of smart devices in the household would further expand the market size. The introduction of innovative household products in the market is likely to boost product consumption. For instance, in December 2023, LG Electronics launched a range of expanded TV panels, including Mini LED, OLED, and NanoCell TV sets, equipped with several advanced features. Therefore, the consumer electronic products market is projected to exhibit strong growth in the forthcoming years owing to a rising number of modernized households globally. Favourable Government Initiatives to Promote Electronic Devices Market Growth The global government authorities are taking efforts to support the growth of the electronic products in their respective countries. For instance, according to India Brand Equity Foundation, 2024-25, it has been estimated that the electronics manufacturing and export market of India is expected to reach USD 600 billion by 2027-28. This would further support the development of new technologies such as 5G, IoT, AI, and machine learning. Therefore, resulted in the greater adoption of electronic products embedded with the latest features in the country. Moreover, green building initiatives are likely to support the demand for energy-efficient consumer electronics across the globe. Therefore, initiatives regarding uplifting manufacturing capacity as well as the development of energy-efficient products would result in a flourishing market of consumer electronics. Lower Penetration in Less-Developed Countries to Hamper the Electronic Devices Market Growth Lower market penetration in certain less developed nations on account of sluggish economic conditions and the lack of access to electricity is expected to affect the market growth. For instance, according to a research paper published by Springer Nature, in 2024, Malaysia displayed significant sluggishness in embracing IoT-SHT (Internet-of-Things-based Smart Home Technology). As of 2024, the household penetration of IoT-SHT in Malaysia stood at merely 12.2%, falling below the global average of 14.2% and substantially straggling behind leading developed nations, such as the U.S. (40.1%), the U.K. (39.3%), South Korea (36.2%), and its neighbouring country, Singapore (28%). Besides, the adoption of smart high-end products is limited to a high-income group of the population. This is likely to restrict the expansion of the premium consumer electronics industry.Electronic Display Market Segmentation
Based on type, the market is segmented into LCD, LED, OLED and Others. Liquid crystal displays (LCD) dominated the market share in 2024 owing to its versatility, cost-effectiveness, and continuous technological advancements. The technology offers a balance of picture quality, color accuracy, energy efficiency, faster refresh rates, and affordability, making them useful in smartphones and tablets. Furthermore, ongoing advancements in LCD technology, such as In-Plane Switching (IPS), have increased the market demand. Furthermore, modern vehicles have various display systems, including digital dashboards, infotainment systems, and heads-up displays (HUDs). Organic emitting diodes (OLEDs) are expected to grow over the forecast period. OLED technology offers numerous advantages over traditional LCD screens, including higher contrast ratios and better color reproduction. These features make OLEDs highly desirable for high-end smartphones, where consumers demand superior display quality. The development of flexible and foldable OLED screens has also opened new possibilities for innovative device designs, further boosting their popularity in the consumer electronics market. Based on end user, the market is segmented into Entertainment, Retail, Corporate, Healthcare and others. The entertainment segment dominated the market and accounted for the largest revenue share in 2024, owing to the increasing demand for high-definition (HD) and ultra-high-definition (UHD) displays in home entertainment systems. Consumers have widely sought immersive viewing experiences, which has led to a surge in demand for 4K and 8K televisions equipped with advanced display technologies, including OLED and QLED. These technologies offer superior picture quality, vibrant colors, and deep blacks, ideal for home theaters and gaming setups.The retail segment is expected to grow substantially during the forecast period. The increased adoption of digital signage in retail environments primarily drove this growth. Retailers have increasingly leveraged digital signage to create dynamic and engaging advertisements, enhance customer engagement, and improve the shopping experience. In addition, interactive kiosks and touchscreens have been used to provide customers with product information, personalized recommendations, and self-service options to enhance customer experience and gather valuable data on customer behavior.![]()
Electronic Display Market Regional Insights
The Asia Pacific electronic display market dominated the global market and accounted for the largest revenue share in 2024 attributed to the rapid adoption of advanced display technologies such as OLED and AMOLED. These technologies offer superior picture quality, higher contrast ratios, and faster response times, making them highly desirable for consumer electronics, including smartphones, tablets, and televisions. The demand for high-resolution displays in these devices has continuously grown as consumers seek better visual experiences. Furthermore, government initiatives supporting technological advancements and the increasing adoption of new technologies have boosted market growth.Electronic Display Market Competitive Landscape Global Electronic display market has top key players like Samsung Electronics, LG Electronics and Sony Corporation emerging as dominant players. These industry leaders maintain strategic edge by continuous innovation, supply chains and variety of product portfolios spanning OLED, QLED, MicroLED and flexible displays. • Samsung Electronics, leads market with advancements in OLED and QLED technologies, catering to high growth segments like smartphones, smart TVs and wearables. It's vertical integration and massive scale of production provide cost efficiency and technological superiority, making it preferred partner across B2C and B2B channels. • LG Electronics, has established a stronghold in large format OLED displays and digital signage. Company continues to invest in next generation display technologies, with transparent and rollable OLEDs, enabling its leadership in premium commercial and automotive display solutions. • Sony Corporation, while smaller in production scale, differentiates through premium-grade displays focused on high end consumer electronics and professional broadcasting solutions. Its strength lies in precision imaging, innovation in MicroLED, and brand credibility. Electronic Display Market Trends
Electronic Display Market Key Developments • 3rd March 2025, 3M (U.S) announced it will continue its title sponsorship of the PGA Tour’s 3M Open until 2030, reaffirming its long-term commitment to Minnesota community and showcasing its innovations through the tournament. • 2nd July 2025, Samsung (South Korea) confirmed its $17 billion semiconductor fab in Taylor, Texas, is on track to open its first phase by the end of 2026, promising around 2,000 local jobs. • 1st July 2025, LG Electronics (South Korea) entered into a memorandum of understanding with Korea’s LogisValley to codevelop smart logistics centers, integrating autonomous robots, digital twins, visual AI, big data, and generative AI marking a major leap in its factory solutions. • 8th May 2025, LG Electronics (India) inaugurated construction of a new facility in Sri City, Andhra Pradesh, which is expected to start operations by late 2026, expanding their manufacturing footprint with a third plant in India. • 30th April 2025, Samsung Electronics (South Korea) launched a 32 inch Color E Paper display in Switzerland an energy-efficient, USB C powered signage solution built with over 50% recycled plastic that can run up to 200 days on a single charge.
Trends Description Impact Shift Toward OLED & MicroLED Displays Increasing adoption of OLED and emerging MicroLED technology due to better contrast, color accuracy, and flexibility. Enhancing user experience in smartphones, TVs, and wearables; driving R&D investments. Growth of Automotive & Industrial Displays Rising demand for high-resolution, rugged displays in EVs, autonomous vehicles, and industrial IoT interfaces. Expanding application scope beyond consumer electronics, boosting demand in B2B segments. Sustainability & Energy Efficiency Focus Manufacturers are emphasizing energy-efficient display panels and sustainable production. Boosts marketability and regulatory compliance, especially in Europe and North America. Electronic Display Market Scope: Inquire before buying
Electronic Display Market Report Coverage Details Base Year: 2024 Forecast Period: 2025-2032 Historical Data: 2019 to 2024 Market Size in 2024: USD 170.94 Bn. Forecast Period 2025 to 2032 CAGR: 3.6% Market Size in 2032: USD 226.84 Bn. Segments Covered: by Technology LCD LED OLED Others by Application Consumer Electronics Digital Signage Automotive Display Others by End-user Retail Entertainment Corporate Healthcare Government Electronic Display Market, by Region
North America (United States, Canada and Mexico) Europe (UK, France, Germany, Italy, Spain, Sweden, Austria and Rest of Europe) Asia Pacific (China, South Korea, Japan, India, Australia, Indonesia, Malaysia, Vietnam, Thailand, Bangladesh, Philippines and Rest of APAC) Middle East and Africa (South Africa, GCC, Egypt, Nigeria and Rest of ME&A) South America (Brazil, Argentina Rest of South America)Electronic Display Market Key Players
North America 1. NanoLumens (U.S) 2. Delta Systems (U.S) 3. Data Display Systems LLC (U.S) 4. 3M (U.S) Asia Pacific 5. Samsung Electronics (South Korea) 6. LG Electronics (South Korea) 7. Sony Corporation (Japan) 8. Sharp NEC Display Solutions (Japan) 9. Panasonic Corporation (Japan) 10. BOE Technology Group (China) 11. Innolux Corporation (Taiwan) 12. AU Optronics (Taiwan) 13. Japan Display Inc. (Japan) 14. E Ink Holdings (Taiwan) 15. Casio Computer Co., Ltd. (Japan) 16. Toshiba Corporation (Japan) 17. Sharp Corporation (Japan) 18. Coretronic Corporation (Taiwan) 19. Visionox Technology (China) 20. Skyworth Group (China)Electronic Display Market FAQs
1] What segments are covered in the Electronic Display Market report? Ans. The segments covered in the Electronic Display Market report are By Technology, By Application and By End-user. 2] Which region is expected to hold the highest share in the Electronic Display Market? Ans. The Asia Pacific region is expected to hold the highest share in the ElectronicDisplay Market. 3] What is the market size of the Electronic Display Market by 2032? Ans. The Electronic Display market size is expected to reach USD 226.84 Bn by 2032. 4] What is the forecast period for the Electronic Display Market? Ans. The forecast period for the Electronic Display Market is 2025-2032. 5] What was the market size of the Electronic Display Market in 2024? Ans. The market size of the Electronic Display Market in 2024 was valued at USD 170.94 Bn.
1. Electronic Display Market Introduction 1.1. Study Assumptions and Market Definition 1.2. Scope of the Study 1.3. Executive Summary 2. Electronic Display Market: Competitive Landscape 2.1. Ecosystem Analysis 2.2. MMR Competition Matrix 2.3. Competitive Landscape 2.4. Key Players Benchmarking 2.4.1. Company Name 2.4.2. Business Segment 2.4.3. End-user Segment 2.4.4. Revenue (2024) 2.4.5. Company Locations 2.5. Market Structure 2.5.1. Market Leaders 2.5.2. Market Followers 2.5.3. Emerging Players 2.6. Mergers and Acquisitions Details 2.7. KANO Model Analysis 3. Electronic Display Market: Dynamics 3.1. Region-wise Trends of Electronic Display Market 3.1.1. North America Electronic Display Market Trends 3.1.2. Europe Electronic Display Market Trends 3.1.3. Asia Pacific Electronic Display Market Trends 3.1.4. Middle East and Africa Electronic Display Market Trends 3.1.5. South America Electronic Display Market 3.2. Electronic Display Market Dynamics 3.2.1. Electronic Display Market Drivers 3.2.1.1. Smart Home Integration 3.2.1.2. Disposable Income Rise 3.2.1.3. Government Manufacturing Push 3.2.2. Electronic Display Market Restraints 3.2.3. Electronic Display Market Opportunities 3.2.3.1. OLED & MicroLED Expansion 3.2.3.2. Automotive Display Demand 3.2.3.3. Digital Signage in Retail 3.2.4. Electronic Display Market Challenges 3.3. PORTER’s Five Forces Analysis 3.4. PESTLE Analysis 3.4.1. Tech Innovation (AI/5G) 3.4.2. Sustainability Regulations 3.4.3. Trade Policy Shifts 3.5. Electronic Display Rate (%), by region 3.6. Technological Advancements in Electronic Display 3.7. Price Trend Analysis by Region 3.8. Technological Roadmap 3.9. Regulatory Landscape by Region 3.9.1. North America 3.9.2. Europe 3.9.3. Asia Pacific 3.9.4. Middle East and Africa 3.9.5. South America 3.10. Analysis of Government Schemes and Initiatives for Electronic Display Industry 3.11. Key Opinion Leader Analysis 4. Electronic Display Market: Global Market Size and Forecast by Segmentation (by Value in USD Billion) (2024-2032) 4.1. Electronic Display Market Size and Forecast, By Technology (2024-2032) 4.1.1. LCD 4.1.2. LED 4.1.3. OLED 4.1.4. Others 4.2. Electronic Display Market Size and Forecast, By Application (2024-2032) 4.2.1. Consumer Electronics 4.2.2. Digital Signage 4.2.3. Automotive Display 4.2.4. Others 4.3. Electronic Display Market Size and Forecast, By End-user (2024-2032) 4.3.1. Retail 4.3.2. Entertainment 4.3.3. Corporate 4.3.4. Healthcare 4.3.5. Government 4.4. Electronic Display Market Size and Forecast, By Region (2024-2032) 4.4.1. North America 4.4.2. Europe 4.4.3. Asia Pacific 4.4.4. Middle East and Africa 4.4.5. South America 5. North America Electronic Display Market Size and Forecast by Segmentation (by Value in USD Billion) (2024-2032) 5.1. North America Electronic Display Market Size and Forecast, By Technology (2024-2032) 5.1.1. LCD 5.1.2. LED 5.1.3. OLED 5.1.4. Others 5.2. North America Electronic Display Market Size and Forecast, By Application (2024-2032) 5.2.1. Consumer Electronics 5.2.2. Digital Signage 5.2.3. Automotive Display 5.2.4. Others 5.3. Electronic Display Market Size and Forecast, By End-user (2024-2032) 5.3.1. Retail 5.3.2. Entertainment 5.3.3. Corporate 5.3.4. Healthcare 5.3.5. Government 5.4. North America Electronic Display Market Size and Forecast, by Country (2024-2032) 5.4.1. United States 5.4.1.1. United States Electronic Display Market Size and Forecast, By Technology (2024-2032) 5.4.1.1.1. LCD 5.4.1.1.2. LED 5.4.1.1.3. OLED 5.4.1.1.4. Others 5.4.1.2. United States Electronic Display Market Size and Forecast, By Application (2024-2032) 5.4.1.2.1. Consumer Electronics 5.4.1.2.2. Digital Signage 5.4.1.2.3. Automotive Display 5.4.1.2.4. Others 5.4.1.3. United States Electronic Display Market Size and Forecast, By End-user (2024-2032) 5.4.1.3.1. Retail 5.4.1.3.2. Entertainment 5.4.1.3.3. Corporate 5.4.1.3.4. Healthcare 5.4.1.3.5. Government 5.4.2. Canada 5.4.2.1. Canada Electronic Display Market Size and Forecast, By Technology (2024-2032) 5.4.2.1.1. LCD 5.4.2.1.2. LED 5.4.2.1.3. OLED 5.4.2.1.4. Others 5.4.2.2. Canada Electronic Display Market Size and Forecast, By Application (2024-2032) 5.4.2.2.1. Consumer Electronics 5.4.2.2.2. Digital Signage 5.4.2.2.3. Automotive Display 5.4.2.2.4. Others 5.4.2.3. Canada Electronic Display Market Size and Forecast, By End-user (2024-2032) 5.4.2.3.1. Retail 5.4.2.3.2. Entertainment 5.4.2.3.3. Corporate 5.4.2.3.4. Healthcare 5.4.2.3.5. Government 5.4.3. Mexico 5.4.3.1. Mexico Electronic Display Market Size and Forecast, By Technology (2024-2032) 5.4.3.1.1. LCD 5.4.3.1.2. LED 5.4.3.1.3. OLED 5.4.3.1.4. Others 5.4.3.2. Mexico Electronic Display Market Size and Forecast, By Application (2024-2032) 5.4.3.2.1. Consumer Electronics 5.4.3.2.2. Digital Signage 5.4.3.2.3. Automotive Display 5.4.3.2.4. Others 5.4.3.3. Mexico Electronic Display Market Size and Forecast, By End-user (2024-2032) 5.4.3.3.1. Retail 5.4.3.3.2. Entertainment 5.4.3.3.3. Corporate 5.4.3.3.4. Healthcare 5.4.3.3.5. Governments 6. Europe Electronic Display Market Size and Forecast by Segmentation (by Value in USD Billion) (2024-2032) 6.1. Europe Electronic Display Market Size and Forecast, By Technology (2024-2032) 6.2. Europe Electronic Display Market Size and Forecast, By Application (2024-2032) 6.3. Europe Electronic Display Market Size and Forecast, By End-user (2024-2032) 6.4. Europe Electronic Display Market Size and Forecast, by Country (2024-2032) 6.4.1. United Kingdom 6.4.1.1. United Kingdom Electronic Display Market Size and Forecast, By Technology (2024-2032) 6.4.1.2. United Kingdom Electronic Display Market Size and Forecast, By Application (2024-2032) 6.4.1.3. United Kingdom Electronic Display Market Size and Forecast, By End-user (2024-2032) 6.4.2. France 6.4.2.1. France Electronic Display Market Size and Forecast, By Technology (2024-2032) 6.4.2.2. France Electronic Display Market Size and Forecast, By Application (2024-2032) 6.4.2.3. France Electronic Display Market Size and Forecast, By End-user (2024-2032) 6.4.3. Germany 6.4.3.1. Germany Electronic Display Market Size and Forecast, By Technology (2024-2032) 6.4.3.2. Germany Electronic Display Market Size and Forecast, By Application (2024-2032) 6.4.3.3. Electronic Display Market Size and Forecast, By End-user (2024-2032) 6.4.3.4. Germany Electronic Display Market Size and Forecast, By End-user (2024-2032) 6.4.4. Italy 6.4.4.1. Italy Electronic Display Market Size and Forecast, By Technology (2024-2032) 6.4.4.2. Italy Electronic Display Market Size and Forecast, By Application (2024-2032) 6.4.4.3. Italy Electronic Display Market Size and Forecast, By End-user (2024-2032) 6.4.5. Spain 6.4.5.1. Spain Electronic Display Market Size and Forecast, By Technology (2024-2032) 6.4.5.2. Spain Electronic Display Market Size and Forecast, By Application (2024-2032) 6.4.5.3. Spain Electronic Display Market Size and Forecast, By End-user (2024-2032) 6.4.6. Sweden 6.4.6.1. Sweden Electronic Display Market Size and Forecast, By Technology (2024-2032) 6.4.6.2. Sweden Electronic Display Market Size and Forecast, By Application (2024-2032) 6.4.6.3. Sweden Electronic Display Market Size and Forecast, By End-user (2024-2032) 6.4.7. Russia 6.4.7.1. Russia Electronic Display Market Size and Forecast, By Technology (2024-2032) 6.4.7.2. Russia Electronic Display Market Size and Forecast, By Application (2024-2032) 6.4.7.3. Russia Electronic Display Market Size and Forecast, By End-user (2024-2032) 6.4.8. Rest of Europe 6.4.8.1. Rest of Europe Electronic Display Market Size and Forecast, By Technology (2024-2032) 6.4.8.2. Rest of Europe Electronic Display Market Size and Forecast, By Application (2024-2032) 6.4.8.3. Rest of Europe Electronic Display Market Size and Forecast, By End-user (2024-2032) 7. Asia Pacific Electronic Display Market Size and Forecast by Segmentation (by Value in USD Billion) (2024-2032) 7.1. Asia Pacific Electronic Display Market Size and Forecast, By Technology (2024-2032) 7.2. Asia Pacific Electronic Display Market Size and Forecast, By Application (2024-2032) 7.3. Asia Pacific Electronic Display Market Size and Forecast, By End-user (2024-2032) 7.4. Asia Pacific Electronic Display Market Size and Forecast, by Country (2024-2032) 7.4.1. China 7.4.1.1. China Electronic Display Market Size and Forecast, By Technology (2024-2032) 7.4.1.2. China Electronic Display Market Size and Forecast, By Application (2024-2032) 7.4.1.3. China Electronic Display Market Size and Forecast, By End-user (2024-2032) 7.4.2. S Korea 7.4.2.1. S Korea Electronic Display Market Size and Forecast, By Technology (2024-2032) 7.4.2.2. S Korea Electronic Display Market Size and Forecast, By Application (2024-2032) 7.4.2.3. S Korea Electronic Display Market Size and Forecast, By End-user (2024-2032) 7.4.3. Japan 7.4.3.1. Japan Electronic Display Market Size and Forecast, By Technology (2024-2032) 7.4.3.2. Japan Electronic Display Market Size and Forecast, By Application (2024-2032) 7.4.3.3. Japan Electronic Display Market Size and Forecast, By End-user (2024-2032) 7.4.4. India 7.4.4.1. India Electronic Display Market Size and Forecast, By Technology (2024-2032) 7.4.4.2. India Electronic Display Market Size and Forecast, By Application (2024-2032) 7.4.4.3. India Electronic Display Market Size and Forecast, By End-user (2024-2032) 7.4.5. Australia 7.4.5.1. Australia Electronic Display Market Size and Forecast, By Technology (2024-2032) 7.4.5.2. Australia Electronic Display Market Size and Forecast, By Application (2024-2032) 7.4.5.3. Australia Electronic Display Market Size and Forecast, By End-user (2024-2032) 7.4.6. Indonesia 7.4.6.1. Indonesia Electronic Display Market Size and Forecast, By Technology (2024-2032) 7.4.6.2. Indonesia Electronic Display Market Size and Forecast, By Application (2024-2032) 7.4.6.3. Indonesia Electronic Display Market Size and Forecast, By End-user (2024-2032) 7.4.7. Malaysia 7.4.7.1. Malaysia Electronic Display Market Size and Forecast, By Technology (2024-2032) 7.4.7.2. Malaysia Electronic Display Market Size and Forecast, By Application (2024-2032) 7.4.7.3. Malaysia Electronic Display Market Size and Forecast, By End-user (2024-2032) 7.4.8. Philippians 7.4.8.1. Philippians Electronic Display Market Size and Forecast, By Technology (2024-2032) 7.4.8.2. Philippians Electronic Display Market Size and Forecast, By Application (2024-2032) 7.4.8.3. Philippians Electronic Display Market Size and Forecast, By End-user (2024-2032) 7.4.9. Thailand 7.4.9.1. Thailand Electronic Display Market Size and Forecast, By Technology (2024-2032) 7.4.9.2. Thailand Electronic Display Market Size and Forecast, By Application (2024-2032) 7.4.9.3. Thailand Electronic Display Market Size and Forecast, By End-user (2024-2032) 7.4.10. Vietnam 7.4.10.1. Vietnam Electronic Display Market Size and Forecast, By Technology (2024-2032) 7.4.10.2. Vietnam Electronic Display Market Size and Forecast, By Application (2024-2032) 7.4.10.3. Vietnam Electronic Display Market Size and Forecast, By End-user (2024-2032) 7.4.11. Rest of Asia Pacific 7.4.11.1. Rest of Asia Pacific Electronic Display Market Size and Forecast, By Technology (2024-2032) 7.4.11.2. Rest of Asia Pacific Electronic Display Market Size and Forecast, By Application (2024-2032) 7.4.11.3. Rest of Asia Pacific Electronic Display Market Size and Forecast, By End-user (2024-2032) 8. Middle East and Africa Electronic Display Market Size and Forecast (by Value in USD Billion) (2024-2032) 8.1. Middle East and Africa Electronic Display Market Size and Forecast, By Technology (2024-2032) 8.2. Middle East and Africa Electronic Display Market Size and Forecast, By Application (2024-2032) 8.3. Middle East and Africa Electronic Display Market Size and Forecast, By End-user (2024-2032) 8.4. Middle East and Africa Electronic Display Market Size and Forecast, by Country (2024-2032) 8.4.1. South Africa 8.4.1.1. South Africa Electronic Display Market Size and Forecast, By Technology (2024-2032) 8.4.1.2. South Africa Electronic Display Market Size and Forecast, By Application (2024-2032) 8.4.1.3. South Africa Electronic Display Market Size and Forecast, By End-user (2024-2032) 8.4.2. GCC 8.4.2.1. GCC Electronic Display Market Size and Forecast, By Technology (2024-2032) 8.4.2.2. GCC Electronic Display Market Size and Forecast, By Application (2024-2032) 8.4.2.3. GCC Electronic Display Market Size and Forecast, By End-user (2024-2032) 8.4.3. Egypt 8.4.3.1. Egypt Electronic Display Market Size and Forecast, By Technology (2024-2032) 8.4.3.2. Egypt Electronic Display Market Size and Forecast, By Application (2024-2032) 8.4.3.3. Egypt Electronic Display Market Size and Forecast, By End-user (2024-2032) 8.4.4. Nigeria 8.4.4.1. Nigeria Electronic Display Market Size and Forecast, By Technology (2024-2032) 8.4.4.2. Nigeria Electronic Display Market Size and Forecast, By Application (2024-2032) 8.4.4.3. Nigeria Electronic Display Market Size and Forecast, By End-user (2024-2032) 8.4.5. Rest of ME&A 8.4.5.1. Rest of ME&A Electronic Display Market Size and Forecast, By Technology (2024-2032) 8.4.5.2. Rest of ME&A Electronic Display Market Size and Forecast, By Application (2024-2032) 9. South America Electronic Display Market Size and Forecast by Segmentation (by Value in USD Billion) (2024-2032 9.1. South America Electronic Display Market Size and Forecast, By Technology (2024-2032) 9.2. South America Electronic Display Market Size and Forecast, By Application (2024-2032) 9.3. South America Electronic Display Market Size and Forecast, By Country (2024-2032) 9.3.1. Brazil 9.3.1.1. Brazil Electronic Display Market Size and Forecast, By Technology (2024-2032) 9.3.1.2. Brazil Electronic Display Market Size and Forecast, By Application (2024-2032) 9.3.1.3. Brazil Electronic Display Market Size and Forecast, By End-user (2024-2032) 9.3.2. Argentina 9.3.2.1. Argentina Electronic Display Market Size and Forecast, By Technology (2024-2032) 9.3.2.2. Argentina Electronic Display Market Size and Forecast, By Application (2024-2032) 9.3.2.3. Argentina Electronic Display Market Size and Forecast, By End-user (2024-2032) 9.3.3. Colombia 9.3.3.1. Colombia Electronic Display Market Size and Forecast, By Technology (2024-2032) 9.3.3.2. Colombia Electronic Display Market Size and Forecast, By Application (2024-2032) 9.3.3.3. Colombia Electronic Display Market Size and Forecast, By End-user (2024-2032) 9.3.4. Chile 9.3.4.1. Chile Electronic Display Market Size and Forecast, By Technology (2024-2032) 9.3.4.2. Chile Electronic Display Market Size and Forecast, By Application (2024-2032) 9.3.4.3. Chile Electronic Display Market Size and Forecast, By End-user (2024-2032) 9.3.5. Rest of South America 9.3.5.1. Rest of South America Electronic Display Market Size and Forecast, By Technology (2024-2032) 9.3.5.2. Rest of South America Electronic Display Market Size and Forecast, By Application (2024-2032) 9.3.5.3. Rest of South America Electronic Display Market Size and Forecast, By End-user (2024-2032) 10. Company Profile: Key Players (Detailed Profile for all Major Industry Players) 10.1. Samsung Electronics (South Korea) 10.1.1. Company Overview 10.1.2. Business Portfolio 10.1.3. Financial Overview 10.1.4. SWOT Analysis 10.1.5. Strategic Analysis 10.1.6. Recent Development 10.2. NanoLumens (U.S) 10.3. Delta Systems (U.S) 10.4. Data Display Systems LLC (U.S) 10.5. 3M (U.S) 10.6. LG Electronics (South Korea) 10.7. Sony Corporation (Japan) 10.8. Sharp NEC Display Solutions (Japan) 10.9. Panasonic Corporation (Japan) 10.10. BOE Technology Group (China) 10.11. Innolux Corporation (Taiwan) 10.12. AU Optronics (Taiwan) 10.13. Japan Display Inc. (Japan) 10.14. E Ink Holdings (Taiwan) 10.15. Casio Computer Co., Ltd. (Japan) 10.16. Toshiba Corporation (Japan) 10.17. Sharp Corporation (Japan) 10.18. Coretronic Corporation (Taiwan) 10.19. Visionox Technology (China) 10.20. Skyworth Group (China) 11. Key Findings 12. Analyst Recommendations 13. Electronic Display Market: Research Methodology