BPA Free Cans Market
1. Preface
1.1. Report Scope and Market Segmentation
1.2. Research Highlights
1.3. Research Objectives
2. Assumptions and Research Methodology
2.1. Report Assumptions
2.2. Abbreviations
2.3. Research Methodology
2.3.1. Secondary Research
2.3.1.1. Secondary data
2.3.1.2. Secondary Sources
2.3.2. Primary Research
2.3.2.1. Data from Primary Sources
2.3.2.2. Breakdown of Primary Sources
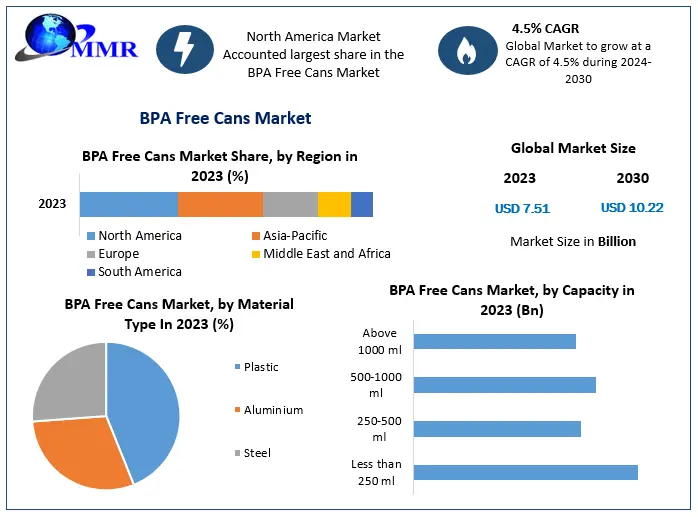
3. Executive Summary: BPA Free Cans Market Size, by Market Value (US$ Bn) and Market Volume (Units)
4. Market Overview
4.1. Introduction
4.2. Market Indicator
4.2.1. Drivers
4.2.2. Restraints
4.2.3. Opportunities
4.2.4. Challenges
4.3. Porter’s Analysis
4.4. Value Chain Analysis
4.5. Market Risk Analysis
4.6. SWOT Analysis
4.7. Industry Trends and Emerging Technologies
5. Supply Side and Demand Side Indicators
6. BPA Free Cans Market Analysis and Forecast
6.1. BPA Free Cans Market Size & Y-o-Y Growth Analysis
6.1.1. North America
6.1.2. Europe
6.1.3. Asia Pacific
6.1.4. Middle East & Africa
6.1.5. South America
7. BPA Free Cans Market Analysis and Forecast, by Material Type
7.1. Introduction and Definition
7.2. Key Findings
7.3. BPA Free Cans Market Value Share Analysis, by Material Type
7.4. BPA Free Cans Market Size (US$ Bn) Forecast, by Material Type
7.5. BPA Free Cans Market Analysis, by Material Type
7.6. BPA Free Cans Market Attractiveness Analysis, by Material Type
8. BPA Free Cans Market Analysis and Forecast, by Capacity
8.1. Introduction and Definition
8.2. Key Findings
8.3. BPA Free Cans Market Value Share Analysis, by Capacity
8.4. BPA Free Cans Market Size (US$ Bn) Forecast, by Capacity
8.5. BPA Free Cans Market Analysis, by Capacity
8.6. BPA Free Cans Market Attractiveness Analysis, by Capacity
9. BPA Free Cans Market Analysis and Forecast, by End Use Industry
9.1. Introduction and Definition
9.2. Key Findings
9.3. BPA Free Cans Market Value Share Analysis, by End Use Industry
9.4. BPA Free Cans Market Size (US$ Bn) Forecast, by End Use Industry
9.5. BPA Free Cans Market Analysis, by End Use Industry
9.6. BPA Free Cans Market Attractiveness Analysis, by End Use Industry
10. BPA Free Cans Market Analysis, by Region
10.1. BPA Free Cans Market Value Share Analysis, by Region
10.2. BPA Free Cans Market Size (US$ Bn) Forecast, by Region
10.3. BPA Free Cans Market Attractiveness Analysis, by Region
11. North America BPA Free Cans Market Analysis
11.1. Key Findings
11.2. North America BPA Free Cans Market Overview
11.3. North America BPA Free Cans Market Value Share Analysis, by Material Type
11.4. North America BPA Free Cans Market Forecast, by Material Type
11.4.1. Plastic
11.4.2. Aluminum
11.4.3. Steel
11.5. North America BPA Free Cans Market Value Share Analysis, by Capacity
11.6. North America BPA Free Cans Market Forecast, by Capacity
11.6.1. Less than 250 ml
11.6.2. 250-500 ml
11.6.3. 500-1000 ml
11.6.4. Above 1000 ml
11.7. North America BPA Free Cans Market Value Share Analysis, by End Use Industry
11.8. North America BPA Free Cans Market Forecast, by End Use Industry
11.8.1. Food and Beverage
11.8.2. Pharmaceuticals
11.8.3. Personal and Home care
11.8.4. Others
11.9. North America BPA Free Cans Market Value Share Analysis, by Country
11.10. North America BPA Free Cans Market Forecast, by Country
11.10.1. U.S.
11.10.2. Canada
11.11. North America BPA Free Cans Market Analysis, by Country
11.12. U.S. BPA Free Cans Market Forecast, by Material Type
11.12.1. Plastic
11.12.2. Aluminum
11.12.3. Steel
11.13. U.S. BPA Free Cans Market Forecast, by Capacity
11.13.1. Less than 250 ml
11.13.2. 250-500 ml
11.13.3. 500-1000 ml
11.13.4. Above 1000 ml
11.14. U.S. BPA Free Cans Market Forecast, by End Use Industry
11.14.1. Food and Beverage
11.14.2. Pharmaceuticals
11.14.3. Personal and Home care
11.14.4. Others
11.15. Canada BPA Free Cans Market Forecast, by Material Type
11.15.1. Plastic
11.15.2. Aluminum
11.16. Steel Canada BPA Free Cans Market Forecast, by Capacity
11.16.1. Less than 250 ml
11.16.2. 250-500 ml
11.16.3. 500-1000 ml
11.16.4. Above 1000 ml
11.17. Canada BPA Free Cans Market Forecast, by End Use Industry
11.17.1. Food and Beverage
11.17.2. Pharmaceuticals
11.17.3. Personal and Home care
11.17.4. Others
11.18. North America BPA Free Cans Market Attractiveness Analysis
11.18.1. By Material Type
11.18.2. By Capacity
11.18.3. By End Use Industry
11.19. PEST Analysis
11.20. Key Trends
11.21. Key Developments
12. Europe BPA Free Cans Market Analysis
12.1. Key Findings
12.2. Europe BPA Free Cans Market Overview
12.3. Europe BPA Free Cans Market Value Share Analysis, by Material Type
12.4. Europe BPA Free Cans Market Forecast, by Material Type
12.4.1. Plastic
12.4.2. Aluminum
12.4.3. Steel
12.5. Europe BPA Free Cans Market Value Share Analysis, by Capacity
12.6. Europe BPA Free Cans Market Forecast, by Capacity
12.6.1. Less than 250 ml
12.6.2. 250-500 ml
12.6.3. 500-1000 ml
12.6.4. Above 1000 ml
12.7. Europe BPA Free Cans Market Value Share Analysis, by End Use Industry
12.8. Europe BPA Free Cans Market Forecast, by End Use Industry
12.8.1. Food and Beverage
12.8.2. Pharmaceuticals
12.8.3. Personal and Home care
12.8.4. Others
12.9. Europe BPA Free Cans Market Value Share Analysis, by Country
12.10. Europe BPA Free Cans Market Forecast, by Country
12.10.1. Germany
12.10.2. U.K.
12.10.3. France
12.10.4. Italy
12.10.5. Spain
12.10.6. Rest of Europe
12.11. Europe BPA Free Cans Market Analysis, by Country
12.12. Germany BPA Free Cans Market Forecast, by Material Type
12.12.1. Plastic
12.12.2. Aluminum
12.12.3. Steel
12.13. Germany BPA Free Cans Market Forecast, by Capacity
12.13.1. Less than 250 ml
12.13.2. 250-500 ml
12.13.3. 500-1000 ml
12.13.4. Above 1000 ml
12.14. Germany BPA Free Cans Market Forecast, by End Use Industry
12.14.1. Food and Beverage
12.14.2. Pharmaceuticals
12.14.3. Personal and Home care
12.14.4. Others
12.15. U.K. BPA Free Cans Market Forecast, by Material Type
12.15.1. Plastic
12.15.2. Aluminum
12.15.3. Steel
12.16. U.K. BPA Free Cans Market Forecast, by Capacity
12.16.1. Less than 250 ml
12.16.2. 250-500 ml
12.16.3. 500-1000 ml
12.16.4. Above 1000 ml
12.17. U.K. BPA Free Cans Market Forecast, by End Use Industry
12.17.1. Food and Beverage
12.17.2. Pharmaceuticals
12.17.3. Personal and Home care
12.17.4. Others
12.18. France BPA Free Cans Market Forecast, by Material Type
12.18.1. Plastic
12.18.2. Aluminum
12.18.3. Steel
12.19. France BPA Free Cans Market Forecast, by Capacity
12.19.1. Less than 250 ml
12.19.2. 250-500 ml
12.19.3. 500-1000 ml
12.19.4. Above 1000 ml
12.20. France BPA Free Cans Market Forecast, by End Use Industry
12.20.1. Food and Beverage
12.20.2. Pharmaceuticals
12.20.3. Personal and Home care
12.20.4. Others
12.21. Italy BPA Free Cans Market Forecast, by Material Type
12.21.1. Plastic
12.21.2. Aluminum
12.21.3. Steel
12.22. Italy BPA Free Cans Market Forecast, by Capacity
12.22.1. Less than 250 ml
12.22.2. 250-500 ml
12.22.3. 500-1000 ml
12.22.4. Above 1000 ml
12.23. Italy BPA Free Cans Market Forecast, by End Use Industry
12.23.1. Food and Beverage
12.23.2. Pharmaceuticals
12.23.3. Personal and Home care
12.23.4. Others
12.24. Spain BPA Free Cans Market Forecast, by Material Type
12.24.1. Plastic
12.24.2. Aluminum
12.24.3. Steel
12.25. Spain BPA Free Cans Market Forecast, by Capacity
12.25.1. Less than 250 ml
12.25.2. 250-500 ml
12.25.3. 500-1000 ml
12.25.4. Above 1000 ml
12.26. Spain BPA Free Cans Market Forecast, by End Use Industry
12.26.1. Food and Beverage
12.26.2. Pharmaceuticals
12.26.3. Personal and Home care
12.26.4. Others
12.27. Rest of Europe BPA Free Cans Market Forecast, by Material Type
12.27.1. Plastic
12.27.2. Aluminum
12.27.3. Steel
12.28. Rest of Europe BPA Free Cans Market Forecast, by Capacity
12.28.1. Less than 250 ml
12.28.2. 250-500 ml
12.28.3. 500-1000 ml
12.28.4. Above 1000 ml
12.29. Rest Of Europe BPA Free Cans Market Forecast, by End Use Industry
12.29.1. Food and Beverage
12.29.2. Pharmaceuticals
12.29.3. Personal and Home care
12.29.4. Others
12.30. Europe BPA Free Cans Market Attractiveness Analysis
12.30.1. By Material Type
12.30.2. By Capacity
12.30.3. By End Use Industry
12.31. PEST Analysis
12.32. Key Trends
12.33. Key Developments
13. Asia Pacific BPA Free Cans Market Analysis
13.1. Key Findings
13.2. Asia Pacific BPA Free Cans Market Overview
13.3. Asia Pacific BPA Free Cans Market Value Share Analysis, by Material Type
13.4. Asia Pacific BPA Free Cans Market Forecast, by Material Type
13.4.1. Plastic
13.4.2. Aluminum
13.4.3. Steel
13.5. Asia Pacific BPA Free Cans Market Value Share Analysis, by Capacity
13.6. Asia Pacific BPA Free Cans Market Forecast, by Capacity
13.6.1. Less than 250 ml
13.6.2. 250-500 ml
13.6.3. 500-1000 ml
13.6.4. Above 1000 ml
13.7. Asia Pacific BPA Free Cans Market Value Share Analysis, by End Use Industry
13.8. Asia Pacific BPA Free Cans Market Forecast, by End Use Industry
13.8.1. Food and Beverage
13.8.2. Pharmaceuticals
13.8.3. Personal and Home care
13.8.4. Others
13.9. Asia Pacific BPA Free Cans Market Value Share Analysis, by Country
13.10. Asia Pacific BPA Free Cans Market Forecast, by Country
13.10.1. China
13.10.2. India
13.10.3. Japan
13.10.4. ASEAN
13.10.5. Rest of Asia Pacific
13.11. Asia Pacific BPA Free Cans Market Analysis, by Country
13.12. China BPA Free Cans Market Forecast, by Material Type
13.12.1. Plastic
13.12.2. Aluminum
13.12.3. Steel
13.13. China BPA Free Cans Market Forecast, by Capacity
13.13.1. Less than 250 ml
13.13.2. 250-500 ml
13.13.3. 500-1000 ml
13.13.4. Above 1000 ml
13.14. China BPA Free Cans Market Forecast, by End Use Industry
13.14.1. Food and Beverage
13.14.2. Pharmaceuticals
13.14.3. Personal and Home care
13.14.4. Others
13.15. India BPA Free Cans Market Forecast, by Material Type
13.15.1. Plastic
13.15.2. Aluminum
13.15.3. Steel
13.16. India BPA Free Cans Market Forecast, by Capacity
13.16.1. Less than 250 ml
13.16.2. 250-500 ml
13.16.3. 500-1000 ml
13.16.4. Above 1000 ml
13.17. India BPA Free Cans Market Forecast, by End Use Industry
13.17.1. Food and Beverage
13.17.2. Pharmaceuticals
13.17.3. Personal and Home care
13.17.4. Others
13.18. Japan BPA Free Cans Market Forecast, by Material Type
13.18.1. Plastic
13.18.2. Aluminum
13.18.3. Steel
13.19. Japan BPA Free Cans Market Forecast, by Capacity
13.19.1. Less than 250 ml
13.19.2. 250-500 ml
13.19.3. 500-1000 ml
13.19.4. Above 1000 ml
13.20. Japan BPA Free Cans Market Forecast, by End Use Industry
13.20.1. Food and Beverage
13.20.2. Pharmaceuticals
13.20.3. Personal and Home care
13.20.4. Others
13.21. ASEAN BPA Free Cans Market Forecast, by Material Type
13.21.1. Plastic
13.21.2. Aluminum
13.21.3. Steel
13.22. ASEAN BPA Free Cans Market Forecast, by Capacity
13.22.1. Less than 250 ml
13.22.2. 250-500 ml
13.22.3. 500-1000 ml
13.22.4. Above 1000 ml
13.23. ASEAN BPA Free Cans Market Forecast, by End Use Industry
13.23.1. Food and Beverage
13.23.2. Pharmaceuticals
13.23.3. Personal and Home care
13.23.4. Others
13.24. Rest of Asia Pacific BPA Free Cans Market Forecast, by Material Type
13.24.1. Plastic
13.24.2. Aluminum
13.24.3. Steel
13.25. Rest of Asia Pacific BPA Free Cans Market Forecast, by Capacity
13.25.1. Less than 250 ml
13.25.2. 250-500 ml
13.25.3. 500-1000 ml
13.25.4. Above 1000 ml
13.26. Rest of Asia Pacific BPA Free Cans Market Forecast, by End Use Industry
13.26.1. Food and Beverage
13.26.2. Pharmaceuticals
13.26.3. Personal and Home care
13.26.4. Others
13.27. Asia Pacific BPA Free Cans Market Attractiveness Analysis
13.27.1. By Material Type
13.27.2. By Capacity
13.27.3. By End Use Industry
13.28. PEST Analysis
13.29. Key Trends
13.30. Key Developments
14. Middle East & Africa BPA Free Cans Market Analysis
14.1. Key Findings
14.2. Middle East & Africa BPA Free Cans Market Overview
14.3. Middle East & Africa BPA Free Cans Market Value Share Analysis, by Material Type
14.4. Middle East & Africa BPA Free Cans Market Forecast, by Material Type
14.4.1. Plastic
14.4.2. Aluminum
14.4.3. Steel
14.5. Middle East & Africa BPA Free Cans Market Value Share Analysis, by Capacity
14.6. Middle East & Africa BPA Free Cans Market Forecast, by Capacity
14.6.1. Less than 250 ml
14.6.2. 250-500 ml
14.6.3. 500-1000 ml
14.6.4. Above 1000 ml
14.7. Middle East & Africa BPA Free Cans Market Value Share Analysis, by End Use Industry
14.8. Middle East & Africa BPA Free Cans Market Forecast, by End Use Industry
14.8.1. Food and Beverage
14.8.2. Pharmaceuticals
14.8.3. Personal and Home care
14.8.4. Others
14.9. Middle East & Africa BPA Free Cans Market Value Share Analysis, by Country
14.10. Middle East & Africa BPA Free Cans Market Forecast, by Country
14.10.1. GCC
14.10.2. South Africa
14.10.3. Rest of Middle East & Africa
14.11. Middle East & Africa BPA Free Cans Market Analysis, by Country
14.12. GCC BPA Free Cans Market Forecast, by Material Type
14.12.1. Plastic
14.12.2. Aluminum
14.12.3. Steel
14.13. GCC BPA Free Cans Market Forecast, by Capacity
14.13.1. Less than 250 ml
14.13.2. 250-500 ml
14.13.3. 500-1000 ml
14.13.4. Above 1000 ml
14.14. GCC BPA Free Cans Market Forecast, by End Use Industry
14.14.1. Food and Beverage
14.14.2. Pharmaceuticals
14.14.3. Personal and Home care
14.14.4. Others
14.15. South Africa BPA Free Cans Market Forecast, by Material Type
14.15.1. Plastic
14.15.2. Aluminum
14.15.3. Steel
14.16. South Africa BPA Free Cans Market Forecast, by Capacity
14.16.1. Less than 250 ml
14.16.2. 250-500 ml
14.16.3. 500-1000 ml
14.16.4. Above 1000 ml
14.17. South Africa BPA Free Cans Market Forecast, by End Use Industry
14.17.1. Food and Beverage
14.17.2. Pharmaceuticals
14.17.3. Personal and Home care
14.17.4. Others
14.18. Rest of Middle East & Africa BPA Free Cans Market Forecast, by Material Type
14.18.1. Plastic
14.18.2. Aluminum
14.18.3. Steel
14.19. Rest of Middle East & Africa BPA Free Cans Market Forecast, by Capacity
14.19.1. Less than 250 ml
14.19.2. 250-500 ml
14.19.3. 500-1000 ml
14.19.4. Above 1000 ml
14.20. Rest of Middle East & Africa BPA Free Cans Market Forecast, by End Use Industry
14.20.1. Food and Beverage
14.20.2. Pharmaceuticals
14.20.3. Personal and Home care
14.20.4. Others
14.21. Middle East & Africa BPA Free Cans Market Attractiveness Analysis
14.21.1. By Material Type
14.21.2. By Capacity
14.21.3. By End Use Industry
14.22. PEST Analysis
14.23. Key Trends
14.24. Key Developments
15. South America BPA Free Cans Market Analysis
15.1. Key Findings
15.2. South America BPA Free Cans Market Overview
15.3. South America BPA Free Cans Market Value Share Analysis, by Material Type
15.4. South America BPA Free Cans Market Forecast, by Material Type
15.4.1. Plastic
15.4.2. Aluminum
15.4.3. Steel
15.5. South America BPA Free Cans Market Value Share Analysis, by Capacity
15.6. South America BPA Free Cans Market Forecast, by Capacity
15.6.1. Less than 250 ml
15.6.2. 250-500 ml
15.6.3. 500-1000 ml
15.6.4. Above 1000 ml
15.7. South America BPA Free Cans Market Value Share Analysis, by End Use Industry
15.8. South America BPA Free Cans Market Forecast, by End Use Industry
15.8.1. Food and Beverage
15.8.2. Pharmaceuticals
15.8.3. Personal and Home care
15.8.4. Others
15.9. South America BPA Free Cans Market Value Share Analysis, by Country
15.10. South America BPA Free Cans Market Forecast, by Country
15.10.1. Brazil
15.10.2. Mexico
15.10.3. Rest of South America
15.11. South America BPA Free Cans Market Analysis, by Country
15.12. Brazil BPA Free Cans Market Forecast, by Material Type
15.12.1. Plastic
15.12.2. Aluminum
15.12.3. Steel
15.13. Brazil BPA Free Cans Market Forecast, by Capacity
15.13.1. Less than 250 ml
15.13.2. 250-500 ml
15.13.3. 500-1000 ml
15.13.4. Above 1000 ml
15.14. Brazil BPA Free Cans Market Forecast, by End Use Industry
15.14.1. Food and Beverage
15.14.2. Pharmaceuticals
15.14.3. Personal and Home care
15.14.4. Others
15.15. Mexico BPA Free Cans Market Forecast, by Material Type
15.15.1. Plastic
15.15.2. Aluminum
15.15.3. Steel
15.16. Mexico BPA Free Cans Market Forecast, by Capacity
15.16.1. Less than 250 ml
15.16.2. 250-500 ml
15.16.3. 500-1000 ml
15.16.4. Above 1000 ml
15.17. Mexico BPA Free Cans Market Forecast, by End Use Industry
15.17.1. Food and Beverage
15.17.2. Pharmaceuticals
15.17.3. Personal and Home care
15.17.4. Others
15.18. Rest of South America BPA Free Cans Market Forecast, by Material Type
15.18.1. Plastic
15.18.2. Aluminum
15.18.3. Steel
15.19. Rest of South America BPA Free Cans Market Forecast, by Capacity
15.19.1. Less than 250 ml
15.19.2. 250-500 ml
15.19.3. 500-1000 ml
15.19.4. Above 1000 ml
15.20. Rest of South America BPA Free Cans Market Forecast, by End Use Industry
15.20.1. Food and Beverage
15.20.2. Pharmaceuticals
15.20.3. Personal and Home care
15.20.4. Others
15.21. South America BPA Free Cans Market Attractiveness Analysis
15.21.1. By Material Type
15.21.2. By Capacity
15.21.3. By End Use Industry
15.22. PEST Analysis
15.23. Key Trends
15.24. Key Developments
16. Company Profiles
16.1. Market Share Analysis, by Company
16.2. Competition Matrix
16.2.1. Competitive Benchmarking of key players by price, presence, market share, Applications and R&D investment
16.2.2. New Product Launches and Product Enhancements
16.2.3. Market Consolidation
16.2.3.1. M&A by Regions, Investment and Applications
16.2.3.2. M&A Key Players, Forward Integration and Backward
Integration
16.3. Company Profiles: Key Players
16.3.1. CAN-PACK Group
16.3.1.1. Company Overview
16.3.1.2. Financial Overview
16.3.1.3. Product Portfolio
16.3.1.4. Business Strategy
16.3.1.5. Recent Developments
16.3.1.6. Manufacturing Footprint
16.3.2. Ball Corporation
16.3.3. Crown Holdings Inc.
16.3.4. Toyo Seikan Co. Ltd.
16.3.5. Ardagh Group
16.3.6. HUBER Packaging Group GmbH
16.3.7. CCL Industries Inc.
16.3.8. PPG Industries Inc.
16.3.9. Silgan Containers LLC
16.3.10. DowDupont Inc.
16.3.11. Kian Joo Group
16.3.12. CPMC Holdings Limited
16.3.13. The Valspar Corporation
16.3.14. Kangnam Jevisco Co., Ltd
16.3.15. The Sherwin-Williams Company
16.3.16. MARIGOLD HEALTH FOODS LIMITED
16.3.17. The Coco Coast Company
16.3.18. West End Traders, LLC
17. Primary Key Insights

 To know about the Research Methodology :- Request Free Sample Report