
Ferroelectric Materials Market Size – Industry Structure Evaluation, Demand Drivers Analysis, Regional Growth Analysis and Identification, Competitive Positioning Review & Global Market Size Forecast to 2032
Overview
The Ferroelectric Materials Market was valued at USD 4.6 Bn. in 2024, and the total revenue of the Ferroelectric Materials Market is expected to grow at a CAGR of 8.98% from 2025 to 2032, reaching nearly USD 9.15 Bn. by 2032. Surge in EV demand and 2D material innovation drives next-gen energy solutions.
Ferroelectric Materials Market Overview
Ferroelectric Materials Market is a representative of certain materials that has an impulsive electric polarization that is inverted by the application of an external electric field. The ferroelectrics are pyroelectric, with the property that their natural electrical polarization is reversible. The materials demonstrating the phenomenon of Ferroelectricity are called Ferroelectric Materials.
Global Ferroelectric Materials Market’s main Companies are Sakai Chemical, Nippon Chemical, Ferro, Fuji Titanium, Shandong Sinocera, etc. The top five companies grasp a segment above 75%. Japan is the largest market, with a share of 35%. This unit delivers the possibility of different segments and applications that possibly impact the Ferroelectric Materials Market during the forecast period. This segment provides a study of the volume of production in approximately the global Ferroelectric Materials Market and each type from 2024 to 2030. Ferroelectricity is used in profitable industries like automotive, electronics, and aerospace.
The worldwide growth in the demand for electric applications results in an increase in the demand for the Ferroelectric Materials Market in the forecast period. In the region such as the U.S. and Japan, the development of technology leads to the demand of the market in countless marketable and industrial sections. Ferroelectric Materials Market is a progressive material that is used in different commercial electric applications such as automotive, smart home electric appliances, the aerospace industry, and other electronic segments as well. The commercialization of piezoelectric materials in the field of electric application inclines to the advanced demand for ferroelectricity materials benefits the devices affordable, smaller, and consumer friendly. Increase in the invention of technologies in the practice materials in the electric field.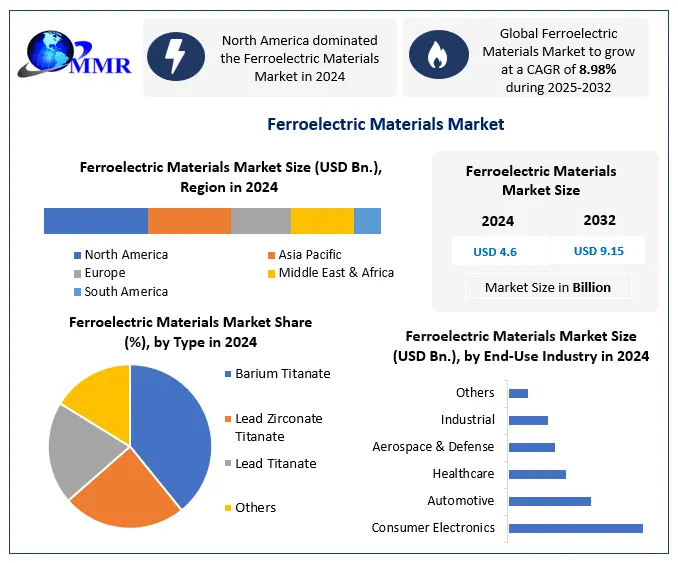 To know about the Research Methodology :- Request Free Sample Report
Competitive Landscape
Sakai Chemical
The Sakai Chemical include the intellectual property department, This department plays an important role in guaranteeing remaining operations and development by supporting the implementation of intellectual property strategies. The Onahama Development Department involves in application development, quality improvement efforts, and development of industrial methods for products such as titanium dioxide, barium sulfate, barium carbonate, zinc oxide, and barium titanate produced at the Onahama Manufacturing Site located in Iwaki City, Fukushima Prefecture. The R & D department encourage the development of catchphrases that underline competitive advantages and development concepts teamwork with outside organizations is also important, and the department plays a role in finding potential targets for joint research with industry, government, and academia.
Ferro
The developments has achieved in the growth of ferroelectric structures during the forecast period. The development of epitaxial growth methods, it is now possible to make high-quality and ultrathin Ferroelectric materials that are single-crystal and defect free. . The growth method has to be sensibly selected to obtain a certain film with desired properties. In this section, the growth methods of Ferroelectric Materials are discussed and some comparisons will be made among them. At the primary stage of thin Ferroelectric Materials growth, which is the so-called nucleation stage, plentiful vapor atoms or molecules condense and undergo surface diffusion and migration under the drive of both their self-energy and substrate thermal energy, then move to a stable position on the substrate.
Ferroelectric Materials Market Dynamics:
Ferroelectric Materials Market Drivers
Increased demand for smart electric devices in the commercial and industrial sector
Ferroelectric Materials Market are also known as function materials. Ferroelectricity materials are used in countless profitable and industrial sectors. Commercially it is used in numerous electric applications in the industries like automotive, manufacturing, smart devices, etc. Smart devices are one of the important applications that used ferroelectricity material as their electric application. The continuing technological inventions in smart electronic devices and the improved demand for smart electronic devices in profitable and national sectors has resulted in the growth of the Ferroelectric Materials Market.
Piezoelectric sensors are used in pharmaceutical industries in ultrasonic imaging and ultrasonic procedure. Structural health monitoring is one of the popular fields in piezoelectric technology. Structural health monitoring is widely assessed by the atmosphere industry as a method to progress the security and consistency of aircraft constructions and decrease working costs. Constructed in sensor networks on an aircraft structure deliver critical information concerning the disorder, damage state, and provision environment of the structure. The different kinds of transducers used for Structural health monitoring, and piezoelectric materials are widely used because they are employed as either actuators or sensors due to their piezoelectric effect and vice versa.
Ferroelectric Materials Market Restraints
Higher costs and lack of awareness
Ferroelectric Materials Market has various properties that benefit numerous commercial and domestic industries. There are some preventive issues that are hampering the market from growth. There is a lack of awareness of the technologies of ferroelectricity materials in various regions. The higher cost of materials and technology is one of the limiting factors for the Ferroelectric Materials Market. Ferroelectric materials are naturally produced using complex manufacturing processes. The requirement of specialized equipment and expertise for the development enhances the cost of the materials, this lead to advanced production costs.
he development of new and innovative ferroelectric materials requires significant research, which is costly. High cost of manufacturing boundary end-users from entering the market. The batteries and electrochemical capacitors, energy is stored and generated in ferroelectric materials through reorientable ionic polarization. These materials has a storage life of magnitude longer than that of batteries and electrochemical capacitors. Under adiabatic compression, ferroelectrics has used to produce high electric charge density. The substance for the formation of compact, lightweight ferroelectric power sources that are accomplished of producing high voltage, high current, and megawatt power levels for brief intervals of time.
Ferroelectric Materials Market Opportunities
Advancement in the technology of 2D ferroelectric material
The two-dimensional (2D) Ferroelectric Materials Market is hopeful for use in high-performance nanoelectronic devices due to the non-volatility, high storage density, low energy cost and short response time originating from their bistable and switchable polarization states. The developing advancement in the 2D ferroelectric material, the future of nanoelectronics is highly reliant on the novel class of high-dimensional materials. To the subject of the application and novel technologies, Van der Waals ferroelectrics has huge future opportunities for nanotechnologies. The development in technologies of the VDW Ferroelectric Materials Market and widely developing. The development functionality of multiple orders and multiferroicity.
2D materials has emerged in recent years to provide possible solutions for the dilemma due to their outstanding optical, electrical, thermal, mechanical, and ferroelectric properties that do not exist in the majority of materials. In particular, 2D ferroelectric materials with spotless surfaces and stable polarization are promising for electronic device applications. Two dimensions projected for the fabrication of ferroelectric devices and great successes has achieved at the laboratory level. The practical applications are still delayed by inherent issues including depolarization and structural instabilities when the thickness is reduced to atomic scale due to surface reconstruction and hanging bonds.
Ferroelectric Materials Market Segment Analysis
Based on Type, the Barium Titanate segment dominated the Ferroelectric Materials Market in the year 2024 and is expected to do the same during the forecast period. The barium titanate has the largest market share in 2024. Barium titanate is commercially considered a ferroelectric and piezoelectric material. It is generally used in the electronics industry. In the Ferroelectric Materials Market, barium titanate is used in the multilayer dielectric ceramic capacitor. Barium titanate Ceramic is frequently decreased in an atmosphere that increases the conductivity of the ceramic and leads to lifelong reduction. The Ferroelectric Materials Market is largely driven by the electric vehicle demand in the commercial sectors. The increasing government apprehension about global warming through the excess use of petrol and diesel vehicles results in a greater demand for electric vehicles and an increasing demand for barium titanate.
Based on the Price Point, The Premium segment dominates the Ferroelectric Materials Market in the year 2023 and is expected to do the same during the forecast period. There are some preventive issues that are hampering the market from growth. The higher cost of materials and technology is one of the limiting factors for the Ferroelectric Materials Market. Ferroelectric materials are naturally produced using complex manufacturing processes. The requirement of specialized equipment and expertise for the development enhances the cost of the materials, this lead to advanced production costs. The development functionality of multiple orders and multiferroicity.
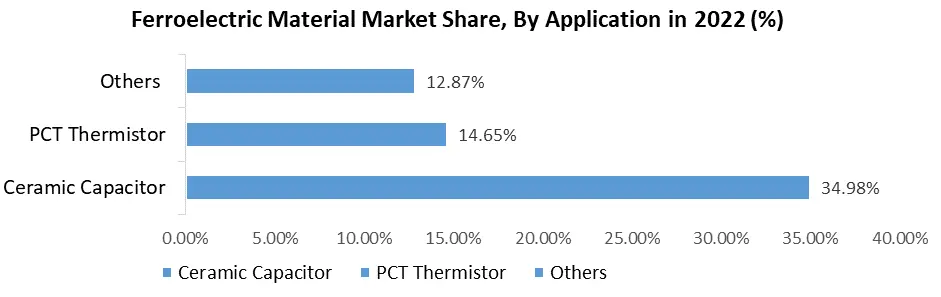
2D materials has emerged in recent years to provide possible solutions for the dilemma due to their outstanding optical, electrical, thermal, mechanical, and ferroelectric properties that do not exist in the majority of materials. In particular, 2D ferroelectric materials with spotless surfaces and stable polarization are promising for electronic device applications. The substance for the formation of compact, lightweight ferroelectric power sources that are accomplished of producing high voltage, high current, and megawatt power levels for brief intervals of time.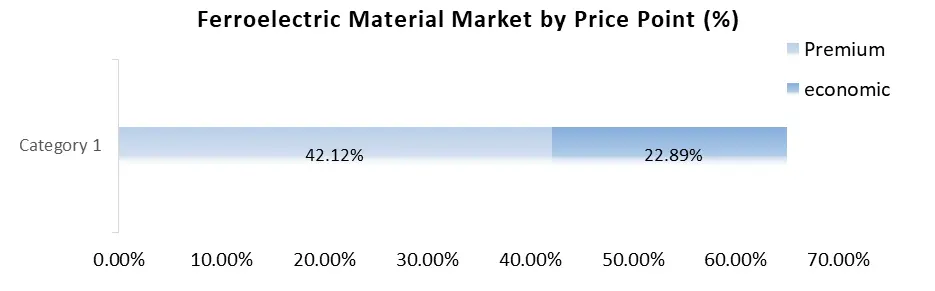 Based on the Application, the Ceramic Capacitor segment dominated the Ferroelectric Materials Market in the year 2024 and is expected to do the same during the forecast period. A ceramic capacitor is complete of granules of ferroelectric materials. The maximum use of ferroelectric material in industries is in the multilayer ceramic capacitor. The increasing demand in the different industries like automotive, consumer goods, energy, power and telecommunication, etc. Increasing demand for automotive and increasing existing standards result in a greater demand in the market.
The ceramic capacitor is a fixed-value capacitor where the ceramic material acts as the dielectric. It is constructed of two or more irregular layers of ceramic, and a metal layer substitutes as the electrodes. The composition of the ceramic material describes the electrical behaviour and, consequently, applications. The Ceramic capacitors, particularly multilayer ceramic capacitors, are the most produced and used capacitors in the Ferroelectric Materials Market, equipment that incorporates approximately one trillion (1012) pieces per year. The PTC thermistor is another emerging segment of the global ferroelectric materials market. The precise temperature detection and regulator offered by ferroelectric materials in PTC thermistors is considered to continue the development of the segment.
Ferroelectric Materials Market Regional Insights
North America has the largest market share in the Ferroelectric Materials Market .North America is continue its supremacy during the forecast period. There is continuous growth in technological invention in the region which is dominate the market during the forecast period. With increasing infrastructure and the already availability of various industries such as automotive, Pharmaceuticals, building and materials, construction, consumer goods, etc. the demand for ferroelectric materials in these industries will probable increase the demand of the market. The increasing demand for the electric vehicle in the United State region is anticipated for the development of the Ferroelectric Materials Market in this region.
Asia-pacific region is a significant increase in the growth of the ferroelectric material market during the forecast period. An increase in development and increasing living standards will improvement the demand in the market. The increase in global warming in the environment in the Asia Pacific results in a greater demand for electric vehicles. Which tends to the increasing demand for the Ferroelectric Materials Market. Europe is another developing marketplace for ferroelectric materials, countries including, Germany and United Kingdom are to contribute the largest share of the market’s growth during the forecast period. The continuous technological innovations in the region are predicted to offer a excess of opportunities for the market’s growth in Europe during the forecast period.
Ferroelectric Materials Market Scope: Inquire before buying
| Ferroelectric Materials Market | |||
|---|---|---|---|
| Report Coverage | Details | ||
| Base Year: | 2024 | Forecast Period: | 2025-2032 |
| Historical Data: | 2019 to 2024 | Market Size in 2024: | USD 4.6 Bn. |
| Forecast Period 2025 to 2032 CAGR: | 8.98% | Market Size in 2032: | USD 9.15 Bn. |
| Segments Covered: | by Type | Barium Titanate Lead Zirconate Titanate Lead Titanate Others |
|
| by Application | Ceramic Capacitor PCT Thermistor Piezoelectric Devices FeRAM Actuators & Sensors Others |
||
| by End-Use Industry | Consumer Electronics Automotive Healthcare Aerospace & Defense Industrial Others |
||
Ferroelectric Materials Market by Region
North America (United States, Canada, and Mexico)
Europe (UK, France, Germany, Italy, Spain, Sweden, Austria, and the Rest of Europe)
Asia Pacific (China, South Korea, Japan, India, Australia, Indonesia, Malaysia, Vietnam, Taiwan, Bangladesh, Pakistan, and Rest of APAC)
Middle East and Africa (South Africa, GCC, Egypt, Nigeria, and the Rest of ME&A)
South America (Brazil, Argentina Rest of South America)
Ferroelectric Materials Market Key Players
1. Sakai Chemical
2. Nippon Chemical
3. Ferro
4. Fuji Titanium
5. Shandong Sinocera
6. KCM
7. Shanghai Dian Yang
8. Kyocera Corporation
9. Murata Manufacturing Co., Ltd.
10. TDK Corporation
11. Ferro Corporation
12. Kemet Corporation
13. PI Ceramic GmbH
14. CeramTec GmbH
15. Vishay Intertechnology, Inc.
16. Morgan Advanced Materials plc
17. APC International, Ltd.
18. Noliac A/S
19. EPCOS AG
20. Central Electronics Limited
21. Piezo Kinetics, Inc.
22. TRS Technologies, Inc.
23. Physik Instrumente (PI) GmbH & Co. KG
24. APC International, Ltd.
25. CETC (China Electronics Technology Group Corporation)
26. Exelis Inc. (Harris Corporation)
27. Ferroperm Piezoceramics A/S
Frequently Asked Questions:
1] What segments are covered in the Ferroelectric Materials Market report?
Ans. The segments covered in the Ferroelectric Materials Market report are based on Type, End-Use Industry, Application, and Region.
2] Which region is expected to hold the highest share in the Ferroelectric Materials Market?
Ans. The North America region is expected to hold the highest share of the Ferroelectric Materials Market.
3] What is the market size of the Ferroelectric Materials Market by 2032?
Ans. The market size of the Ferroelectric Materials Market by 2032 is expected to reach USD 9.15 Bn.
4] What is the forecast period for the Ferroelectric Materials Market?
Ans. The forecast period for the Ferroelectric Materials Market is 2025-2032.
5] What was the market size of the Ferroelectric Materials Market in 2024?
Ans. The market size of the Ferroelectric Materials Market in 2024 was valued at USD 4.6 Bn.