Farrier Products Market: Global Industry Analysis and Forecast (2024-2030)

The Farrier Products Market size was valued at USD 182.9 Million in 2023 and the total Farrier Products revenue is expected to grow at a CAGR of 5.6 % from 2024 to 2030, reaching nearly USD 267.83 Million.

Farrier Products Market Overview

The Farrier Products Market is a dynamic and evolving industry, driven by the demand for quality products and services in the equine industry. Farriers play a crucial role in maintaining the health and well-being of horses by providing hoof care and shoeing services. The market for farrier products includes a wide range of tools, equipment, and supplies used by farriers in their day-to-day work. The market has experienced steady growth. The increasing popularity of horse-related activities such as horse racing, equestrian sports, and leisure riding has contributed to the demand for farrier services and products. The growing awareness among horse owners about the importance of regular hoof care and the impact of proper shoeing on horse performance has further fuelled the market growth. Farrier Products Market
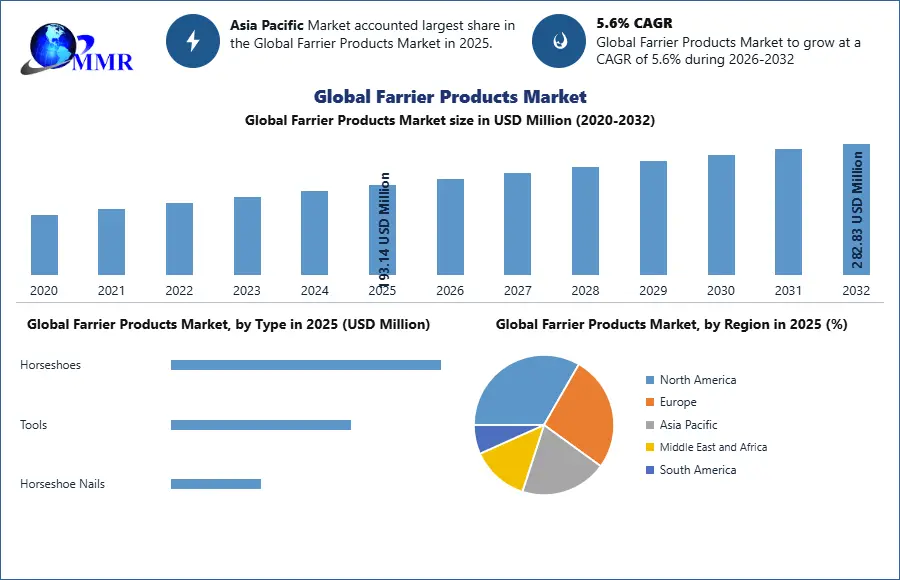
To know about the Research Methodology :- Request Free Sample Report One of the key factors driving the farrier products market is the continuous innovation and development of new and advanced products. Manufacturers are constantly introducing improved tools and equipment that offer better performance, durability, and efficiency. These advancements not only enhance the work of farriers but also contribute to the overall health and comfort of the horses. Geographically, the demand for farrier products varies across regions. Different countries have their own preferences and requirements when it comes to farrier tools and equipment. For example, regions with a higher concentration of horse racing activities may have a greater demand for specialized racing plates and related products. Similarly, regions with a strong equestrian culture may prioritize products that cater to specific disciplines such as dressage or show jumping. In terms of distribution channels, the farrier products market utilizes a combination of online and offline channels. Online platforms provide convenience and accessibility for customers to browse and purchase a wide range of farrier products. E-commerce platforms and specialized online retailers play a significant role in reaching a global customer base. Offline retail establishments such as equestrian supply stores, farrier supply shops, and agricultural equipment retailers also contribute to the dissemination of farrier products, especially at the local level.

Farrier Products Market Research Methodology

The research on the farrier products market involved the use of both primary and secondary data sources to collect relevant information. The study examined all possible factors influencing the market in-depth and validated the findings through primary research. The impact of inflation, economic downturns, regulatory & policy changes, and other variables was factored into the market forecast to provide valuable conclusions. To estimate the Farrier Products industry size and forecast, the bottom-up approach and multiple data triangulation methodologies were utilized. The percentage splits, market shares, and breakdowns of the segments were derived based on weights assigned to each segment's utilization rate and average sale price. The country-wise analysis of the overall market and its sub-segments was based on the percentage adoption or utilization of the given market size in the respective region or country. The major players in the farrier products industry were identified through secondary research based on indicators such as market revenue, price, services offered, advancements, mergers, and acquisitions. Extensive primary research was conducted to verify and confirm the crucial numbers arrived at after comprehensive market engineering and calculations for market statistics, market size estimations, market forecasts, market breakdown, and data triangulation External and internal factors that were expected to affect the farrier products market positively or negatively were analyzed to give decision-makers a clear view of the industry's future. The report also provided a clear representation of competitive analysis of key players by price, financial position, growth strategies, and regional presence in the market.

Farrier Products Market Dynamics:

Farrier Products Market Drivers The growing popularity of horse-related activities, such as horse racing, equestrian sports, and recreational riding, has fuelled the demand for farrier services and products. Horse owners' rising awareness regarding the importance of regular hoof care and proper shoeing's impact on horse well-being has further propelled Farrier Products market growth. Continuous innovation and development of new and advanced farrier products are driving factors in the market. Manufacturers are constantly introducing improved tools and equipment that offer enhanced performance, durability, and efficiency. The demand for farrier products may vary across different regions due to unique preferences and requirements. For example, regions with a higher concentration of horse racing activities may have a greater demand for specialized racing plates and related products. Similarly, regions with a strong equestrian culture may prioritize products that cater to specific disciplines like dressage or show jumping. The demand for farrier products is positively influenced by factors such as a growing horse population, increasing awareness of proper hoof care, and ongoing product innovation. Farrier Products Market Restraints The Farrier Products Market faces certain restraints that impact its growth and potential. These include safety concerns, high costs, and maintenance and repair challenges. Safety concerns arise due to the nature of the products used in farrier services, such as sharp tools and equipment. High costs also act as a restraint in the market. Quality farrier tools and equipment often come at a higher price point due to their durability and specialized features. This limit the market potential for farrier products, particularly for customers on a tight budget. Manufacturers and suppliers need to strike a balance between quality and affordability to cater to a wide range of customers. Maintenance and repair requirements are another factor that pose challenges in the farrier products market. Farrier tools and equipment need regular maintenance to ensure their effectiveness and longevity. Manufacturers address this restraint by providing guidance on maintenance practices and offering reliable repair services. Certain regulatory restrictions or guidelines imposed by governing bodies or associations impact the farrier products market. These regulations may include requirements for product standards, certifications, or licensing for farriers. Farrier Products Market Opportunities The Farrier Products Market has the potential to expand its distribution and reach a broader audience through the growing popularity of e-commerce platforms. Manufacturers should leverage e-commerce sales to effectively and affordably promote their products worldwide. By utilizing online channels, they tap into a larger customer base and increase market penetration. As the use of smart devices such as smartphones and tablets become more prevalent, people are becoming accustomed to purchasing smart products. Farrier products market manufacturers capitalize on this trend by providing goods that work seamlessly with a variety of smart devices. This includes digital tools, apps, or software solutions that enhance the efficiency and convenience of farrier services. Farrier products, such as portable hoof care tools or lightweight shoeing equipment, cater to the needs of horse owners and professionals who travel frequently with their horses.

Farrier Products Market Trends

In the Farrier Products Market, several market trends are shaping the industry landscape. One notable trend is the increasing demand for lightweight and durable materials in farrier products. Customers seek farrier tools and equipment that offer enhanced durability and protection for efficient and reliable use. Manufacturers are responding to this trend by incorporating lightweight and robust materials such as high-grade steel and advanced alloys. Another trend observed in the farrier products industry is the growing preference for customization options. Customers are seeking farrier tools and equipment that be tailored to their specific wants and needs. Manufacturers are addressing this trend by offering customization options such as interchangeable parts, adjustable features, and personalized branding. Sustainability and eco-friendliness are also gaining traction in the farrier products market. Manufacturers are recognizing this trend and are incorporating sustainable practices into their production processes. This includes using eco-friendly materials, implementing energy-efficient manufacturing methods, and reducing waste generation. By offering sustainable farrier products, manufacturers attract environmentally conscious customers and align with their values.

Farrier Products Market Segment Analysis:

Segmentation analysis in the farrier products market involves dividing the market into distinct segments based on various criteria to better understand customer preferences and target specific groups. The segmentation be based on product type, such as horseshoes, farrier tools, or hoof care products, to cater to different customer needs. Another segmentation aspect is based on end-users, such as professional farriers, veterinary clinics, or horse owners, which helps in tailoring products and marketing strategies accordingly. Additionally, segmenting by distribution channel, such as online retail or specialty stores, enables companies to optimize their distribution strategies. Geographical segmentation allows for localized analysis of market trends, while price range segmentation helps identify customer affordability and target different market segments effectively. Through segment analysis, companies gain insights into the diverse customer base and develop targeted strategies to meet their specific needs, thereby driving growth and success in the Farrier Products Market.

Farrier Products Market Regional Insights:

North America North America is a significant farrier products market, with the United States and Canada playing a crucial role in the region. The demand for farrier products in North America is driven by the presence of a substantial horse population and a strong equestrian culture. The region has a well-established farrier industry, with skilled professionals offering hoof care and shoeing services. The increasing awareness among horse owners about the importance of proper hoof care and its impact on horse health and performance is driving the demand for farrier products in the region. Europe Europe also represents a significant farrier products market, with countries like the UK, Germany, France, and Italy leading the industry. The region's rich equestrian heritage and the presence of prestigious horse events drive the demand for farrier services and products. The increasing focus on horse welfare and performance further fuels the market growth in Europe. Asia Pacific Asia Pacific is a substantial farrier products market, with countries such as China, Japan, South Korea, and India playing a significant role. The growing popularity of horse racing, equestrian sports, and recreational riding in the region drives the demand for farrier services and products. The rising disposable income and the expanding middle-class population contribute to the market growth in Asia Pacific. Middle East and Africa Middle East and Africa region is an emerging farrier products market, with countries like the UAE, Saudi Arabia, and South Africa witnessing growth in the industry. The region's increasing interest in equestrian activities, along with the development of equestrian facilities and events, drives the demand for farrier products. The growing awareness of horse care and welfare further fuels the market growth in the Middle East and Africa. South America South America is an emerging farrier products market, with Brazil being the largest market in the region. The growing interest in equestrian activities, such as horse racing and recreational riding, is fuelling the demand for farrier services and products. The region's expanding middle-class population and rising disposable income contribute to the growth of the farrier products market in South America.

Farrier Products Market Scope: Inquire before buying

Global Farrier Products Market
Report Coverage Details
Base Year: 2023 Forecast Period: 2024-2030
Historical Data: 2018 to 2023 Market Size in 2023: US $ 182.9 Mn.
Forecast Period 2024 to 2030 CAGR: 5.6% Market Size in 2030: US $ 267.83 Mn.
Segments Covered: by Product Type Horseshoes Nails Rasps Hoof Knives Anvils Hammers Hoof Stands Hoof Care Solutions
by Price Range Low Medium High
by End User Professional Farriers Veterinary Clinics Equestrian Centers Horse Owners
by Distribution Channel Online Retail E-Commerce Platforms Specialty Stores Veterinary Supply Stores Direct Sales

Farrier Products Market by Region:

North America (United States, Canada, and Mexico) Europe (UK, France, Germany, Italy, Spain, Sweden, Austria, and the Rest of Europe) Asia Pacific (China, South Korea, Japan, India, Australia, Indonesia, Malaysia, Vietnam, Taiwan, Bangladesh, Pakistan, and the Rest of APAC) Middle East and Africa (South Africa, GCC, Egypt, Nigeria, and the Rest of ME&A) South America (Brazil, Argentina Rest of South America)

Farrier Products Key Players

North America: 1. Diamond Farrier Co. (United States) 2. Capewell Components Company (United States) 3. Anvil Brand (United States) 4. Vettec Hoof Care (United States) 5. NC Tool Co. (United States) Europe: 1. Mustad Hoofcare (Norway) 2. Strasser Huftechnik (Germany) 3. Kerckhaert Horseshoe Factory (Netherlands) 4. MNC Farrier Supplies (United Kingdom) 5. Jim Blurton Farrier Tools (United Kingdom) 6. Kerkhaert Horseshoe (Belgium) Asia Pacific: 1. Burgess Farrier Supplies (Australia) 2. Embee Sunway (India) 3. DS Farrier Solutions (Australia) 4. Polyflex Horseshoes (Australia) 5. SoundHorse Technologies (New Zealand) Middle East and Africa: 1. Polyshoe (South Africa) 2. AJ Farrier Supplies (South Africa) 3. Izmir Horseshoes (Turkey) 4. Gévelot SA (France) South America: 1. Mustad Argentina (Argentina) 2. Horseshop Brasil (Brazil) 3. Hufschmied Jacaré (Brazil) 4. Caballería Herrería (Argentina) 5. CB Products (Brazil) FAQs: 1. What are the growth drivers for the Farrier Products Market? Ans. Continuous innovation and development of new and advanced products is expected to be the major driver for the Farrier Products Market. 2. What is the major restraint for the Farrier Products Market growth? Ans. Safety concerns, high costs, and maintenance and repair challenges are expected to be the major restraining factor for the Farrier Products Market growth. 3. Which region is expected to lead the global Farrier Products Market during the forecast period? Ans. North America is expected to lead the global Farrier Products Market during the forecast period. 4. What is the projected market size & growth rate of the Farrier Products Market? Ans. The Farrier Products Market size was valued at USD 182.9 Million in 2023 and the total Farrier Products revenue is expected to grow at a CAGR of 5.6% from 2024 to 2030, reaching nearly USD 267.83 Million. 5. What segments are covered in the Farrier Products Market report? Ans. The segments covered in the Farrier Products Market report are Product Type, Price Range, End-User, Distribution Channel and Region.
1. Farrier Products Market Introduction 1.1. Study Assumption and Market Definition 1.2. Scope of the Study 1.3. Executive Summary 2. Farrier Products Market: Dynamics 2.1. Farrier Products Market Trends by Region 2.1.1. North America Farrier Products Market Trends 2.1.2. Europe Farrier Products Market Trends 2.1.3. Asia Pacific Farrier Products Market Trends 2.1.4. Middle East and Africa Farrier Products Market Trends 2.1.5. South America Farrier Products Market Trends 2.2. Farrier Products Market Dynamics by Region 2.2.1. North America 2.2.1.1. North America Farrier Products Market Drivers 2.2.1.2. North America Farrier Products Market Restraints 2.2.1.3. North America Farrier Products Market Opportunities 2.2.1.4. North America Farrier Products Market Challenges 2.2.2. Europe 2.2.2.1. Europe Farrier Products Market Drivers 2.2.2.2. Europe Farrier Products Market Restraints 2.2.2.3. Europe Farrier Products Market Opportunities 2.2.2.4. Europe Farrier Products Market Challenges 2.2.3. Asia Pacific 2.2.3.1. Asia Pacific Farrier Products Market Drivers 2.2.3.2. Asia Pacific Farrier Products Market Restraints 2.2.3.3. Asia Pacific Farrier Products Market Opportunities 2.2.3.4. Asia Pacific Farrier Products Market Challenges 2.2.4. Middle East and Africa 2.2.4.1. Middle East and Africa Farrier Products Market Drivers 2.2.4.2. Middle East and Africa Farrier Products Market Restraints 2.2.4.3. Middle East and Africa Farrier Products Market Opportunities 2.2.4.4. Middle East and Africa Farrier Products Market Challenges 2.2.5. South America 2.2.5.1. South America Farrier Products Market Drivers 2.2.5.2. South America Farrier Products Market Restraints 2.2.5.3. South America Farrier Products Market Opportunities 2.2.5.4. South America Farrier Products Market Challenges 2.3. PORTER’s Five Forces Analysis 2.4. PESTLE Analysis 2.5. Technology Roadmap 2.6. Regulatory Landscape by Region 2.6.1. North America 2.6.2. Europe 2.6.3. Asia Pacific 2.6.4. Middle East and Africa 2.6.5. South America 2.7. Key Opinion Leader Analysis For Farrier Products Industry 2.8. Analysis of Government Schemes and Initiatives For Farrier Products Industry 2.9. Farrier Products Market Trade Analysis 2.10. The Global Pandemic Impact on Farrier Products Market 3. Farrier Products Market: Global Market Size and Forecast by Segmentation by Demand and Supply Side (by Value in USD Million) 2023-2030 3.1. Farrier Products Market Size and Forecast, by Product Type (2023-2030) 3.1.1. Horseshoes 3.1.2. Nails 3.1.3. Rasps 3.1.4. Hoof Knives 3.1.5. Anvils 3.1.6. Hammers 3.1.7. Hoof Stands 3.1.8. Hoof Care Solutions 3.2. Farrier Products Market Size and Forecast, by Price Range (2023-2030) 3.2.1. Low 3.2.2. Medium 3.2.3. High 3.3. Farrier Products Market Size and Forecast, by End User (2023-2030) 3.3.1. Professional Farriers 3.3.2. Veterinary Clinics 3.3.3. Equestrian Centers 3.3.4. Horse Owners 3.4. Farrier Products Market Size and Forecast, by Distribution Channel (2023-2030) 3.4.1. Online Retail 3.4.2. E-Commerce Platforms 3.4.3. Specialty Stores 3.4.4. Veterinary Supply Stores 3.4.5. Direct Sales 3.5. Farrier Products Market Size and Forecast, by Region (2023-2030) 3.5.1. North America 3.5.2. Europe 3.5.3. Asia Pacific 3.5.4. Middle East and Africa 3.5.5. South America 4. North America Farrier Products Market Size and Forecast by Segmentation (by Value in USD Million) 2023-2030 4.1. North America Farrier Products Market Size and Forecast, by Product Type (2023-2030) 4.1.1. Horseshoes 4.1.2. Nails 4.1.3. Rasps 4.1.4. Hoof Knives 4.1.5. Anvils 4.1.6. Hammers 4.1.7. Hoof Stands 4.1.8. Hoof Care Solutions 4.2. North America Farrier Products Market Size and Forecast, by Price Range (2023-2030) 4.2.1. Low 4.2.2. Medium 4.2.3. High 4.3. North America Farrier Products Market Size and Forecast, by End User (2023-2030) 4.3.1. Professional Farriers 4.3.2. Veterinary Clinics 4.3.3. Equestrian Centers 4.3.4. Horse Owners 4.4. North America Farrier Products Market Size and Forecast, by Distribution Channel (2023-2030) 4.4.1. Online Retail 4.4.2. E-Commerce Platforms 4.4.3. Specialty Stores 4.4.4. Veterinary Supply Stores 4.4.5. Direct Sales 4.5. North America Farrier Products Market Size and Forecast, by Country (2023-2030) 4.5.1. United States 4.5.1.1. United States Farrier Products Market Size and Forecast, by Product Type (2023-2030) 4.5.1.1.1. Horseshoes 4.5.1.1.2. Nails 4.5.1.1.3. Rasps 4.5.1.1.4. Hoof Knives 4.5.1.1.5. Anvils 4.5.1.1.6. Hammers 4.5.1.1.7. Hoof Stands 4.5.1.1.8. Hoof Care Solutions 4.5.1.2. United States Farrier Products Market Size and Forecast, by Price Range (2023-2030) 4.5.1.2.1. Low 4.5.1.2.2. Medium 4.5.1.2.3. High 4.5.1.3. United States Farrier Products Market Size and Forecast, by End User (2023-2030) 4.5.1.3.1. Professional Farriers 4.5.1.3.2. Veterinary Clinics 4.5.1.3.3. Equestrian Centers 4.5.1.3.4. Horse Owners 4.5.1.4. United States Farrier Products Market Size and Forecast, by Distribution Channel (2023-2030) 4.5.1.4.1. Online Retail 4.5.1.4.2. E-Commerce Platforms 4.5.1.4.3. Specialty Stores 4.5.1.4.4. Veterinary Supply Stores 4.5.1.4.5. Direct Sales 4.5.2. Canada 4.5.2.1. Canada Farrier Products Market Size and Forecast, by Product Type (2023-2030) 4.5.2.1.1. Horseshoes 4.5.2.1.2. Nails 4.5.2.1.3. Rasps 4.5.2.1.4. Hoof Knives 4.5.2.1.5. Anvils 4.5.2.1.6. Hammers 4.5.2.1.7. Hoof Stands 4.5.2.1.8. Hoof Care Solutions 4.5.2.2. Canada Farrier Products Market Size and Forecast, by Price Range (2023-2030) 4.5.2.2.1. Low 4.5.2.2.2. Medium 4.5.2.2.3. High 4.5.2.3. Canada Farrier Products Market Size and Forecast, by End User (2023-2030) 4.5.2.3.1. Professional Farriers 4.5.2.3.2. Veterinary Clinics 4.5.2.3.3. Equestrian Centers 4.5.2.3.4. Horse Owners 4.5.2.4. Canada Farrier Products Market Size and Forecast, by Distribution Channel (2023-2030) 4.5.2.4.1. Online Retail 4.5.2.4.2. E-Commerce Platforms 4.5.2.4.3. Specialty Stores 4.5.2.4.4. Veterinary Supply Stores 4.5.2.4.5. Direct Sales 4.5.3. Mexico 4.5.3.1. Mexico Farrier Products Market Size and Forecast, by Product Type (2023-2030) 4.5.3.1.1. Horseshoes 4.5.3.1.2. Nails 4.5.3.1.3. Rasps 4.5.3.1.4. Hoof Knives 4.5.3.1.5. Anvils 4.5.3.1.6. Hammers 4.5.3.1.7. Hoof Stands 4.5.3.1.8. Hoof Care Solutions 4.5.3.2. Mexico Farrier Products Market Size and Forecast, by Price Range (2023-2030) 4.5.3.2.1. Low 4.5.3.2.2. Medium 4.5.3.2.3. High 4.5.3.3. Mexico Farrier Products Market Size and Forecast, by End User (2023-2030) 4.5.3.3.1. Professional Farriers 4.5.3.3.2. Veterinary Clinics 4.5.3.3.3. Equestrian Centers 4.5.3.3.4. Horse Owners 4.5.3.4. Mexico Farrier Products Market Size and Forecast, by Distribution Channel (2023-2030) 4.5.3.4.1. Online Retail 4.5.3.4.2. E-Commerce Platforms 4.5.3.4.3. Specialty Stores 4.5.3.4.4. Veterinary Supply Stores 4.5.3.4.5. Direct Sales 5. Europe Farrier Products Market Size and Forecast by Segmentation (by Value in USD Million) 2023-2030 5.1. Europe Farrier Products Market Size and Forecast, by Product Type (2023-2030) 5.2. Europe Farrier Products Market Size and Forecast, by Price Range (2023-2030) 5.3. Europe Farrier Products Market Size and Forecast, by End User (2023-2030) 5.4. Europe Farrier Products Market Size and Forecast, by Distribution Channel (2023-2030) 5.5. Europe Farrier Products Market Size and Forecast, by Country (2023-2030) 5.5.1. United Kingdom 5.5.1.1. United Kingdom Farrier Products Market Size and Forecast, by Product Type (2023-2030) 5.5.1.2. United Kingdom Farrier Products Market Size and Forecast, by Price Range (2023-2030) 5.5.1.3. United Kingdom Farrier Products Market Size and Forecast, by End User (2023-2030) 5.5.1.4. United Kingdom Farrier Products Market Size and Forecast, by Distribution Channel (2023-2030) 5.5.2. France 5.5.2.1. France Farrier Products Market Size and Forecast, by Product Type (2023-2030) 5.5.2.2. France Farrier Products Market Size and Forecast, by Price Range (2023-2030) 5.5.2.3. France Farrier Products Market Size and Forecast, by End User (2023-2030) 5.5.2.4. France Farrier Products Market Size and Forecast, by Distribution Channel (2023-2030) 5.5.3. Germany 5.5.3.1. Germany Farrier Products Market Size and Forecast, by Product Type (2023-2030) 5.5.3.2. Germany Farrier Products Market Size and Forecast, by Price Range (2023-2030) 5.5.3.3. Germany Farrier Products Market Size and Forecast, by End User (2023-2030) 5.5.3.4. Germany Farrier Products Market Size and Forecast, by Distribution Channel (2023-2030) 5.5.4. Italy 5.5.4.1. Italy Farrier Products Market Size and Forecast, by Product Type (2023-2030) 5.5.4.2. Italy Farrier Products Market Size and Forecast, by Price Range (2023-2030) 5.5.4.3. Italy Farrier Products Market Size and Forecast, by End User (2023-2030) 5.5.4.4. Italy Farrier Products Market Size and Forecast, by Distribution Channel (2023-2030) 5.5.5. Spain 5.5.5.1. Spain Farrier Products Market Size and Forecast, by Product Type (2023-2030) 5.5.5.2. Spain Farrier Products Market Size and Forecast, by Price Range (2023-2030) 5.5.5.3. Spain Farrier Products Market Size and Forecast, by End User (2023-2030) 5.5.5.4. Spain Farrier Products Market Size and Forecast, by Distribution Channel (2023-2030) 5.5.6. Sweden 5.5.6.1. Sweden Farrier Products Market Size and Forecast, by Product Type (2023-2030) 5.5.6.2. Sweden Farrier Products Market Size and Forecast, by Price Range (2023-2030) 5.5.6.3. Sweden Farrier Products Market Size and Forecast, by End User (2023-2030) 5.5.6.4. Sweden Farrier Products Market Size and Forecast, by Distribution Channel (2023-2030) 5.5.7. Austria 5.5.7.1. Austria Farrier Products Market Size and Forecast, by Product Type (2023-2030) 5.5.7.2. Austria Farrier Products Market Size and Forecast, by Price Range (2023-2030) 5.5.7.3. Austria Farrier Products Market Size and Forecast, by End User (2023-2030) 5.5.7.4. Austria Farrier Products Market Size and Forecast, by Distribution Channel (2023-2030) 5.5.8. Rest of Europe 5.5.8.1. Rest of Europe Farrier Products Market Size and Forecast, by Product Type (2023-2030) 5.5.8.2. Rest of Europe Farrier Products Market Size and Forecast, by Price Range (2023-2030) 5.5.8.3. Rest of Europe Farrier Products Market Size and Forecast, by End User (2023-2030) 5.5.8.4. Rest of Europe Farrier Products Market Size and Forecast, by Distribution Channel (2023-2030) 6. Asia Pacific Farrier Products Market Size and Forecast by Segmentation (by Value in USD Million) 2023-2030 6.1. Asia Pacific Farrier Products Market Size and Forecast, by Product Type (2023-2030) 6.2. Asia Pacific Farrier Products Market Size and Forecast, by Price Range (2023-2030) 6.3. Asia Pacific Farrier Products Market Size and Forecast, by End User (2023-2030) 6.4. Asia Pacific Farrier Products Market Size and Forecast, by Distribution Channel (2023-2030) 6.5. Asia Pacific Farrier Products Market Size and Forecast, by Country (2023-2030) 6.5.1. China 6.5.1.1. China Farrier Products Market Size and Forecast, by Product Type (2023-2030) 6.5.1.2. China Farrier Products Market Size and Forecast, by Price Range (2023-2030) 6.5.1.3. China Farrier Products Market Size and Forecast, by End User (2023-2030) 6.5.1.4. China Farrier Products Market Size and Forecast, by Distribution Channel (2023-2030) 6.5.2. S Korea 6.5.2.1. S Korea Farrier Products Market Size and Forecast, by Product Type (2023-2030) 6.5.2.2. S Korea Farrier Products Market Size and Forecast, by Price Range (2023-2030) 6.5.2.3. S Korea Farrier Products Market Size and Forecast, by End User (2023-2030) 6.5.2.4. S Korea Farrier Products Market Size and Forecast, by Distribution Channel (2023-2030) 6.5.3. Japan 6.5.3.1. Japan Farrier Products Market Size and Forecast, by Product Type (2023-2030) 6.5.3.2. Japan Farrier Products Market Size and Forecast, by Price Range (2023-2030) 6.5.3.3. Japan Farrier Products Market Size and Forecast, by End User (2023-2030) 6.5.3.4. Japan Farrier Products Market Size and Forecast, by Distribution Channel (2023-2030) 6.5.4. India 6.5.4.1. India Farrier Products Market Size and Forecast, by Product Type (2023-2030) 6.5.4.2. India Farrier Products Market Size and Forecast, by Price Range (2023-2030) 6.5.4.3. India Farrier Products Market Size and Forecast, by End User (2023-2030) 6.5.4.4. India Farrier Products Market Size and Forecast, by Distribution Channel (2023-2030) 6.5.5. Australia 6.5.5.1. Australia Farrier Products Market Size and Forecast, by Product Type (2023-2030) 6.5.5.2. Australia Farrier Products Market Size and Forecast, by Price Range (2023-2030) 6.5.5.3. Australia Farrier Products Market Size and Forecast, by End User (2023-2030) 6.5.5.4. Australia Farrier Products Market Size and Forecast, by Distribution Channel (2023-2030) 6.5.6. Indonesia 6.5.6.1. Indonesia Farrier Products Market Size and Forecast, by Product Type (2023-2030) 6.5.6.2. Indonesia Farrier Products Market Size and Forecast, by Price Range (2023-2030) 6.5.6.3. Indonesia Farrier Products Market Size and Forecast, by End User (2023-2030) 6.5.6.4. Indonesia Farrier Products Market Size and Forecast, by Distribution Channel (2023-2030) 6.5.7. Malaysia 6.5.7.1. Malaysia Farrier Products Market Size and Forecast, by Product Type (2023-2030) 6.5.7.2. Malaysia Farrier Products Market Size and Forecast, by Price Range (2023-2030) 6.5.7.3. Malaysia Farrier Products Market Size and Forecast, by End User (2023-2030) 6.5.7.4. Malaysia Farrier Products Market Size and Forecast, by Distribution Channel (2023-2030) 6.5.8. Vietnam 6.5.8.1. Vietnam Farrier Products Market Size and Forecast, by Product Type (2023-2030) 6.5.8.2. Vietnam Farrier Products Market Size and Forecast, by Price Range (2023-2030) 6.5.8.3. Vietnam Farrier Products Market Size and Forecast, by End User (2023-2030) 6.5.8.4. Vietnam Farrier Products Market Size and Forecast, by Distribution Channel (2023-2030) 6.5.9. Taiwan 6.5.9.1. Taiwan Farrier Products Market Size and Forecast, by Product Type (2023-2030) 6.5.9.2. Taiwan Farrier Products Market Size and Forecast, by Price Range (2023-2030) 6.5.9.3. Taiwan Farrier Products Market Size and Forecast, by End User (2023-2030) 6.5.9.4. Taiwan Farrier Products Market Size and Forecast, by Distribution Channel (2023-2030) 6.5.10. Rest of Asia Pacific 6.5.10.1. Rest of Asia Pacific Farrier Products Market Size and Forecast, by Product Type (2023-2030) 6.5.10.2. Rest of Asia Pacific Farrier Products Market Size and Forecast, by Price Range (2023-2030) 6.5.10.3. Rest of Asia Pacific Farrier Products Market Size and Forecast, by End User (2023-2030) 6.5.10.4. Rest of Asia Pacific Farrier Products Market Size and Forecast, by Distribution Channel (2023-2030) 7. Middle East and Africa Farrier Products Market Size and Forecast by Segmentation (by Value in USD Million) 2023-2030 7.1. Middle East and Africa Farrier Products Market Size and Forecast, by Product Type (2023-2030) 7.2. Middle East and Africa Farrier Products Market Size and Forecast, by Price Range (2023-2030) 7.3. Middle East and Africa Farrier Products Market Size and Forecast, by End User (2023-2030) 7.4. Middle East and Africa Farrier Products Market Size and Forecast, by Distribution Channel (2023-2030) 7.5. Middle East and Africa Farrier Products Market Size and Forecast, by Country (2023-2030) 7.5.1. South Africa 7.5.1.1. South Africa Farrier Products Market Size and Forecast, by Product Type (2023-2030) 7.5.1.2. South Africa Farrier Products Market Size and Forecast, by Price Range (2023-2030) 7.5.1.3. South Africa Farrier Products Market Size and Forecast, by End User (2023-2030) 7.5.1.4. South Africa Farrier Products Market Size and Forecast, by Distribution Channel (2023-2030) 7.5.2. GCC 7.5.2.1. GCC Farrier Products Market Size and Forecast, by Product Type (2023-2030) 7.5.2.2. GCC Farrier Products Market Size and Forecast, by Price Range (2023-2030) 7.5.2.3. GCC Farrier Products Market Size and Forecast, by End User (2023-2030) 7.5.2.4. GCC Farrier Products Market Size and Forecast, by Distribution Channel (2023-2030) 7.5.3. Nigeria 7.5.3.1. Nigeria Farrier Products Market Size and Forecast, by Product Type (2023-2030) 7.5.3.2. Nigeria Farrier Products Market Size and Forecast, by Price Range (2023-2030) 7.5.3.3. Nigeria Farrier Products Market Size and Forecast, by End User (2023-2030) 7.5.3.4. Nigeria Farrier Products Market Size and Forecast, by Distribution Channel (2023-2030) 7.5.4. Rest of ME&A 7.5.4.1. Rest of ME&A Farrier Products Market Size and Forecast, by Product Type (2023-2030) 7.5.4.2. Rest of ME&A Farrier Products Market Size and Forecast, by Price Range (2023-2030) 7.5.4.3. Rest of ME&A Farrier Products Market Size and Forecast, by End User (2023-2030) 7.5.4.4. Rest of ME&A Farrier Products Market Size and Forecast, by Distribution Channel (2023-2030) 8. South America Farrier Products Market Size and Forecast by Segmentation (by Value in USD Million) 2023-2030 8.1. South America Farrier Products Market Size and Forecast, by Product Type (2023-2030) 8.2. South America Farrier Products Market Size and Forecast, by Price Range (2023-2030) 8.3. South America Farrier Products Market Size and Forecast, by End User(2023-2030) 8.4. South America Farrier Products Market Size and Forecast, by Distribution Channel (2023-2030) 8.5. South America Farrier Products Market Size and Forecast, by Country (2023-2030) 8.5.1. Brazil 8.5.1.1. Brazil Farrier Products Market Size and Forecast, by Product Type (2023-2030) 8.5.1.2. Brazil Farrier Products Market Size and Forecast, by Price Range (2023-2030) 8.5.1.3. Brazil Farrier Products Market Size and Forecast, by End User (2023-2030) 8.5.1.4. Brazil Farrier Products Market Size and Forecast, by Distribution Channel (2023-2030) 8.5.2. Argentina 8.5.2.1. Argentina Farrier Products Market Size and Forecast, by Product Type (2023-2030) 8.5.2.2. Argentina Farrier Products Market Size and Forecast, by Price Range (2023-2030) 8.5.2.3. Argentina Farrier Products Market Size and Forecast, by End User (2023-2030) 8.5.2.4. Argentina Farrier Products Market Size and Forecast, by Distribution Channel (2023-2030) 8.5.3. Rest Of South America 8.5.3.1. Rest Of South America Farrier Products Market Size and Forecast, by Product Type (2023-2030) 8.5.3.2. Rest Of South America Farrier Products Market Size and Forecast, by Price Range (2023-2030) 8.5.3.3. Rest Of South America Farrier Products Market Size and Forecast, by End User (2023-2030) 8.5.3.4. Rest Of South America Farrier Products Market Size and Forecast, by Distribution Channel (2023-2030) 9. Global Farrier Products Market: Competitive Landscape 9.1. MMR Competition Matrix 9.2. Competitive Landscape 9.3. Key Players Benchmarking 9.3.1. Company Name 9.3.2. Business Segment 9.3.3. End-user Segment 9.3.4. Revenue (2022) 9.3.5. Company Locations 9.4. Leading Farrier Products Market Companies, by market capitalization 9.5. Market Structure 9.5.1. Market Leaders 9.5.2. Market Followers 9.5.3. Emerging Players 9.6. Mergers and Acquisitions Details 10. Company Profile: Key Players 10.1. Diamond Farrier Co. (United States) 10.1.1. Company Overview 10.1.2. Business Portfolio 10.1.3. Financial Overview 10.1.4. SWOT Analysis 10.1.5. Strategic Analysis 10.1.6. Scale of Operation (small, medium, and large) 10.1.7. Details on Partnership 10.1.8. Regulatory Accreditations and Certifications Received by Them 10.1.9. Awards Received by the Firm 10.1.10. Recent Developments 10.2. Capewell Components Company (United States) 10.3. Anvil Brand (United States) 10.4. Vettec Hoof Care (United States) 10.5. NC Tool Co. (United States) 10.6. Mustad Hoofcare (Norway) 10.7. Strasser Huftechnik (Germany) 10.8. Kerckhaert Horseshoe Factory (Netherlands) 10.9. MNC Farrier Supplies (United Kingdom) 10.10. Jim Blurton Farrier Tools (United Kingdom) 10.11. Kerkhaert Horseshoe (Belgium) 10.12. Burgess Farrier Supplies (Australia) 10.13. Embee Sunway (India) 10.14. DS Farrier Solutions (Australia) 10.15. Polyflex Horseshoes (Australia) 10.16. SoundHorse Technologies (New Zealand) 10.17. Polyshoe (South Africa) 10.18. AJ Farrier Supplies (South Africa) 10.19. Izmir Horseshoes (Turkey) 10.20. Gévelot SA (France) 10.21. Mustad Argentina (Argentina) 10.22. Horseshop Brasil (Brazil) 10.23. Hufschmied Jacaré (Brazil) 10.24. Caballería Herrería (Argentina) 10.25. CB Products (Brazil) 11. Key Findings 12. Industry Recommendations 13. Farrier Products Market: Research Methodology 14. Terms and Glossary
  • INQUIRE BEFORE BUYING