Europe E-paper Display Market – Industry Analysis and Market Forecast (2019-2026) _ by Product, Applications, and Geography

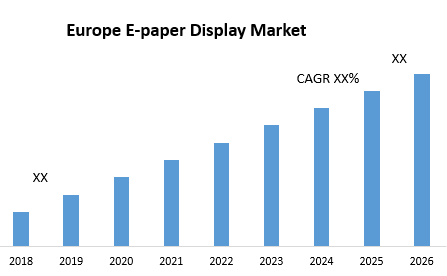
Europe Epaper Display Market is expected to grow at a CAGR of 23.12% during the forecast period and market is expected to reach US$ 2.11 Bn. by 2026. The report includes the analysis of impact of COVID-19 lock-down on the revenue of market leaders, followers, and disrupters. Since lock down was implemented differently in different regions and countries, impact of same is also different by regions and segments. The report has covered the current short term and long term impact on the market, same will help decision makers to prepare the outline for short term and long term strategies for companies by region. Europe E-paper Display Market To know about the Research Methodology :- Request Free Sample Report

Europe E-paper Display Market, Dynamics:

E-paper, also known as electronic paper, is a special technology that mimics the appearance of an ordinary ink on paper in the digital platform. The electronic paper display differ from normal LCD panels as they reflect light like paper, rather than emitting light. E-paper displays contain millions of microscopic capsules filled with a clear fluid that contains microscopic particles of different colours and electrical charges. The electrodes located above and below the capsules travel up and down when a positive or negative electric field is applied to make the surface of the l-paper display reflect a certain colour. The E-paper is normally stable, hence no power is needed to retaining an image, and the reflective ambient light present reflects from the normal surface of the display. A few of the main advantages of electronic paper over traditional LCD screens lies in its paper-like readability along with extremely low power consumption. The e-paper reduces eyestrain as it simulates paper rather than a normal computer screen. E-paper is also comparatively easier to read outdoors and in bright sunlight as the mode of display can get adjusted as per the outdoor brightness. It is, therefore, being used and is perfect for all indoor and outdoor displays like interactive museum signs, traffic signs, retail shelf labels, and notice boards passenger information board among others. Electronic paper displays also provide higher-resolution and no glare visibility that allows users to view text and pictures clearly and at any angle. These are some of the factors to drive the market growth for EPDs in Europe. The electronic displays across the electronics sector that is undergoing a technological boom have further boosted the overall market growth.

Europe E-paper Display Market , Regional Analysis:

Europe forms another major region for E-paper Display globally where Germany, the UK, and Russia are some of the major countries contributing to the overall growth. E-paper has multiple applications, are sustainable and do not require additional cables. E-paper power consumption is really minimal since electronic paper displays need no power to display an image; they simply use power to change the content hence, boosting the market growth in Europe.

Europe E-paper Display Market, Key Highlights:

• Europe E-paper Display market size analysis and forecast. • Comprehensive study and analysis of market drivers, restraints, and opportunities influencing the growth of the Europe E-paper Display market • Europe E-paper Display Market segmentation on the basis of product, application, and geography. • Europe E-paper Display Market strategic analysis with respect to individual growth trends, future prospects along with a contribution of various sub-market stakeholders have been considered under the scope of the study • Europe E-paper Display Market analysis and forecast for major countries has been provided. • Profiling of key industry players, their strategic perspective, market positioning and analysis of core competencies • Competitive landscape of the key players operating in the Europe E-paper Display Market including competitive developments, investments, and strategic expansion market stakeholders have been considered under the scope of the study • Europe E-paper Display Market analysis and forecast for major countries has been provided. • Profiling of key industry players, their strategic perspective, market positioning and analysis of core competencies • Competitive landscape of the key players operating in the Europe E-paper Display Market including competitive developments, investments, and strategic expansion

The scope of the Market: Inquire before buying

The research report segments Europe E-paper Display market based on product, application, and geography.

Market, by Product:

• Auxiliary Displays • Electronic Shelf Labels • E-Readers • Others

Market, by Application:

• Automotive & Transportation • Consumer & Wearable Electronics • Institutional • Media & Entertainment • Retail & Enterprise • Others

Market, By Geography:

• Europe o UK o Germany o France o Russia o Italy o Spain

Geographic Analysis

• Breakdown of UK E-paper Display market • Breakdown of Germany E-paper Display market • Breakdown of Italy E-paper Display market • Breakdown of Russia E-paper Display market • Breakdown of France E-paper Display market • Breakdown of Spain E-paper Display market • Breakdown of Others E-paper Display market

Available Customization

Maximize Market Research offers customizations of reports according to the specific requirement of our clients.

Europe E-paper Display Market

1. EXECUTIVE SUMMARY 2. RESEARCH METHODOLOGY 2.1. Market Definition 2.2. Market Scope 2.3. Data Sources 3. MARKET VARIABLES & SCOPE 3.1. Market Segmentation & Scope 3.2. Market Driver Analysis 3.3. Market Restraint Analysis 3.4. Porter’s Five Forces Analysis 3.5. PESTLE Analysis 4. EUROPE E-PAPER DISPLAY PRODUCT ESTIMATES & TREND ANALYSIS (2019 – 2026) 4.1. E-Paper Display Market: Product Analysis 4.2. Auxiliary Displays 4.2.1. Auxiliary Displays market, 2019 – 2026 (USD Billion) 4.3. Electronic Shelf Labels 4.3.1. Electronic Shelf Labels market, 2019 – 2026 (USD Billion) 4.4. E-Readers 4.4.1. E-Readers market, 2019 – 2026 (USD Billion) 4.5. Others 4.5.1. Others market, 2019 – 2026 (USD Billion) 5. EUROPE E-PAPER DISPLAY APPLICATION ESTIMATES & TREND ANALYSIS (2019 – 2026) 5.1. E-Paper Display Market: Application Analysis 5.2. Automotive & Transportation 5.2.1. Automotive & Transportation market, 2019 – 2026 (USD Billion) 5.3. Consumer & Wearable Electronics 5.3.1. Consumer & Wearable Electronics market, 2019 – 2026 (USD Billion) 5.4. Institutional 5.4.1. Institutional market, 2019 – 2026 (USD Billion) 5.5. Media & Entertainment 5.5.1. Media & Entertainment market, 2019 – 2026 (USD Billion) 5.6. Retail & Enterprise 5.6.1. Retail & Enterprise market, 2019 – 2026 (USD Billion) 5.7. Others 5.7.1. Others market, 2019 – 2026 (USD Billion) 6. REGIONAL E-PAPER DISPLAY ESTIMATES & TREND ANALYSIS (2019 – 2026) 6.1. E-paper Display market share by country, 2016 & 2025 6.1.1. UK 6.1.1.1. UK Medical Robotics market, 2016 – 2026 (USD billion) 6.1.2. Germany 6.1.2.1. Germany Medical Robotics market, 2016 – 2026 (USD billion) 6.1.3. France 6.1.3.1. France Medical Robotics market, 2016 – 2026 (USD billion) 6.1.4. Russia 6.1.4.1. Russia Medical Robotics market, 2016 – 2026 (USD billion) 6.1.5. Italy 6.1.5.1. Italy Medical Robotics market, 2016 – 2026 (USD billion) 6.1.6. Spain 6.1.6.1. Spain Medical Robotics market, 2016 – 2026 (USD billion) 7. MARKET SHARE ANALYSIS 7.1. Regional E-paper Display Market Share Analysis, by Key Players 7.1.1. UK E-paper Display Market Share Analysis, by Key Players 7.1.2. Germany E-paper Display Market Share Analysis, by Key Players 7.1.3. France E-paper Display Market Share Analysis, by Key Players 7.1.4. Russia E-paper Display Market Share Analysis, by Key Players 7.1.5. Italy E-paper Display Market Share Analysis, by Key Players 7.1.6. Spain E-paper Display Market Share Analysis, by Key Players 7.2. E-paper Display Market: Key Innovators 7.3. Patent Analysis Year 2017 8. MARKET COMPETITION ANALYSIS 8.1. Strategy Framework 8.2. Company Profiles 8.2.1. E Ink 8.2.1.1. Company overview 8.2.1.2. Key financials 8.2.1.3. Product landscape 8.2.1.4. Strategic initiatives 8.2.1.5. SWOT analysis 8.2.2. LCDtek 8.2.2.1. Company overview 8.2.2.2. Key financials 8.2.2.3. Product landscape 8.2.2.4. Strategic initiatives 8.2.2.5. SWOT analysis 8.2.3. GTK UK 8.2.3.1. Company overview 8.2.3.2. Key financials 8.2.3.3. Product landscape 8.2.3.4. Strategic initiatives 8.2.3.5. SWOT analysis 8.2.4. Plastic Logic 8.2.4.1. Company overview 8.2.4.2. Key financials 8.2.4.3. Product landscape 8.2.4.4. Strategic initiatives 8.2.4.5. SWOT analysis 8.2.5. Smart City Displays 8.2.5.1. Company overview 8.2.5.2. Key financials 8.2.5.3. Product landscape 8.2.5.4. Strategic initiatives 8.2.5.5. SWOT analysis 8.2.6. Pervasive 8.2.6.1. Company overview 8.2.6.2. Key financials 8.2.6.3. Product landscape 8.2.6.4. Strategic initiatives 8.2.6.5. SWOT analysis 8.2.7. Densitron 8.2.7.1. Company overview 8.2.7.2. Key financials 8.2.7.3. Product landscape 8.2.7.4. Strategic initiatives 8.2.7.5. SWOT analysis 8.2.8. Visionect 8.2.8.1. Company overview 8.2.8.2. Key financials 8.2.8.3. Product landscape 8.2.8.4. Strategic initiatives 8.2.8.5. SWOT analysis 8.2.9. Trueform Engineering 8.2.9.1. Company overview 8.2.9.2. Key financials 8.2.9.3. Product landscape 8.2.9.4. Strategic initiatives 8.2.9.5. SWOT analysis 8.2.10. PicoSign 8.2.10.1. Company overview 8.2.10.2. Key financials 8.2.10.3. Product landscape 8.2.10.4. Strategic initiatives 8.2.10.5. SWOT analysis 8.2.11. CLEARink Displays 8.2.11.1. Company overview 8.2.11.2. Key financials 8.2.11.3. Product landscape 8.2.11.4. Strategic initiatives 8.2.11.5. SWOT analysis 8.2.12. NEMOPTIC 8.2.12.1. Company overview 8.2.12.2. Key financials 8.2.12.3. Product landscape 8.2.12.4. Strategic initiatives 8.2.12.5. SWOT analysis 8.2.13. Japan Display Inc. 8.2.13.1. Company overview 8.2.13.2. Key financials 8.2.13.3. Product landscape 8.2.13.4. Strategic initiatives 8.2.13.5. SWOT analysis 8.2.14. LG 8.2.14.1. Company overview 8.2.14.2. Key financials 8.2.14.3. Product landscape 8.2.14.4. Strategic initiatives 8.2.14.5. SWOT analysis 8.2.15. Motion Display 8.2.15.1. Company overview 8.2.15.2. Key financials 8.2.15.3. Product landscape 8.2.15.4. Strategic initiatives 8.2.15.5. SWOT analysis 8.2.16. Opticon 8.2.16.1. Company overview 8.2.16.2. Key financials 8.2.16.3. Product landscape 8.2.16.4. Strategic initiatives 8.2.16.5. SWOT analysis 8.2.17. Toppan Printing 8.2.17.1. Company overview 8.2.17.2. Key financials 8.2.17.3. Product landscape 8.2.17.4. Strategic initiatives 8.2.17.5. SWOT analysis 8.2.18. Mashable 8.2.18.1. Company overview 8.2.18.2. Key financials 8.2.18.3. Product landscape 8.2.18.4. Strategic initiatives 8.2.18.5. SWOT analysis 8.2.19. OED Technologies 8.2.19.1. Company overview 8.2.19.2. Key financials 8.2.19.3. Product landscape 8.2.19.4. Strategic initiatives 8.2.19.5. SWOT analysis 8.2.20. Qualcomm 8.2.20.1. Company overview 8.2.20.2. Key financials 8.2.20.3. Product landscape 8.2.20.4. Strategic initiatives 8.2.20.5. SWOT analysis 8.2.21. Liquavista 8.2.21.1. Company overview 8.2.21.2. Key financials 8.2.21.3. Product landscape 8.2.21.4. Strategic initiatives 8.2.21.5. SWOT analysis 8.2.22. Plastic Logic 8.2.22.1. Company overview 8.2.22.2. Key financials 8.2.22.3. Product landscape 8.2.22.4. Strategic initiatives 8.2.22.5. SWOT analysis 8.2.23. Pervasive Displays 8.2.23.1. Company overview 8.2.23.2. Key financials 8.2.23.3. Product landscape 8.2.23.4. Strategic initiatives 8.2.23.5. SWOT analysis 8.2.24. Gamma Dynamics 8.2.24.1. Company overview 8.2.24.2. Key financials 8.2.24.3. Product landscape 8.2.24.4. Strategic initiatives 8.2.24.5. SWOT analysis 8.2.25. ITRI 8.2.25.1. Company overview 8.2.25.2. Key financials 8.2.25.3. Product landscape 8.2.25.4. Strategic initiatives 8.2.25.5. SWOT analysis
  • INQUIRE BEFORE BUYING